China's Equine Industries in a Transitional Economy: Development, Trends, Challenges, and Opportunities - MDPI
←
→
Page content transcription
If your browser does not render page correctly, please read the page content below
sustainability

Article
China’s Equine Industries in a Transitional Economy:
Development, Trends, Challenges, and Opportunities
Qingbin Wang 1, *          and Yang Zou 2, *
 1    Department of Community Development and Applied Economics, University of Vermont, Burlington,
      VT 05405, USA
 2    Department of Public Finance, School of Economics, Nankai University, Tianjin 300071, China
 *    Correspondence: qwang@uvm.edu (Q.W.); yzou33@nankai.edu.cn (Y.Z.)

 Received: 1 April 2020; Accepted: 19 June 2020; Published: 24 June 2020

 Abstract: China had the most horses in the world from 1961 to 2004 but, since the market-oriented
 economic transition started in the late 1970s, its horse population has declined significantly and
 steadily, from 11.50 million in 1978 to only 3.47 million in 2018. While there are minimal studies on
 China’s equine industries in the literature, this paper reviews the development of China’s equine
 industries since 1949, identifies major factors contributing to the steady decline in its horse population
 since 1978, and discusses the challenges and opportunities for the development of China’s equine
 industries. Empirical results suggest that the changes in China’s horse population since 1949
 have been closely associated with its agricultural and rural development and policies, and the key
 factors contributing to the declining horse population since 1978 include agricultural mechanization,
 a steady decrease of the agricultural sector’s share in the GDP, urbanization, improvement in rural
 transportation with more motor vehicles, and decreased land availability for and the lack of economic
 returns from horses. Together, such factors may continue to reduce China’s horse population, but,
 on the other hand, the rapid development in the tourism, recreation, and sport sectors may provide
 potential growth opportunities. Moreover, China’s horse population is likely to be more concentrated
 in Inner Mongolia, Xinjiang, Tibet, and the western Sichuan province, which have relatively low
 population density and high proportion of ethnic population with the tradition of horses in their
 cultural, religious, sport, and economic activities. At the same time, equestrian events and activities
 are expected to continue to increase at significant rates in and around large Chinese cities.

 Keywords: equine industry; horse; China; horsemanship; equestrian clubs

1. Introduction
      Horses have played very important roles in Chinese history and culture. With the exception
of the mythical dragon, horses are probably the most important and recurrent animal in Chinese
culture, often acting as a symbol of speed, courage, integrity, diligence, perseverance, power, energy,
leadership, and success [1–3]. In addition to their contributions to transportation and farming, horses
were also an important part of China’s military force and a determining factor of many changes in the
country’s territories and borders. For example, the Great Wall was built to protect and consolidate
territories of Chinese states and empires against various nomadic warriors on horseback from the
north. The important role of horses in Chinese history and culture is well summarized by Creel [1]:
“China’s foreign relations, military policy, economic well-being, and indeed its very existence as an
independent state were importantly conditioned by the horse.”
      While the role of horses in Chinese history and their cultural influence in some other areas have
been well documented in the literature [1–3], this study examines the development and trends of
China’s equine industries since 1949. The term industries rather than industry is used because of

Sustainability 2020, 12, 5135; doi:10.3390/su12125135                      www.mdpi.com/journal/sustainability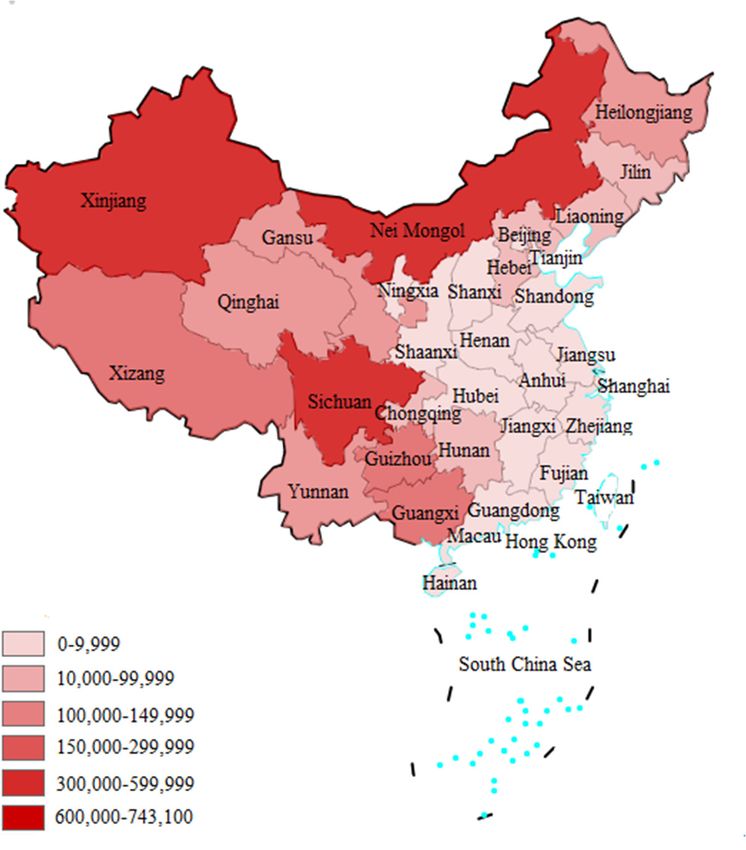
Sustainability 2020, 12, 5135                                                                      2 of 14

the different ways horses are employed, viewed, and treated across sub-sectors such as farming,
transportation, sports, recreation, and equine-assisted therapy [4]. According to the database of
the Food and Agriculture Organization (FAO) of the United Nations for 1961–2017 [5] and China’s
statistical yearbooks published by the National Bureau of Statistics of China (NBSC) [6], China had the
highest number of horses in the world from 1961 to 2004 (and likely some years prior to 1961, though
there are no data to confirm it). However, China’s horse population has dropped significantly and
steadily since its market-oriented economic transition, started in the late 1970s, from 11.50 million in
1978 to only 3.47 million in 2018 [6]. The dramatic changes in China’s horse population since 1961
are unique when compared with those of other major horse nations. For example, the United States
has experienced a significant and steady increase in its horse population since the mid-1960s and
has been the world’s largest horse nation since 2004 [5]. One interesting question is whether income
and economic growth in the United States is a contributing factor of the steady increase in its horse
population since the early 1960s and, if so, why the rapid income and economic growth in China since
the late 1970s has likely contributed to the steady decline in its horse population.
      China’s equine industries have experienced significant changes since the People’s Republic of
China was established in 1949, especially since the market-oriented economic transition started in 1978,
but there are few studies on China’s equine industries in the literature. Our review of the literature
in both English and Chinese suggests that, except for a few studies on the role of horses in Chinese
history and culture [1–3] and some veterinary studies, there are extremely limited socioeconomic
studies on China’s equine industries. As China was the largest horse country from 1961 to 2004 and
dropped to the fifth largest horse nation in 2017, according to FAO and NBSC data [5,6], there are many
interesting but unanswered questions about China’s equine industries. What are the major factors
for the dramatic decline in China’s horse population since 1978? Have there been any significant
changes in the regional distribution of the horse population in China? What are the challenges and
opportunities for the equine industries in China’s transitional economy? How are China’s equine
industries linked to the rest of the world through trade and other activities like sports and tourism?
      The major objectives of this study are to review the development of China’s equine industries
since 1949, identify major factors contributing to the steady decline in its horse population since 1978,
and discuss the challenges and opportunities for the horse industries’ development. Specifically,
the most recently available data from FAO and NBSC are used to assess the national trends and regional
distributions of China’s horse population through a graphical analysis, and to identify the major factors
behind the steady decline in China’s horse population and quantify their impacts through a regression
analysis. While equine industries and their roles in the local economy, climate change, and sustainable
development have received more attention in recent years [7–12], this study contributes to the literature
by addressing several research questions about the equine industries in China, a large equine nation
but understudied in the equine literature. This paper is organized into five sections: Following this
introduction, Section 2 introduces the data and methods, Section 3 presents the empirical results,
Section 4 discusses the challenges and opportunities for China’s equine industries, and Section 5
summarizes the major conclusions.

2. Data and Methods
     The data used in this study are from four sources: (a) FAO’s online database (FAOSTAT),
that includes horse population, exports, and imports for China and many other nations from 1961 to
2017; (b) China’s statistical yearbooks, published by NBSC, that include China’s total horse population
from 1949 to 1965 and from 1970 to 2018, as well as the horse population by province from 1978 to
2018; (c) media reports, newspapers, two popular equestrian magazines in China (Horsemanship and
World Horsemanship), government publications, etc.; and (d) China’s agricultural yearbooks, population
yearbooks, and other yearbooks published by different Chinese government agencies.
     While China has 23 provinces, four municipalities, five autonomous regions, and two special
administrative regions (Hong Kong and Macao), this study does not include Taiwan, Hong Kong, and
Sustainability 2020, 12, 5135                                                                             3 of 14

Macao due to data limitation. Furthermore, all the provinces, municipalities, and autonomous regions
are referred to as provinces in this paper.
      There are three differences in China’s horse population data from FAO and NBSC: First, while the
horse population from NBSC is specified as the end-of-year data, FAO data are the beginning-of-year
data, although this is not specified by FAO. When the FAO data are adjusted by one year, they are
almost 100% consistent with the NBSC data. Second, China’s horse population from 1966 to 1969 is
not available in NBSC data but is available in the FAO database and was likely estimated by FAO.
Third, NBSC adjusted China’s annual horse population from 2006 to 2016 to a lower level in China’s
statistical yearbooks published in 2018 and 2019, without any explanation. As a result, the data from
NBSC are significantly lower than those from FAO for 2006 to 2016. While China has a well-established
statistical reporting system, with almost every village and community accounted for by NBSC, data on
China’s horse population are likely to be more accurate and consistent than those from many other
developing nations. The number of horses is reported in the same way as that of hogs, cows, goats,
camels, and other large animals in China [6].
      Data from the above sources are used to attain the research objectives through a graphical analysis
and a regression analysis. Specifically, the national data are used to assess the national development
and trends through a graphical analysis, while the regional data from 1978 to 2018 are used to examine
the changes in the regional distribution through graphs and GIS maps, and the panel data by province
from 1993 to 2018 are used to identify the factors contributing to the decline in horse population and
quantify their impacts through the following regression model:

             Yit = a + b PDit-1 + c UPit-1 + d SPit-1 + g MPit-1 + h CAit-1 + j ARit-1 + k BRit-1 + eit

where Y is the horse population, PD is the population density, UP is the proportion of urban population,
SP is the share of the primary (agricultural) industry in the GDP, MP is the total machine power in the
agricultural sector, CA is the number of cars, AR is a dummy variable for the autonomous regions, BR is
a dummy variable for the provinces that border other nations on land, e is the error term, i denotes
regions, t denotes years, and a, b, c, d, g, h, j, and k are the coefficients to be estimated.
      The estimation results of this model will provide information on the significance of each
independent variable as well as its marginal impact on the dependent variable with other variables
controlled. Summary statistics of the dependent and independent variables and the estimation methods
for the regression model will be presented together with the estimation results in the following section.
Some econometric issues associated with panel data, such as fixed-effect model vs. random-effect
model, will also be discussed.

3. Empirical Results
    This section presents the empirical results in three subsections: (1) development and trends of
China’s horse population since 1949, (2) changes in the regional distribution of horse population in
China since 1978, and (3) results of the regression analysis.

3.1. Development and Trends of China’s Horse Population since 1949
     Although horses have been raised in China for thousands of years, annual data on the country’s
horse population are only available since 1949. China’s horse population from 1949 to 2018 and
its percentage share of the global horse population from 1961 to 2017 are presented in Figure 1.
For comparison purposes, the horse population of the United States and its percentage share of the
global horse population from 1961 to 2017 are also presented in Figure 1. The United States had only
about 2.0 million horses in the early 1960s but has experienced a significant and steady increase in
its horse population since the mid-1960s, from 2.8 million in 1965 to 11.2 million in 2017. The United
States surpassed China in 2004 and has been the largest horse nation in the world ever since [5].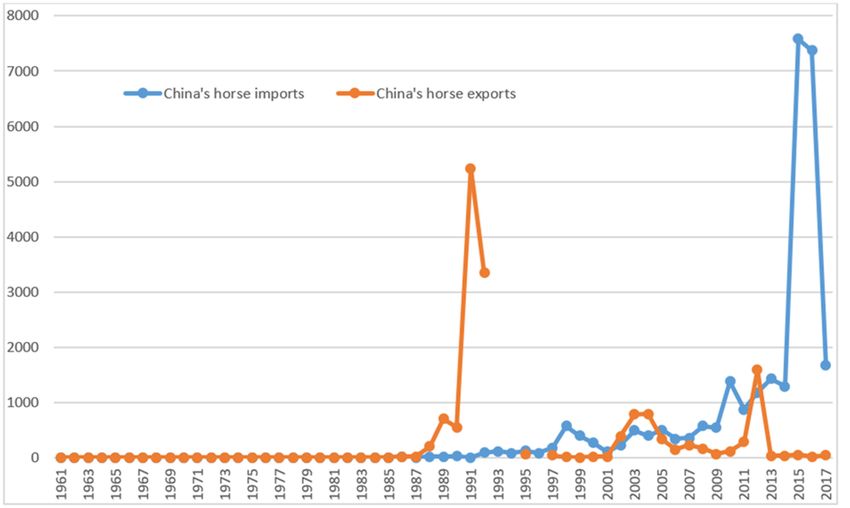
years in China was completely destroyed and the landlord class was eliminated [13–15]. China’s land
  reform significantly liberated productive forces and increased the productivity of agriculture. While
  some peasants received horses and other livestock from the landlords for free, others also made
  efforts to purchase horses for transportation and farming purposes. As a result, China’s horse
  population increased from 4.88 million in 1949 to 7.37 million in 1956. The increase in the horse
Sustainability
  population   2020, 12, 5135this period contributed significantly to the rapid increase in agricultural
                  during                                                                              4 of 14
  production.

       Figure1.1. Horse
      Figure      Horse population
                        population inin China
                                        Chinaand andthe
                                                     theUnited
                                                         UnitedStates
                                                                 States and
                                                                      and   their
                                                                          their   shares
                                                                                shares of of
                                                                                          thethe global
                                                                                              global    horse
                                                                                                     horse
      population,  1949–2018 (data
       population, 1949–2018 (data from  [5,6]).
                                         [5,6]).

      ASecond,
         review the
                  of the  changes
                       central         in China’s
                                government          horse
                                                started  thepopulation    and its
                                                              collectivization     agricultural
                                                                                movement            development
                                                                                              in rural China in the since
                                                                                                                       mid-1949
suggests
  1950s inthat
            orderthetochanges
                        overcome  in China’s   horse population
                                      the limitations                 were
                                                         of small-scale     closely related
                                                                          household            to its agricultural
                                                                                        production    and to achieve andthe
                                                                                                                          rural
  economies ofand
development        scalecaninbeagricultural
                                 divided into  investment
                                                  four periods.and First,
                                                                    production,
                                                                          followingespecially    in irrigation
                                                                                        the establishment     of and   land
                                                                                                                 the People’s
  improvement
Republic           projects
            of China          [16]. Peasants
                         in 1949,    the centralwere   first organized
                                                    government           into collaborative
                                                                     published    the Land groups
                                                                                               ReforminLaw the mid-1950s
                                                                                                                in June 1950,
  and  then  into  large   people’s    communes      in  1958.  The  private  land   ownership     from
abrogating ownership of land by landlords [13–15]. As a result of the land reform, land was confiscated  the land   reform
  around
from       1950 landlords
       former     was replaced  andwith   collective land
                                      redistributed     amongownership,
                                                                  landlessunder   whichand
                                                                             peasants      production   and distribution
                                                                                                the landlords     themselves,
  were  organized    collectively    by  villages. In the  late 1950s, China   also started  the
who now had to till the land to earn a living. Around 300 million peasants who had little or no   “Great  Leap  Forward”
  to increase
land           its production
      for generations              of steel and
                          were assigned       someother
                                                      47industrial   products.
                                                          million hectares    of A  large
                                                                                 land      percentage
                                                                                         plus           of rural laborers
                                                                                              farm implements,       livestock,
and buildings. The peasants were also relieved of rent payments equivalent to 35 and
  were  politically   forced   to  participate  in  such  production,    with  very   low  productivity        efficiency.
                                                                                                          billion  kilograms
  Together with some major natural disasters, the Great Leap Forward movement caused significant
of grain per year. The feudal system of land ownership that had existed for more than 2000 years in
  food shortage and famine from 1958 to 1961. As the small-scale farm production by individual
China was completely destroyed and the landlord class was eliminated [13–15]. China’s land reform
  households was replaced by larger-scale production by villages, the demand for horses was reduced
significantly liberated productive forces and increased the productivity of agriculture. While some
  significantly and, as a result, China’s horse population dropped from 7.31 million in 1956 to 6.21
peasants received horses and other livestock from the landlords for free, others also made efforts
  million in 1961.
to purchase horses for transportation and farming purposes. As a result, China’s horse population
increased from 4.88 million in 1949 to 7.37 million in 1956. The increase in the horse population during
this period contributed significantly to the rapid increase in agricultural production.
      Second, the central government started the collectivization movement in rural China in the
mid-1950s in order to overcome the limitations of small-scale household production and to achieve
the economies of scale in agricultural investment and production, especially in irrigation and land
improvement projects [16]. Peasants were first organized into collaborative groups in the mid-1950s
and then into large people’s communes in 1958. The private land ownership from the land reform
around 1950 was replaced with collective land ownership, under which production and distribution
were organized collectively by villages. In the late 1950s, China also started the “Great Leap Forward”
to increase its production of steel and other industrial products. A large percentage of rural laborers
were politically forced to participate in such production, with very low productivity and efficiency.
Together with some major natural disasters, the Great Leap Forward movement caused significant food
shortage and famine from 1958 to 1961. As the small-scale farm production by individual households
was replaced by larger-scale production by villages, the demand for horses was reduced significantly
and, as a result, China’s horse population dropped from 7.37 million in 1956 to 6.21 million in 1961.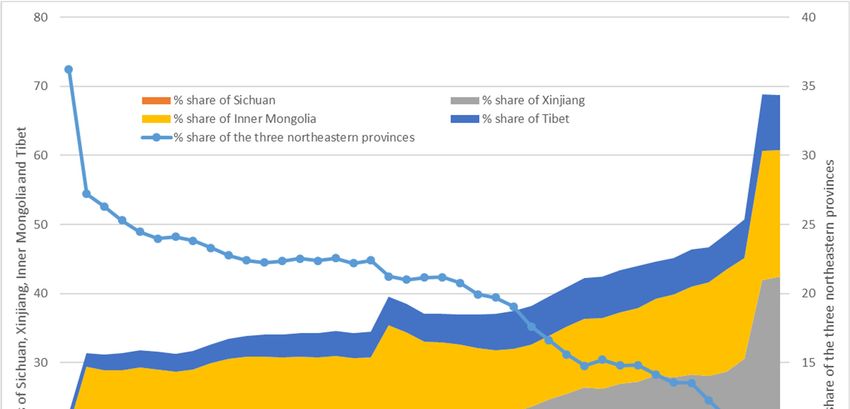
Sustainability 2020, 12, 5135 5 of 14
Third, recognizing the Great Leap Forward’s damages to the national economy, the Chinese
government implemented a set of policies to increase agricultural production in the early 1960s,
but many such policies were interrupted by the Cultural Revolution, from 1966 to 1976. The data from
FAO and NBSC show that China’s horse population increased significantly and steadily from 1961
to 1977 and reached the record high of 11.44 million in 1977. Although the accuracy of data for the
Cultural Revolution period has been questioned by some researchers, there are no other data available
to assess the data problems for the period. One major reason for the steady increase in horse population
over this period was the slow progress in both agricultural mechanization and the improvement in
rural transportation and, as a result, horses were raised to power many farming and transportation
activities in rural China, especially in the areas with no roads for automobiles and tractors.
Fourth, China’s market-oriented economic reform and transition started in rural areas in 1978.
The communes were gradually replaced by the household production responsibility system from
1978 to 1985 [17]. Under the new system, the collectively-owned land was contracted to individual
households, and such simple institutional change greatly improved the incentives of peasants and
resulted in dramatic increases in farm outputs and income. The decollectivization was found to
improve the total productivity and to account for about 50% of the output growth in Chinese agriculture
during 1978–1984 [17].
Different from the previous periods, the increase in farm production and rural income did not
result in an increase in the demand for horses because of the increased availability of farm machine like
tractors as well as the improvements in roads and transportation in rural areas. As shown in Figure 1,
China’s horse population has declined significantly and steadily since 1978, from 11.50 million in 1978
to only 3.47 million in 2018. The factors contributing to the steady decline in China’s horse population
since 1978 and their specific impacts will be analyzed through regression analysis in a later subsection.
3.2. Changes in the Regional Distribution of Horse Population in China since 1978
While China’s total horse population has declined significantly and steadily since 1978, it is
interesting to examine the changes in regional distributions, as China is a vast nation and there are
significant differences across regions. This paper examines the changes in horse distribution across
provinces in China since 1978 through GIS and graphical analyses. The data presented in Figures 2–4
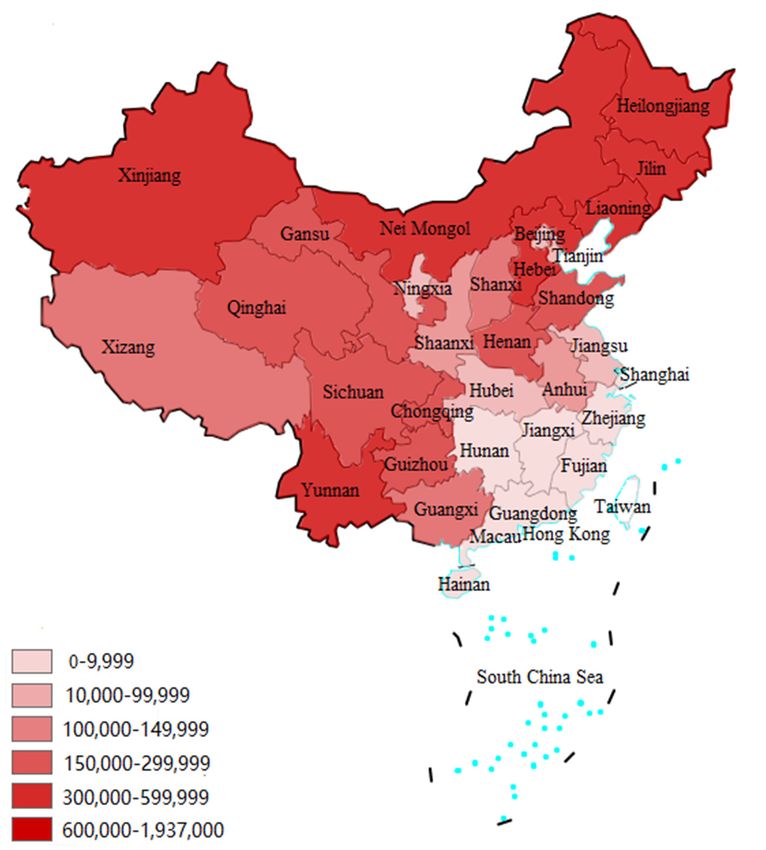
suggest three major findings: First, as shown in Figures 2 and 3, seven provinces had 600,000 or more
horses each in 1978, and they were concentrated in northeast China (Heilongjiang, Jilin, and Liaoning)
and north China (Xinjiang and Inner Mongolia or Nei Mongol) plus Hebei and Yunnan, but only
three provinces had 600,000 or more horses in 2018 (Sichuan, Xinjiang, and Inner Mongolia). For the
provinces with 300,000 to 599,999 horses, the number dropped from six (Shandong, Henan, Qinghai,
Sichuan, Guizhou, and Tibet or Xizang) in 1978 to zero in 2018. A comparison of Figures 2 and 3 also
suggests that the three northeastern provinces (Heilongjiang, Jilin, and Liaoning) experienced the
greatest decrease in the horse population. For example, the horse population in Heilongjiang, a large
agricultural province, dropped from 1.94 million in 1978 to 0.13 million in 2018.
Second, Sichuan is the only province that experienced a significant increase in the horse population,
from 0.31 million in 1978 to 0.74 million in 2018. An examination of the horse distribution among the 21
prefectural level cities and prefectures in Sichuan, available in Sichuan Statistical Yearbooks, indicates
that the horse population inside the province is largely concentrated in the three ethnic autonomous
prefectures (Ganzi Tibetan nationality, Aba Qiang nationality, and Liangshan Yi nationality autonomous
prefectures) in the western Sichuan province that have a very high percentage of ethnic population and
low population density. For example, in 2017, the three autonomous prefectures accounted for 94.10%
of the province’s horse population of 0.72 million but only 8.49% of the province’s total population of
83.02 million [18].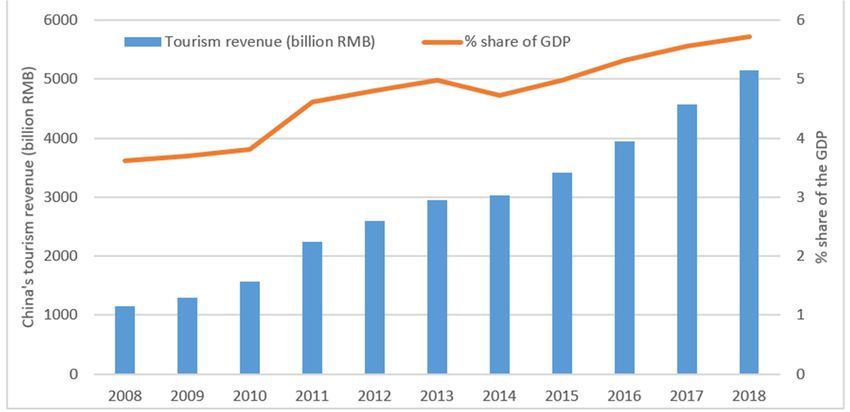
Sustainability 2020, 12, 5135                                                                           6 of 14

     Third, China’s horse population has increasingly concentrated in Sichuan, Xinjiang, Inner Mongolia,
and Tibet. Although Tibet’s total horse population ranked number 13 in 1978 and number 5 in 2018,
there are two unique characteristics. First, its horse population has been relatively stable as compared
to that of other provinces in China, increasing from 0.22 million in 1978 to 0.43 million in 2003 and then
dropping back to 0.28 million in 2018. Second, due to its sparse human population, Tibet is among the
top provinces in terms of number of horses per million people.
     As shown in Figure 4, the above four provinces’ percentage shares of China’s total horse population
increased steadily and significantly from 1978 to 2018, reaching a total of 68.0% in 2018. On the other
hand, the overall percentage share of the three provinces in the northeast (Heilongjiang, Liaoning,
and Jilin) dropped steadily from 36.5% to 6.5% over the same period. Considering that China’s horse
population is highly concentrated in the three ethnic autonomous prefectures in the western section
of the Sichuan province and the three autonomous regions (Xinjiang, Inner Mongolia, and Tibet), it
seems clear that China’s horse population has been increasingly concentrated in the above autonomous
regions of ethnic nationalities that have the tradition of having horses in their cultural, religious, sport,
 Sustainability
and  economic   2020, 12, x FOR PEER REVIEW
                   activities.                                                                          6 of 15

                         Figure2.2.China’s
                        Figure      China’shorse
                                            horsepopulation
                                                  populationby
                                                             byprovince
                                                                provinceinin1978
                                                                             1978(data
                                                                                  (datafrom
                                                                                         from[6]).
                                                                                               [6]).

      Second, Sichuan is the only province that experienced a significant increase in the horse
 population, from 0.31 million in 1978 to 0.74 million in 2018. An examination of the horse distribution
 among the 21 prefectural level cities and prefectures in Sichuan, available in Sichuan Statistical
 Yearbooks, indicates that the horse population inside the province is largely concentrated in the three
 ethnic autonomous prefectures (Ganzi Tibetan, Aba Qiang nationality, and Liangshan Yi nationality
 autonomous prefectures) in the western Sichuan province that have a very high percentage of ethnic
 population and low population density. For example, in 2017, the three autonomous prefectures
 accounted for 94.10% of the province’s horse population of 0.74 million but only 8.49% of the
 province’s total population of 83.02 million [18].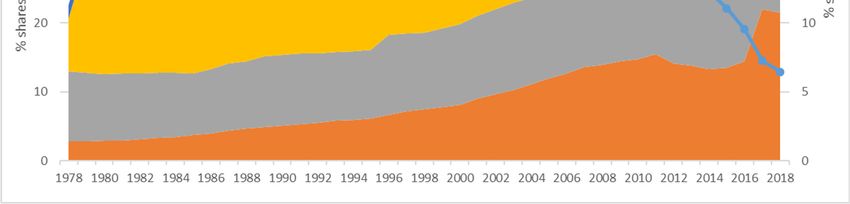
Sustainability 2020, 12, 5135                                                                               7 of 14
  Sustainability 2020, 12, x FOR PEER REVIEW                                                                 7 of 15

  Sustainability 2020, 12, x FOR PEER REVIEW                                                             8 of 15

  variables are reported in Table 1. Similar panel datasets from China have been used in many previous
  studies [17,19,20].

                      Table 1. Summary statistics of the dependent and independent variables

                                                                    Standard
        Variable                   Definition               Mean                Minimum Maximum
                                                                   Deviation
            Y            Year-end horse population         30.79      30.56         0.04       151.10
           PD       Population density (persons per km2) 433.84      994.79         2.07      9410.09
           UP              % of urban population           40.81      16.94        12.37       86.52
           SP        % of the primary industry in GDP      15.13       7.81         0.39       48.90
           MP        Agri. machinery power (10,000 kw)    2680.63    2664.48       57.20     13,353.00
           CA              Number of cars (10,000)         196.74    298.92         0.82      2026.22
           BR        Provinces that border other nations    0.38       0.48          0
                     Figure 3. China’s horse population by province in 2018 (data from [6]).    1.00
           AR          Figure 3. China’s horse
                            Autonomous         population by0.25
                                         regions             province in 2018 (data from
                                                                       0.43           0 [6]). 1.00

        Third, China’s horse population has increasingly concentrated in Sichuan, Xinjiang, Inner
  Mongolia, and Tibet. Although Tibet’s total horse population ranked number 13 in 1978 and number
  5 in 2018, there are two unique characteristics. First, its horse population has been relatively stable as
  compared to that of other provinces in China, increasing from 0.22 million in 1978 to 0.43 million in
  2003 and then dropping back to 0.28 million in 2018. Second, due to its sparse human population,
  Tibet is among the top provinces in terms of number of horses per million people.
        As shown in Figure 4, the above four provinces’ percentage shares of China’s total horse
  population increased steadily and significantly from 1978 to 2018, reaching a total of 68.0% in 2018.
  On the other hand, the overall percentage share of the three provinces in the northeast (Heilongjiang,
  Liaoning, and Jilin) dropped steadily from 36.5% to 6.5% over the same period. Considering that
  China’s horse population is highly concentrated in the three ethnic autonomous prefectures in the
  western section of the Sichuan province and the three autonomous regions (Xinjiang, Inner Mongolia,
  and Tibet), it seems clear that China’s horse population has been increasingly concentrated in the
  above autonomous regions of ethnic nationalities that have the tradition of having horses in their
  cultural, religious, sport, and economic activities.

  3.3. Results of a Regression Analysis
       Although our panel dataset includes 31 provinces over 26 years (1993–2018), data from only 24
  of the provinces are used to estimate the regression model introduced in a previous section for two
  reasons: First, five provinces (Jiangxi, Zhejiang, Shanghai, Guangdong, and Hainan) were dropped
  from the dataset because their horse population was zero or very close to zero over the study period.
  Second, Chongqing, which separated from the Sichuan province and became a municipality in 1995,
  was combined with Sichuan in this analysis. The panel data on horse population, together with the
           Figure
  explanatory
         Figure 4.4.Shares
                     SharesofofChina’s
                (independent)   China’s horse population
                                   variables
                                       horse  population
                                               specified by
                                                         in selected
                                                            the      provinces,
                                                                 regression
                                                            selected            1978–2018
                                                                             model
                                                                     provinces,           (data
                                                                                           (datafrom
                                                                                     presented
                                                                                 1978–2018           [6]).
                                                                                                  in Section
                                                                                                  from [6]). 2, were
  used to estimate the regression model. Summary statistics of the dependent and independent
       For the panel data with both cross-province and over-time variations, alternative statistical tests
  were conducted to compare alternative models for the dataset. First, F tests were performed to assess
  whether there were significant fixed effects across provinces and/or over time. The test results suggest
  that there was no significant fixed effect over the study period of 25 years, but there were significant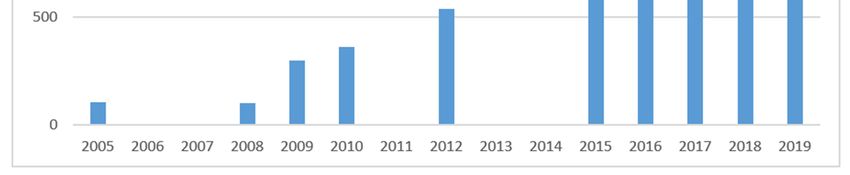
Sustainability 2020, 12, 5135                                                                         8 of 14

3.3. Results of a Regression Analysis
     Although our panel dataset includes 31 provinces over 26 years (1993–2018), data from only 24
of the provinces are used to estimate the regression model introduced in a previous section for two
reasons: First, five provinces (Jiangxi, Zhejiang, Shanghai, Guangdong, and Hainan) were dropped
from the dataset because their horse population was zero or very close to zero over the study period.
Second, Chongqing, which separated from the Sichuan province and became a municipality in 1995,
was combined with Sichuan in this analysis. The panel data on horse population, together with
the explanatory (independent) variables specified in the regression model presented in Section 2,
were used to estimate the regression model. Summary statistics of the dependent and independent
variables are reported in Table 1. Similar panel datasets from China have been used in many previous
studies [17,19,20].

                       Table 1. Summary statistics of the dependent and independent variables

                                                                       Standard
    Variable                     Definition                 Mean                     Minimum    Maximum
                                                                       Deviation
        Y            Year end horse population (10,000)       30.79        30.56       0.04       151.10
       PD           Population density (persons per km2 )    433.84       994.79       2.07      9410.09
       UP                  % of urban population             40.81        16.94        12.37      86.52
       SP            % of the primary industry in GDP         15.13         7.81       0.39        48.90
       MP            Agri. machinery power (10,000 kw)      2680.63      2664.48       57.20    13,353.00
       CA                  Number of cars (10,000)           196.74       298.92       0.82      2026.22
       BR            Provinces that border other nations      0.38         0.48          0         1.00
       AR                   Autonomous regions                0.25         0.43          0         1.00

     For the panel data with both cross-province and over-time variations, different statistical tests
were conducted to compare alternative models for the dataset. First, F tests were performed to assess
whether there were significant fixed effects across provinces and/or over time. The test results suggest
that there was no significant fixed effect over the study period of 25 years, but there were significant
fixed effects across some provinces. According to the test results, a model with fixed provincial
effects was estimated and is reported in the second column of Table 2. As fixed-effect models and
random-effect models are often applied to panel datasets [19,20], a random-effect model with seven
explanatory variables was estimated and is reported in the third column in Table 2.
     Second, a Hausman test was conducted, and the test result suggests that the model with random
effects performs better than the fixed-effect model for the dataset. The following discussion of the
estimation results focuses on the random-effect model, although the estimation results from the two
models are pretty consistent.
     The estimated random-effect model suggests three major conclusions: First, the R2 and
Wald-statistic suggest that the estimated random-effect model fits the data reasonably well, explaining
35.16% of the variation in the horse population, and the estimated model is significant at the 0.01
significance level. Second, the percentage of the urban population, the total agricultural machinery
power, and the number of cars had negative and highly significant impacts on the horse population
when other independent variables included in the model were controlled. Such impacts are very
consistent with the discussion about the national trends and regional distribution of China’s horse
population reported in the previous subsection. Third, the agricultural sector’s percentage share of
GDP and the two dummy variables for autonomous regions and provinces that border other nations
on land showed positive and significant impacts on the horse population when other explanatory
variables were controlled, suggesting that agricultural regions, the provinces that border other nations
on land, and the autonomous regions tend to have more horses when other variables are controlled.
The significantly higher value of R2 for the random-effect model than the fixed-effect model also
confirms the result of the Hausman test, indicating that the random-effect model fits the dataset better
than the fixed-effect model.
Sustainability 2020, 12, 5135 9 of 14
Although our regression analysis is limited by the data availability, this paper presents the first or
one of the first econometric studies on the changes in China’s horse population, and quantitatively
confirms some conclusions derived from the graphical analysis reported in the previous subsections.
Table 2. Estimated regression models of China’s horse population by province, 1993–2018.
Variable Definition Fixed-Effect Model Random-Effect Model
Population density (persons per −0.0006 −0.0007
PD
square km) (0.0007) (0.0007)
−0.1118 *** −0.11021 ***
UP % of urban population
(0.0354) (0.0354)
0.2361 ** 0.2754 ***
SP % of the primary industry in GDP
(0.1051) (0.1039)
Total agricultural machinery −0.0032 *** −0.0030 ***
MP
power (10,000 kw) (0.0006) (0.0005)
−0.0058 ** −0.0062 **
CA Number of cars (10,000)
(0.0028) (0.0028)
Provinces that border 23.0733 **
BR
other nations (11.2504)
20.8939 *
AR Autonomous regions
(12.5749)
41.0250 *** 25.9304 ***
Constant
(3.1854) (7.367)
R2 0.2587 0.3516
F-value 40.49 ***
Wald-statistic 213.61 ***
Hausman test 4.22
Number of observations 600 600
The numbers in parentheses are the standard errors of the estimated coefficients. * Significant at the 10% level;
** Significant at the 5% level; *** Significant at the 1% level.
4. Challenges and Opportunities for China’s Equine Industries
This section discusses the challenges and opportunities for China’s equine industries. As analyzed
in the previous sections, China’s agricultural mechanization, steady decrease in the agricultural
sector’s share in China’s GDP, improvement in rural transportation with more tractors, trucks, cars and
motorcycles, urbanization, and the decreased land availability for and the lack of economic returns
from horses are the major factors contributing to the steady decline in China’s horse population since
1978. All of the above factors will likely continue to reduce China’s horse population in the coming
years, especially in the provinces in the central, southeast, and east regions with significantly higher
population density and land increasingly being used for housing and industrial development. China’s
horse population is likely to be more concentrated in Inner Mongolia, Xinjiang, Tibet, and the western
Sichuan province, which have relatively low population density and high proportion of minority
ethnic population with the tradition of horses in their cultural, religious, sport, and economic activities.
Based on the changes in horse population in the United States and its potential correlation with
economic development cycles, Linklater [21] predicted that “China’s horses will cease their decline
and eventually grow in number again as its more affluent communities rediscover their equestrian
traditions and culture.” The findings from our analysis, presented above, suggest that Linklater’s
prediction may happen in some communities in Inner Mongolia, Xinjiang, Tibet, and the western
Sichuan province, but the horse industries are unlikely to resurge in other regions in China for at least
two reasons. First, the growth in the horse population in the United States since the mid-1960s has
mainly been due to the increase in horse ownership of individual households with available land. In
contrast, land for horses is not available for most households in China. Also, the land scarcity in China
will likely continue to increase, making it impossible for individual households to have horses, except
for some regions in Inner Mongolia, Xinjiang, Tibet, and the western Sichuan province.
Second, the increasing horse ownership in the United States is mainly for leisure and recreation
purposes, not for the purpose of income. China’s situation is very different from that of the UnitedSustainability 2020, 12, 5135 10 of 14
States. People who live in rural areas, especially in rural areas with potential land available for horses,
generally have significantly lower income and cannot afford to support horses with limited economic
revenue. On the other hand, people with high income and desire to own horses generally live in cities,
where it is simply not feasible for them to own horses either. It is the prediction of this study that
all the factors that have contributed to the decline in China’s horse population since 1978 will likely
continue to reduce China’s total horse population in the coming decade. The experience of the United
States and China suggests that economic and income growth may contribute to the growth in equine
industries in some nations or regions, but that may not be the case in many other nations or regions.
There are at least four unique opportunities for the development of China’s equine industries
in certain regions. First, although equestrian sports and recreation in China were minimal until the
early 2000s, they have developed rapidly in the past decade. Since China participated in the equestrian
events for the first time in the 2008 Olympic Games, equestrian sports and shows have become more
popular in China, where horses play an important part in history and culture. For example, as shown
in Figure 5, the number of equestrian clubs in China has increased steadily and significantly since the
mid-2000s, from 107 in 2005 to 2000 in 2019 [22]. These clubs have offered membership and organized
many events, especially in large cities like Beijing and Shanghai. For example, the equestrian clubs
generated an estimated total revenue of 9.24 billion RMB in 2017 and likely around 12 billion RMB
in 2018 [22]. A study in the United States found that almost 42% of the economic activity generated
per horse at equestrian events in the area remained within the community [8]. While it is infeasible
for most individual Chinese households to own horses, especially in cities and relatively developed
regions with extremely limited land, equestrian clubs are a way for many urban households to enjoy
equestrian events
Sustainability 2020, 12,and activities,
x FOR while contributing to the area’s economic development.
PEER REVIEW 11 of 15
Figure 5. Number of horse clubs in China, 2005–2019 (data from [22]).
Figure 5. Number of horse clubs in China, 2005–2019 (data from [22]).
In addition to the equestrian clubs, many companies and organizations have also made
In addition to the equestrian clubs, many companies and organizations have also made investments
investments in efforts to enhance the development of equestrian activities and marketable products.
in efforts to enhance the development of equestrian activities and marketable products. For example,
For example, China hosted more than 80 international and national equestrian shows and events in
China
2018 hosted more than
[22]. Moreover, while80equestrian
international
clubs, and national
sports, and showsequestrian
in Hong shows
Kong and and events
Macao are in
more2018 [22].
Moreover,
developed while
than equestrian
those in most clubs,
of thesports, and
areas in shows China,
mainland in HongtheKong and Macao
increasing are more
collaboration developed
between
than those inChina
mainland most and
of the areas
Hong in mainland
Kong and Macao China, thespecial
as two increasing collaboration
administrative areasbetween mainland
will be helpful for China
the development of equine activities and events in mainland China [23].
Second, China’s rapidly developing tourism industry will continue to provide opportunities for
its equine industries. As shown in Figure 6, China’s revenue from tourism increased from 1155 billion
RMB in 2008 to 5150 billion RMB in 2018, and its share in the GDP increased from 3.63% to 5.73%
over the same period, suggesting that the revenue from tourism grew at a significantly higher rate
than the GDP [6]. The equine industries have benefited from, and contributed to, the development of
the tourism sector. Previous studies have suggested that the introduction of equine tourism canSustainability 2020, 12, 5135 11 of 14
and Hong Kong and Macao as two special administrative areas will be helpful for the development of
equine activities and events in mainland China [23].
Second, China’s rapidly developing tourism industry will continue to provide opportunities for
its equine industries. As shown in Figure 6, China’s revenue from tourism increased from 1155 billion
RMB in 2008 to 5150 billion RMB in 2018, and its share in the GDP increased from 3.63% to 5.73% over
the same period, suggesting that the revenue from tourism grew at a significantly higher rate than the
GDP [6]. The equine industries have benefited from, and contributed to, the development of the tourism
sector. Previous studies have suggested that the introduction of equine tourism can provide economic
opportunities for small farms, contribute to sustainable development in rural areas, and protect cultural
heritage [8,9,11,23–29]. In China, an increasing number of people have traveled to Inner Mongolia,
Xinjiang, Tibet, and the western Sichuan province to experience and enjoy horse-related activities in
recent years, and such activities will continue to provide revenue for the equine industries in such
regions. China’s entertainment industry has also developed rapidly in the past two decades and
constructed many TV and movie studios or parks (such as the Hengdian World Studio in the Zhejiang
province and Shanghai Movie Park in Shanghai), and horses are generally a major part of such projects.
Many of the studios and parks have become famous tourist sites for visitors to watch battlefields
with soldiers on horseback. Furthermore, many areas and communities in the major horse provinces,
like Inner Mongolia and Xinjiang, have invested in horse-related tourist projects, and such investment
will continue to provide opportunities for the equine industries [30,31].
Sustainability 2020, 12, x FOR PEER REVIEW 12 of 15
Figure 6. China’s tourism revenue and percentage share of the GDP, 2008–2019 (data from [6]).
Figure 6. China’s tourism revenue and percentage share of the GDP, 2008–2019 (data from [6]).
Third, the market
Third, the marketfor horse-related food,food,
for horse-related sport, and other
sport, products,
and other like horse
products, milk,milk,
like horse has expanded
has
quickly
expanded quickly in recent years, and the expansion of such markets will continue to provide for
in recent years, and the expansion of such markets will continue to provide opportunities
the equine industries.
opportunities For
for the example,
equine horseFor
industry. milk is considered
example, horse milkto have many health
is considered to have benefits and is sold
many health
at 40benefits
RMB orand about $6 per
is sold kilogram
at 40 RMB orin Inner
about $6Mongolia
per kilogram[30].inThere
Inner are also significant
Mongolia [30]. Thereniche markets
are also
significant
for other horse niche markets
products, for other
including horse
glue madeproducts, including
from horse hooves,glue and
made frombows
violin horseand
hooves, and
paintbrushes
madeviolin
frombows and paintbrushes
horsehair in China and made from horsehair
around the world. in China and around the world.
Fourth, the international market may also provide opportunities for China’s equine industries.
Fourth, the international market may also provide opportunities for China’s equine industries.
FAO data on China’s horse exports and imports from 1961 to 2017, presented in Figure 7, suggest
FAO data on China’s horse exports and imports from 1961 to 2017, presented in Figure 7, suggest
that China’s annual horse exports have been under 1000 since 1961 (except for 1991, 1992, and 2012).
that China’s annual horse exports have been under 1000 since 1961 (except for 1991, 1992, and 2012).
In contrast, horse imports have increased significantly since the early 2000s. The increase in China’s
In contrast,
horse imports in horse
China’s recent imports
years washave increased
mainly to meet significantly
the demand ofsince the early
the growing 2000s. The
equestrian increase
clubs and in
China’s horse
sport teams.imports in recent
For example, years
China was mainly
imported aboutto meet
2000 the demand
horses from the of the growing
Netherlands, equestrian
New Zealand, clubs
and sport teams.
Mongolia, andFor example,
others in 2018,China imported
and the imported about 2000
horses werehorses
mainly from the Netherlands,
for equestrian New Zealand,
clubs [22].
Mongolia, Asand the others
economic and cultural
in 2018, and theexchange
importedand collaboration
horses were mainly between China and clubs
for equestrian other nations
[22].
continues to increase, many horse-related activities such as horse-assisted therapy and pregnant mare
urine (PMU) for pharmaceutical products and medical treatments will likely be introduced to China
and provide additional opportunities for China’s equine industries [4,32–35].Sustainability 2020, 12, 5135 12 of 14
Figure 7. China’s horse imports and exports, 1961–2017 (data from [5]).
As the economic and cultural exchange and collaboration between China and other nations
continue to increase, many horse-related activities such as horse-assisted therapy and pregnant mare
urine (PMU) for pharmaceutical products and medical treatments will likely be introduced to China
and provide additional opportunities for China’s equine industries [4,32–35].
5. Concluding Remarks
This paper has reviewed the development of China’s equine industries since 1949, identified
major factors contributing to the steady decline in its horse population since 1978, and discussed the
challenges and opportunities for the equine industries’ development. Empirical results suggest that
the changes in China’s horse population since 1949 have been closely associated with its agricultural
and rural development and policies, and key factors for the steady decline in its horse population since
1978 include agricultural mechanization, decrease in the agricultural sector’s share in China’s GDP,
improvement in rural transportation (with more tractors, trucks, cars, and motorcycles), urbanization,
and decreased land availability for and the lack of economic returns from horses. Such factors may
continue to reduce China’s horse population in the coming decade.
A comparative analysis of the development of the equine industries in the United States and China
suggests that the economic growth and increase in income in the United States contributed to the rapid
growth of the country’s equine sectors since the mid-1960s, but China’s steady economic growth since
the late 1970s has contributed to a significant and steady decline in its horse population. However, the
rapid development in the tourism, recreation, and sport sectors may provide opportunities for China’s
equine industries. As China increases its exchanges with the rest of the world through economic,
cultural, and sports activities, many equestrian activities developed in North America and Europe,
such as horse-assisted therapy in education and health care, will very likely be introduced in China,
with rapidly increasing income and living standards. The growth of China’s equine industries is likely
to be more concentrated in Inner Mongolia, Xinjiang, Tibet, and the western Sichuan province, all
of which have relatively low population density and high proportion of minority ethnic population
with the tradition of horses in their cultural, religious, and economic activities. At the same time,
equine events and activities are expected to continue to grow at significant rates in and around large
Chinese cities.Sustainability 2020, 12, 5135 13 of 14
Author Contributions: Conceptualization, Q.W. and Y.Z.; data curation, Q.W. and Y.Z.; formal analysis, Y.Z.;
methodology, Q.W. and Y.Z.; software, Y.Z.; validation, Y.Z.; visualization, Y.Z.; writing—original draft, Q.W.;
writing—review & editing, Q.W. and Y.Z. All authors have read and agreed to the published version of
the manuscript.
Funding: This work is partially supported by the National Social Science Fund of China (project 17ZDA067) and
by the Vermont Agricultural Experiment Station at the University of Vermont, USA.
Acknowledgments: The authors would like to thank the editor and two reviewers for their constructive comments
and suggestions, and Angela Tweedy and Naomi Cunningham for their assistance in the literature review
and editing.
Conflicts of Interest: The authors declare no conflict of interest.
References
1. Creel, H.G. The role of the horse in Chinese history. Am. Hist. Rev. 1965, 70, 647–672. [CrossRef]
2. Kelekna, P. The Horse in Human History; Cambridge University Press: New York, NY, USA, 2009.
3. Olsen, S.J. The horse in ancient China and its cultural influence in some other areas. Proc. Acad. Nat. Sci. Phila.
1988, 140, 151–189.
4. Coulter, K. Work in Ontario Horse Stables; Brock University: St. Catharines, ON, Canada, 2018; Available
online: https://thehorseportal.ca/wp-content/uploads/2018/04/Work-in-Ontario-Horse-Stables.pdf (accessed
on 8 May 2020).
5. Food and Agriculture Organization of the United Nations. FAOSTAT Database. 2020. Available online:
http://www.fao.org/faostat/en/#home (accessed on 10 January 2020).
6. State Bureau of Statistics of China. China Statistical Yearbook, 1978–2018; China Statistical Press: Beijing,
China, 1979–2019.
7. Vial, C.; Evans, R. The New Equine Economy in the 21st Century; Wageningen Academic Publishers: Wageningen,
The Netherland, 2015. [CrossRef]
8. Armstrong, A.A.; Kayser, J.P.; Gardner, J.G. The beneficial effects of equine events on the local economy.
J. Equine Vet. Sci. 2011, 31, 288–289. [CrossRef]
9. Evans, R.; Pickel-Chevalier, S.; Dashper, K. Riding to sustainable rural development? Promising elements
of sustainable practices in equine tourism in rural areas. In Rural Tourism: An International Perspective;
Dashper, K., Ed.; Cambridge Scholars Publishing: Newcastle upon Tyne, UK, 2014; pp. 375–389.
10. Splan, R.; Spindler, M.; Anderson, K.; Skelly, C.; Westendorf, M. Opportunities to address the transdisciplinary
and global challenges of climate change in an equine science context. NACTA J. 2018, 62, 28–34.
11. Elgåker, H.E. The new equine sector and its influence on multifunctional land use in peri-urban areas.
GeoJournal 2012, 77, 591–613. [CrossRef]
12. Gottlieb, P.D.; Weinert, J.R.; Dobis, E.; Malinowski, K. The evolution of racehorse clusters in the United States:
Geographic analysis and implications for sustainable agricultural development. Sustainability 2020, 12, 494.
[CrossRef]
13. Javed, J.A. Land and Retribution: Morality, Mobilization, and Violence in China’s Land Reform Campaign
(1950–1952). Ph.D. Thesis, Harvard University, Cambridge, MA, USA, 2017.
14. Bramall, C. Inequality, land reform and agricultural growth in China, 1952–1955: A preliminary treatment.
J. Peasant Stud. 2000, 27, 30–54. [CrossRef]
15. Ash, R. Economic aspects of land reform in Kiangsu, 1949–1952. China Q. 1976, 66, 261–292. [CrossRef]
16. Lin, J.Y. Collectivization and China’s agricultural crisis in 1959–1961. J. Political Econ. 1990, 98, 1228–1252.
[CrossRef]
17. Lin, J.Y. Rural reforms and agricultural growth in China. Am. Econ. Rev. 1992, 82, 35–51.
18. Sichuan Statistic Bureau. Sichuan Statistical Yearbook, 2010–2017; Sichuan Press: Chengdu, China, 2011–2018.
19. Edlund, L.; Li, H.; Yi, J.; Zhang, J. Sex ratios and crime: Evidence from China. Rev. Econ. Stat. 2013, 95,
1520–1534. [CrossRef]
20. Wang, Q.; Zou, Y.; Fan, D. Gender imbalance in China’s marriage migration: Quantitative evidence and
policy implications. Econ. Modeling 2019, 83, 406–414. [CrossRef]
21. Linklater, W. China and the USA Trade Places. Available online: https://perissodactyla.wordpress.com/2013/
06/18/china-and-the-usa-trade-places/ (accessed on 10 January 2020).Sustainability 2020, 12, 5135 14 of 14
22. Horsemanship. China’s Horsemanship Development Report 2018. Available online: https://sports.sina.cn/
others/mashu/2018-12-18/detail-ihqhqcir7844325.d.html?vt=4&cid=69557&node_id=150786 (accessed on
10 January 2020).
23. Liang, S. Research on guidance of the Hong Kong jockey club and the sustainable development of horse
sports industry in the Guangdong-Hong Kang-Macao greater bay area. J. Sports Sci. 1990, 40, 33–39.
24. Dashper, K. Listening to horses: Developing attentive interspecies relationships through sport and leisure.
Soc. Anim. 2017, 25, 207–224. [CrossRef]
25. Dashper, K. Holidays with my horse: Human-horse relationships and multispecies tourism experiences.
Tour. Manag. Perspect. 2020, 34, 100678. [CrossRef]
26. Dashper, K.; Brymer, E. An ecological-phenomenological perspective on multispecies leisure and the
horse-human relationship in events. Leis. Stud. 2019, 38, 394–407. [CrossRef]
27. Buchmann, A. Insights into domestic horse tourism: The case study of Lake Macquarie, NSW, Australia.
Curr. Issues Tour. 2017, 20, 261–277. [CrossRef]
28. Yilmaz, K.; Goncagul, C. Equine tourism: Nature, sports and travel. In Global Issues
and Trends in Tourism; Avcikurt, C., Dinu, M., Hacioglu, N., EFE, R., Soykan, A.,
Tetik, N., Eds.; St. Kliment Ohridski University Press: Sofia, Bulgaria, 2016. Available
online: https://www.researchgate.net/profile/Recep_Efe/publication/311952159_Global_Issues_and_Trends_
in_Tourism/links/5864ac7b08ae329d6203ac15.pdf#page=544 (accessed on 4 June 2020).
29. Pickel-Chevalier, S. Can equestrian tourism be a solution for sustainable tourism development in France?
Soc. Leis. 2015, 38, 110–134. [CrossRef]
30. Xinhua News. From “Tools” to “Pets”: The Changing Role of Mongolia Horse. Available online: http:
//www.xinhuanet.com/2018-11/13/c_1123707813.htm (accessed on 10 January 2020).
31. Heihe City Government. Heihe Equine Industry Development Plan, 2018–2020. 18 May 2018. Available
online: http://www.xumurc.com/main/ShowNews_59698.html (accessed on 10 January 2020).
32. Wojtkowska, M.; Kaczmarek, M.; Gazdowska, Z.; The influence of horse assisted education on the perception
of self-efficacy in people holding leadership positions. J. Educ. Health Sport 2019, 9. Available online:
http://www.ojs.ukw.edu.pl/index.php/johs/article/view/7063 (accessed on 10 May 2020).
33. Pendry, P.; Smith, A.; Roeter, S. Randomized trial examines effects of equine facilitated learning on adolescents’
basal cortisol levels. Hum. Anim. Interact. Bull. 2014, 2, 80–95.
34. Norwood, M.F.; Lakhani, A.; Kendall, E.; Simone Fullagar, S.; Maujean, A. Engaging disenfranchised
youth through an equine assisted activities program: Understanding psychosocial benefits of horse-human
interactions. Soc. Anim. 2020, 1, 1–21. [CrossRef]
35. Bruccoleri, M.; Mazzola, E.; Sferlazzo, G. Explaining the relationship between socially responsible products
and the operations of the firm: The case of equine assisted therapy. J. Clean. Prod. 2018, 195, 839–850.
[CrossRef]
© 2020 by the authors. Licensee MDPI, Basel, Switzerland. This article is an open access
article distributed under the terms and conditions of the Creative Commons Attribution
(CC BY) license (http://creativecommons.org/licenses/by/4.0/).You can also read