Monitoring the Behavior and Habitat Use of Animals to Enhance Welfare using the ZooMonitor App - Animal Behavior and Cognition
←
→
Page content transcription
If your browser does not render page correctly, please read the page content below
ABC 2019, 6(3):158–167
Animal Behavior and Cognition                                             DOI: https://doi.org/10.26451/abc.06.03.01.2019
©Attribution 3.0 Unported (CC BY 3.0)

     Monitoring the Behavior and Habitat Use of Animals to
         Enhance Welfare using the ZooMonitor App
Jason D. Wark1*, Katherine A. Cronin1, Tony Niemann3, Marisa A. Shender2, Adrienne Horrigan2,
                               Allison Kao2, and Megan R. Ross2
1Animal  Welfare Science Program, Lincoln Park Zoo, Chicago, IL
2Lincoln Park Zoo, Chicago, IL
3Zier Niemann Consulting, Salida, CO

*Corresponding author (Email: jwark@lpzoo.org)

Citation – Wark, J. D., Cronin, K. A., Niemann, T., Shender, M. A., Horrigan, A., Kao, A., & Ross, M. R. (2019).
Monitoring the behavior and habitat use of animals to enhance welfare using the ZooMonitor app. Animal Behavior
and Cognition, 6(3), 158–167. https://doi.org/10.26451/abc.06.03.01.2019

Abstract – Regular monitoring of the behavior, habitat use, and appearance of animals can provide valuable insight
into their welfare. These ongoing data can help identify meaningful trends that can be acted upon to enhance
welfare, and potentially reveal individual preferences and patterns that can facilitate care tailored to the individual.
To provide a low cost, flexible, user-friendly tool for staff to conduct systematic behavioral monitoring, Lincoln
Park Zoo, with development support from Zier Niemann Consulting, created the ZooMonitor app. With
ZooMonitor, users can record the behavior and habitat use of animals using standardized animal behavior recording
methods as well as log individual characteristics such as body condition or coat/feather quality. These data can be
recorded using computers or tablet devices, and data are uploaded to a cloud server where the user can conduct
automated reliability tests to check observer consistency and generate built-in reports such as activity budgets and
heat maps showing how animals use their available space. To demonstrate the use of ZooMonitor in an ongoing
monitoring program, two case studies from Lincoln Park Zoo are presented: 1) promoting increased foraging and
broader habitat use of pygmy hippos (Choeropsis liberiensis); and 2) tracking feather condition changes in a flock of
domestic chickens (Gallus gallus). These examples highlight the importance of standardized monitoring and use of
digital tools like ZooMonitor to enable science-based husbandry practices and promote positive welfare for animals
in human care.

Keywords – Animal welfare, Behavioral monitoring, Behavior analysis, Observational data, Ethology, Zoo

        Monitoring the behavior of animals in zoos and aquariums can provide valuable insight into
welfare and promote a process of science-based decision making in animal management. Engaging in
systematic, long-term behavioral monitoring can be particularly valuable, as it allows an understanding of
baseline behavioral patterns for an individual that can be used to help identify deviations within that
individual’s own norm that may be indicative of a change in welfare (Hill & Broom, 2009; Melfi, 2009).
Systematic behavioral monitoring has been highlighted as a best practice for zoos and aquariums
(Watters, Margulis, & Atsalis, 2009) and can help meet the increasing welfare standards for accreditation
by the Association of Zoos and Aquariums (AZA, 2019).
        Current approaches to systematic welfare assessment in zoos and aquariums have highlighted the
importance of including “animal-based” output measures, in contrast to “resource-based” approaches that
have focused predominately on what the animals are provided (Brando & Buchanan-Smith, 2018;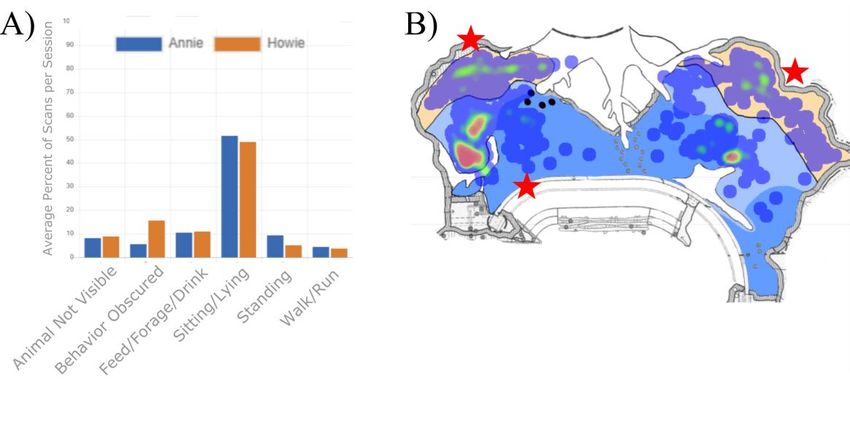
Wark et al. 159

Whitham & Wielebnowski, 2013). Although many institution-wide welfare assessment frameworks rely
on indirect, qualitative assessments by staff, these evaluations may be difficult for documenting complex
or subtle behaviors and should be validated with direct behavioral observations to determine their
reliability (Less, Kuhar, Dennis, & Lukas, 2012; Whitham & Wielebnowski, 2009). Performing direct
behavioral observations is currently one of the best means for documenting “animal-based” measures of
welfare but can be challenging to implement on an institution-wide basis given the limitations of tools
and staff expertise and time for behavioral recording.
          Behavioral monitoring in zoos and aquariums has historically been accomplished using pen and
paper but digital tools that increase efficiency in data collection and visualization are becoming
increasingly available (e.g., BORIS software, Friard & Gamba, 2016; Noldus Observer software, Noldus,
1991; see Whitham & Miller, 2016 for more examples). Digital options save time by eliminating the need
for manually entering data prior to analysis, thus reducing potential errors that might occur during data
collection or entry. Digital tools also have the potential to provide immediate feedback to the user through
reports and charts. For example, digital tools can enable plotting the precise location of individuals on a
map image of their habitat space, a challenging task using pen and paper. These data could then be
quickly visualized through heat map reports to illustrate space use preferences as a continuous distribution
through the habitat. Behavioral data collection can also be combined with video systems to allow rapid
surveying of large areas (Hansen, Fultz, Hopper, & Ross, 2018). Beyond these advantages to data
collection, digital tools could also provide opportunities for multi-institutional collaboration, with
researchers being able to easily share monitoring projects across institutions and potentially identify
trends in behavioral patterns within populations. These features would also strengthen the power of zoo
and aquarium research by addressing the limitations of small sample size common in zoo and aquarium
habitats.
          To address the need for a simple, user-friendly, affordable tool that can support the development
of behavioral monitoring programs, Lincoln Park Zoo, with development support from Zier Niemann
Consulting, created ZooMonitor, a web app for recording the behavior and space use of animals using
tablet devices. When developing ZooMonitor, the goal was to create an easy-to-use tool for building a
data-driven understanding of behavior and tracking behavioral changes over time that was low-cost.
During the development of the app, feedback and testing from 15 zoos, aquariums, and sanctuaries were
integrated to increase the likelihood that the app would meet the needs of the target community. As
described below, the resulting app allows for multiple behavioral recording approaches and generates
reports tailored to the needs of animal managers to quickly generate insights that can be used to make
decisions about care. The app works across platforms, including iOS, Android, and Windows devices
using the Safari or Chrome web browser. ZooMonitor is freely available for accredited zoos, aquariums,
sanctuaries, and museums, and available for a low fee for other organizations. The ZooMonitor app has
been used at Lincoln Park Zoo since 2014, and since the public release of the app in 2016, has been
adopted by over 200 organizations to monitor behavior at their own institutions. Below we provide
information about the app, and two case studies that demonstrate how the ZooMonitor app can be used to
monitor behavior and enhance animal welfare in a zoo setting.

                                    Overview of the ZooMonitor App

         ZooMonitor functionality is organized across two main areas: the administration (“Admin”) and
application (“App”) sections (Figure 1). Different behavioral monitoring configurations (i.e., those
tailored to record behavior of different species, or animals in different habitats) are called “projects.” In
the Admin section, users create, copy, or modify existing projects while connected to the internet. After a
user has created a project, it is available to be downloaded by the local device and viewed in the App
section. From the App section, users can record data without internet access, and the data from each
session are maintained locally on the device until the data is uploaded to secure cloud storage. Each
ZooMonitor account has its own private, partitioned cloud storage space available for data storage. After
the data have been uploaded, they can be visualized through the Admin section in the form of customized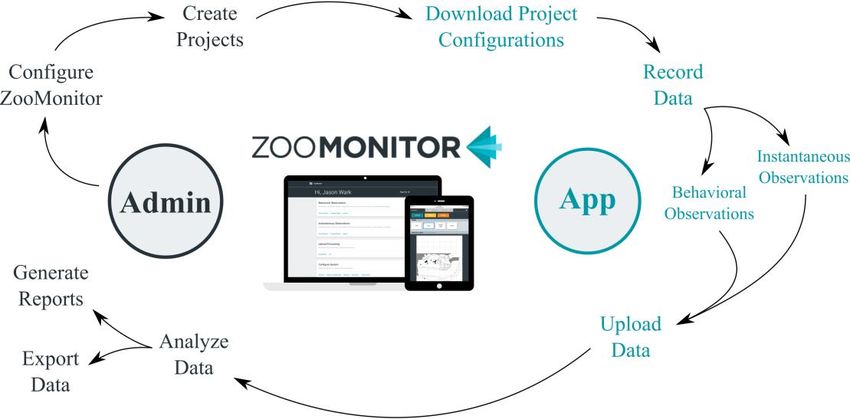
Wark et al. 160

reports and the raw data can be exported in CSV file format. User profiles can be configured in the Admin
section to have separate access to the Admin (“Admin Users”) or App sections (“Observers”), providing
customized access as needed based on the user’s role. ZooMonitor features two different data collection
modules: Behavioral Observations and Instantaneous Observations.

Figure 1. Overview of ZooMonitor Admin and App sections with a project task flow.

                  Recording Behavior in ZooMonitor: Behavioral Observations Module

         The Behavioral Observations module is used to record the behavior and space use of animals
using standardized sampling methods over a user-defined observation period. The ethogram, or list of
defined behaviors, can be created by a user and manually entered into ZooMonitor. An unlimited number
of behaviors can be added to a project and organized into mutually exclusive “behavior channels” (e.g.,
general behavior, posture, proximity, etc.). ZooMonitor supports three common behavior sampling
methods: 1) all-occurrence recording to track the frequency of behaviors (c.f. “all occurrences”, Altmann,
1974; “continuous”, Martin & Bateson, 2007); 2) continuous recording to track the duration of behaviors
(c.f. “focal-animal”, Altmann, 1974; “continuous”, Martin & Bateson, 2007); and 3) interval recording to
track the approximate time spent performing different behaviors (c.f. “instantaneous sampling”, Altmann,
1974; Martin & Bateson, 2007). The duration of sessions and length of intervals can be completely
customized by the user based on the project needs.
          In addition to these behavior recording options, users can also upload a map image of a habitat
and plot the location of animals in a habitat on the map image via interval sampling. Space use data can
be plotted using a user-specified grid layout on the image and/or using a 600x600 point coordinate
system. Habitat map images may be used to represent a top-down view of the habitat for terrestrial
species or a front view of the habitat for arboreal and aerial species. Uploaded images should be in .jpg or
.png file formats and can be generated in many ways, including through habitat blueprints, satellite
imagery (e.g., Google Earth), photos, and digital sketches. Projects created in the Behavioral
Observations module can be configured to include more than one sampling method. For example, a
project can be configured for all-occurrence recording of key welfare-related behaviors and recording
other behaviors and habitat use on an interval basis.
         ZooMonitor also supports the use of modifiers, allowing the user to record additional levels of
detail for a behavior (e.g., “inactive” behavior with modifiers of “alert” or “rest”). This functionality also
allows for users to record the recipients of social behaviors, allowing for subsequent analysis of social
relationships. Ethogram definitions for a project can also be entered when creating behaviors, and these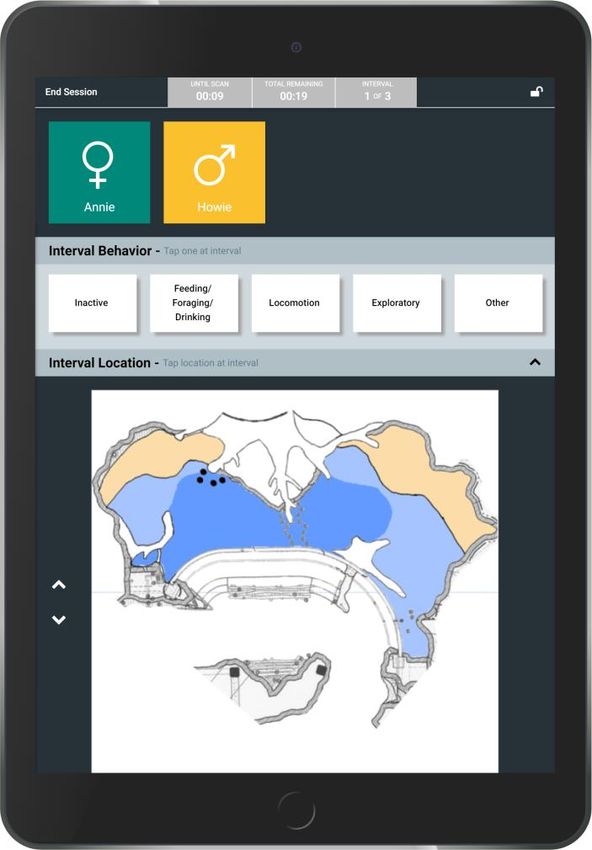
Wark et al. 161

definitions can be viewed when recording data to facilitate recording by less experienced users, or users
that are recording data on several species. Independent variables can be customized for projects and
recorded at the start of observations (referred to as “Additional Questions”, e.g., “crowd size”, “access
behind the scenes”).
         Depending on the sampling method of the recorded data, built-in reports can visualize the data as:
1) a behavior budget to identify broad patterns in the average time spent in different behaviors; 2) as a
heat map to identify how animals utilize their space; or 3) as a trend graph to see changes over time.
These reports can be filtered by the Additional Questions, or other variables such as focal animal or date
range, allowing users to quickly slice the data to address specific husbandry questions and see patterns in
behavior that can be leveraged when making decisions aimed to enhance animal welfare.
         When training new observers to record data on a project, reliability analyses are an important step
in the data validation process to ensure high quality, accurate data. This process most commonly involves
a trained observer scoring behaviors alongside one or more trainees (i.e., inter-observer reliability). To
support reliability testing, ZooMonitor features several built-in metrics that can be automatically
generated to compare interval data across sessions, including percent agreement and Cohen’s kappa
metrics (Martin & Bateson, 2007). To facilitate comparisons on space use coordinate data, a space use
threshold distance can be specified to determine location agreements.

     Recording Individual Characteristics in ZooMonitor: Instantaneous Observations Module

         The Instantaneous Observations module is used to record individual characteristics of an animal
at a single time point. These assessments can be configured as open-field text or numeric values, or as a
user-defined list of options. When defining a list of options, text definitions and images can be linked to
each rating value as a reference available for the user. When scoring data, the user could click a drop-
down field for each individual animal and select the rating value on a pop-up window (Figure 2). If a
project is designed to monitor multiple species, different images can be added for each species allowing
species-specific rating images. Currently, no built-in report options are available for this module, but data
can be exported in CSV file format for analysis in other software (e.g., Microsoft Excel).

                        Using ZooMonitor for Applied Behavioral Monitoring

         ZooMonitor was designed to be a flexible tool to accommodate the many types of questions an
animal manager may ask. Simple Behavioral Observation data collection projects could be created to
evaluate the presence vs absence of certain behaviors. For example, a user could monitor how much time
animals are active vs inactive, visible vs. not visible, or located in the sun versus shade. Simple projects
can also be created to identify how much time animals use enrichment and whether enrichment elicits
goal behaviors. Instantaneous Observation projects could be created to rate individuals on common
scoring systems, such as body condition scores. These simple projects with limited choices could be
quickly created and require minimal data collection training, making this a great choice when rapid
assessments on a specific question are needed. On the other hand, complex projects tracking a broad
range of behaviors may provide the additional insights necessary to understand the observed behavioral
patterns. For example, users could evaluate the response of an animal to a new habitat by plotting its
location on a map image of the habitat to identify space use patterns, while also recording a broad
ethogram to assess activity budget changes and even track all occurrences of key behaviors such as social
interactions. General monitoring projects on a broad range of behaviors could also be useful to
retrospectively assess behavior before and after unexpected but meaningful events, such as the birth or
death of an animal in a group. In the following sections, we present two case studies detailing the use of
Behavioral Observation and Instantaneous Observation projects for on-going monitoring at Lincoln Park
Zoo.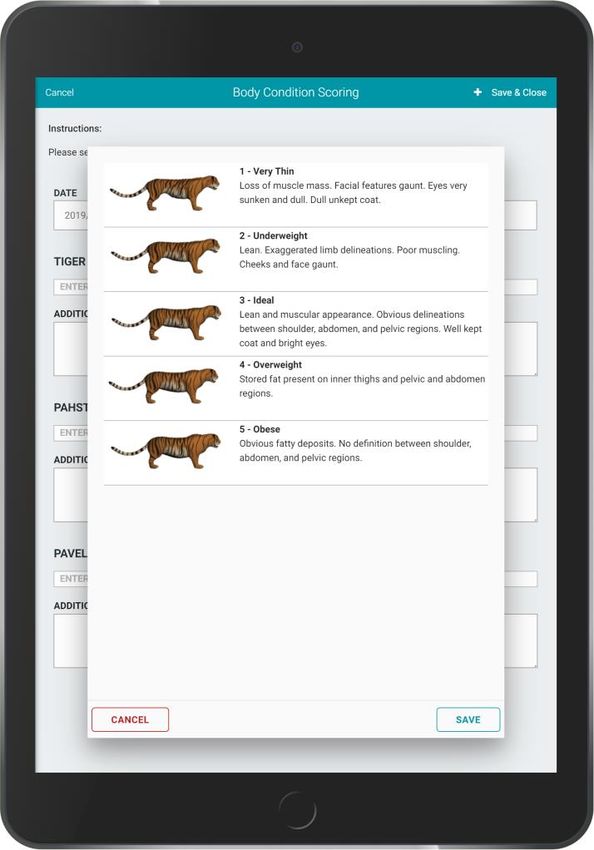
Wark et al. 162

Figure 2. Example of configuring ratings for an Instantaneous Observation project. Shown in this example is a project to record
body condition scores for tigers using a five-point scale (AZA Tiger Species Survival Plan, 2016).

Case Study: Promoting increased foraging and broader habitat use of pygmy hippos

        At Lincoln Park Zoo, a systematic behavioral monitoring program has been developed using the
ZooMonitor app through which trained volunteers, interns, and staff regularly record the behavior and
habitat use of approximately 40 species around the zoo. As part of this process, a general monitoring
project was established to track the behavior and space use of a male and female pygmy hippo (17 years
and 10 years, respectively). This project involved recording behaviors of the hippo and their location in
the habitat during ten-minute observation sessions with one-minute interval sampling of behavior and
habitat use (Figure 3). Volunteers and interns conducted observations on the hippos at randomized times
of day during monitoring rotations that included other on-going species monitoring projects. This process
produced approximately three sessions per day of behavior data on the pygmy hippos. As this project was
created for general monitoring purposes, a full ethogram of behaviors was defined and organized into
seven behavioral categories: Inactive, Locomotion, Feed/ Forage/ Drink, Undesirable, Other Solitary, and
Social behaviors. All observers met the criteria of 85% inter-observer reliability on behavior (percent
agreement; Martin & Bateson, 2007) and location (percent agreement based on a 30 pixel space use
threshold) with an experienced observer.
Wark et al. 163
Figure 3. Example data collection screen of the ZooMonitor app for monitoring the behavior and space use of pygmy hippos at
Lincoln Park Zoo. The image depicts a subset of user-specified behaviors (user scrolls screen to view full ethogram) and a user-
uploaded image representing a top-down view of the hippo habitat with colors representing different regions (tan = land, light
blue = shallow water, dark blue = deep water).
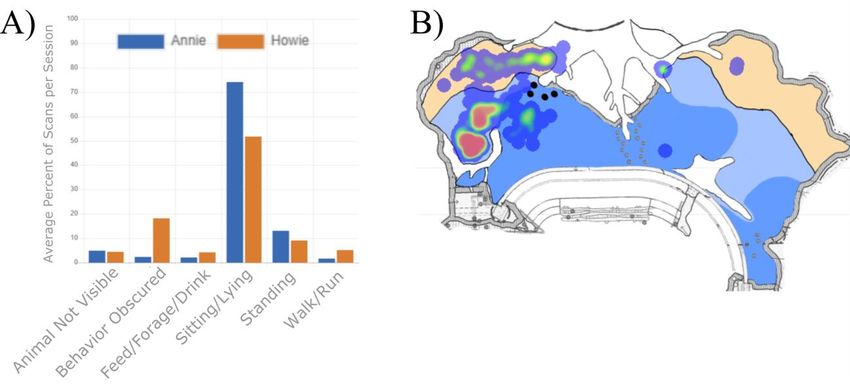
Data were analyzed from April to September 2017 (total of 5,240 minutes of observation). Data
were reviewed regularly as part of the ongoing monitoring program. Initial data from this project (April to
June) indicated a high level of inactivity by the hippos (combined average of 72% of time Sitting/ Lying
and Standing) and infrequent feeding events (combined average of 3% of time Feed/ Forage/ Drink)
(Figure 4A). In addition, unlike the male pygmy hippo that fully utilized the habitat, the female pygmy
hippo was observed only using a small portion of the available space in the habitat, spending nearly all
her time in the one third of the available space to the left-most side (Figure 4B). As pygmy hippos in the
wild have been noted to spend a large proportion of time foraging for small amounts of food, and
inactivity and obesity of zoo-housed hippos has been noted as a potential health risk (Flacke, Chambers,
Martin, & Paris, 2015), these data were interpreted as a potential concern from a welfare perspective.Wark et al. 164
Figure 4. Graphs generated from the ZooMonitor software. A) The initial behavior budget of two pygmy hippos, the female
shown in blue and male in orange. B) The heat map of the female hippo. Areas most frequently used are shown in red, areas less
frequently used are shown in green and dark blue, respectively.
In response to these initial findings, animal managers and scientists in the Animal Welfare
Science Program discussed methods to increase activity and space use for the pygmy hippos. From these
discussions, several husbandry changes were initiated. First, animal managers installed automated belt
feeders (Model BFS12A, Pentair Aquatic Eco-systems, Inc., Cary, NC) in three locations around the
habitat. Previously, the entire diet was fed in a single location in the habitat in one morning meal, but with
the addition of automated belt feeders, 80% of the diet was changed to be fed randomly throughout the
day at various locations using the belt feeders. Care staff placed food on slowly rotating belts inside these
feeders so that small amounts of food were dropped into the habitat from above at several times
throughout the day, at times unpredictable to the animals. The goal was to encourage more natural feeding
patterns characterized by an increase in time spent feeding, less time inactive, and more diverse space use
by the hippos.
ZooMonitor reports were reviewed again after the automated belt feeders were installed and in
use for 12 weeks (3,670 min of observation). Visual inspection of the automatically generated
ZooMonitor reports indicated that both pygmy hippos spent less time inactive (combined average of 57%
of time Sitting/ Lying and Standing) and more time feeding throughout the day (combined average of
11% of time Feed/ Forage/ Drink; Figure 5A) after the automated belt feeders were incorporated. Also,
the female hippo was observed using a greater portion of the habitat space (Figure 5B) while the male
hippo continued to utilize the full habitat. This case study is intended to demonstrate that qualitative,
visual inspection of the ZooMonitor-generated reports can be used to guide decisions to improve animal
welfare. For large-scale projects requiring additional confidence in the findings, data could be exported
and analyzed manually for statistical significance using appropriate methods.Wark et al. 165
Figure 5. The behavior budget of the two pygmy hippos (A) with the female shown in blue and male in orange and heat map of
the female hippo’s space use (B) after automated belt feeders were installed in three locations above the habitat (red stars).
Case Study: Tracking feather quality changes in a flock of chickens
Lincoln Park Zoo cared for a small group of adult hens (Gallus gallus, N = 5, age range 2 to 8
years) together with a rooster (age 1 year) in a space with 10.4 m2 indoor and 14.0 m2 outdoor access.
During routine care and observation, caretakers noted aggression within the flock among the hens, as well
as injuries to the hens as a result of the rooster’s mating attempts. In response to these observations,
several changes were made. Specifically, the rooster was removed from the flock and placed with a male
conspecific for social companionship, and the hens were relocated to a larger, outdoor yard (74.3 m2) with
access to an indoor coop (9.7 m2), introduced to 12 younger females (age 2 months), and systematic
monitoring of plumage condition was initiated using the ZooMonitor Instantaneous Observations module.
Plumage condition monitoring was initiated to track whether the hens’ feather condition
improved upon the removal of the rooster and transfer to a larger yard, and to determine whether feather
condition was compromised for any chickens when the 12 additional females were introduced. Feather
condition is one reliable, non-intrusive indicator of chicken welfare; decreases in plumage quality can
result from physical trauma and reflect changes in corticosterone (e.g., Campo, Gil, Torres, & Davila,
2001; Lattin, Reed, DesRochers, & Romero, 2011). We adopted the LayWel methodology, rating
plumage quality on a 1 to 4 scale for six areas of the body (neck, breast, vent/cloaca, back, wings, tail)
following the systematic, pictorially-guided scoring scheme (www.laywel.eu). Higher scores reflect better
plumage condition. This non-invasive, observational method has been validated against intrusive, in-hand
scoring (Kjaer, Glawatz, Scholz, Rettenbacher, & Tauson, 2011).
Immediately after the hens were transferred to the new yard, plumage condition scores were
recorded for each animal 1-2 times per week over 16 weeks by two observers following the LayWel
guide. A weekly average score per body region per individual was calculated. Results indicated that, for
all individuals, feather condition values remained at the highest value, 4, for breast, neck and vent/cloaca
regions, with scores less than 4 only recorded for the back, wing and tail regions. This pattern of feather
damage supports the caretakers’ impressions that feather injuries were due to conspecific interactions as
these are the body regions that would be directly impacted by male mounting and/or aggressive pecking
by either sex; these regions would not be easily accessible for any self-directed behaviors. Furthermore,
the 12 introduced hens initially received scores of 4 for all body regions and retained that score for the
entire observation period. This pattern indicates that the introduced females were not subject to feather-
damaging aggression after being introduced to the adult hens. For the original adult hens, two hensWark et al. 166
received a score of 4 for all regions for the full study period. The remaining three adult hens experienced
general improvement in the scores for their backs, tail and wings over time (average change week 1 to
week 16 for back: +1.33, range +1.0 to +2.0; tail: +0.067, range 0 to +1; wings +1.0, range +1 to +1).
Regarding the wing region specifically, all three hens showed an improvement in the plumage scores for
the wing region over the first six weeks and then plateaued at a score of 3, suggesting that the damage to
their feathers in this region prior to the start of data collection may have been too severe for full recovery.
These data provide an updated baseline for wing plumage condition for these individuals from which to
monitor welfare moving forward.
In this case study, it is not possible to disentangle the influence of moving the hens to a larger
yard and removing the rooster as these changes occurred simultaneously. However, in a zoo setting, the
priority is typically to improve welfare as soon as possible at the expense of avoiding confounding
influences that may hamper our ability to discern which change had the greatest impact. In this example,
ZooMonitor allows for continual tracking of one informative welfare indicator, feather condition, as co-
occurring and isolated changes were implemented, providing quick feedback on whether additional
changes were required, and creating new individual baselines that can be referred to as we continue to
care for these individuals.
Conclusion and Future Directions
ZooMonitor was developed by Lincoln Park Zoo as a tool for the zoological community to
engage in on-going behavioral monitoring and facilitate a continual assessment of animal welfare. Digital
tools for recording behavioral data, although commonplace in laboratory and field settings, have been
previously limited in the zoological community, primarily due to technical challenges and costs. With the
ZooMonitor app, animal care staff and researchers can now track the behavior and characteristics of
animals over time using standardized methods and visualize these data using built-in reports. These
reports can help determine “normal” patterns for an individual that can then be used to identify deviations
that may represent a change in an individual’s welfare status and allow data-driven decision making to
improve welfare. Combining longitudinal behavioral data with systematic tracking of individual
characteristics, and integrating these data with husbandry records for an individual, can support a holistic
evaluation of animal welfare using the ZooMonitor app.
Acknowledgements
ZooMonitor was made possible in part by the Institute of Museum and Library Services National
Leadership Grant (MG-30-14-0045-14). We thank The Rice Foundation for supporting a pilot version of
ZooMonitor. We are grateful to the following grant project partners: Chimfunshi Wildlife Orphanage
Trust, Chimp Haven, Cleveland Metroparks Zoo, Denver Zoo, Detroit Zoological Society, Disney’s
Animal Kingdom, Jacksonville Zoo and Gardens, North Carolina Zoo, Oregon Zoo, San Francisco
Zoological Society, Shedd Aquarium, Toledo Zoo, Tulsa Zoo, and Zoo Atlanta. Specifically, we thank the
following colleagues for their valuable feedback testing ZooMonitor: Andrew Alba, Stephanie Allard,
Bonnie Baird, Joe Barkowski, Rebecca Bearman, Bill Van Bonn, Elizabeth Braik, Hani Freeman,
Bethany Hansen, Matthew Heintz, Emily Insalaco, Corinne Kendall, Bethany Krebs, Karen Lewis,
Kristen Lukas, Terry Maple, Beth Posta, Steve Ross, Valerie Segura, David Shepherdson, Marcie Tarvid,
Jason Watters, and Nadja Wielebnowski. We thank Maureen Leahy and the Animal Care and Horticulture
staff at Lincoln Park Zoo for facilitating data collection and husbandry modifications. We thank Clara
Stahlmann Roeder, Jeremy Gill, John Wilcox, and the Lincoln Park Zoo volunteers that tested
ZooMonitor and collected data. Lastly, we would like to thank three anonymous reviewers for their
valuable feedback on a draft of this manuscript. The authors acknowledge a potential financial conflict of
interest: a low-cost subscription is required for users outside of accredited zoos, aquariums and
sanctuaries; this fee is collected directly by the developer (T.N.) and used only to support the cloud server
storage and app maintenance.Wark et al. 167
References
Altmann, J. (1974). Observational study of behavior: Sampling methods. Behaviour, 49, 227–266.
http://dx.doi.org/10.1163/156853974X00534
Association of Zoos and Aquariums (AZA) (2019). The accreditation standards and related policies, 2019 ed.
Retrieved from https://www.aza.org/accred-materials
AZA Tiger Species Survival Plan (2016). Tiger care manual. Silver Spring, MD: Association of Zoos and
Aquariums.
Brando, S., & Buchanan-Smith, H. M. (2018). The 24/7 approach to promoting optimal welfare for captive wild
animals. Behavioural Processes, 156, 83–95. http://dx.doi.org/10.1016/j.beproc.2017.09.010
Campo, J. L., Gil, M. G., Torres, O., & Davila, S. G. (2001) Association between plumage condition and fear and
stress levels in five breeds of chickens. Poultry Science, 80, 549–552. http://dx.doi.org/10.1093/ps/80.5.549
Flacke, G. L., Chambers, B. K., Martin, G. B., & Paris, M. C. J. (2015). The pygmy hippopotamus Choeropsis
liberiensis (Morton, 1849): Bringing to light research priorities for the largely forgotten, smaller hippo
species. Der Zoololische Garten, 84, 234–265. http://dx.doi.org/10.1016/j.zoolgart.2015.07.006
Friard, O., & Gamba, M. (2016). BORIS: A free, versatile open-source event-logging software for video/audio
coding and live observations. Methods in Ecology and Evolution, 7, 1325–1330.
http://dx.doi.org/10.1111/2041-210X.12584
Hansen, B. K., Fultz, A. L., Hopper, L. M., & Ross, S. R. (2018). An evaluation of video cameras for collecting
observational data on sanctuary-housed chimpanzees (Pan troglodytes). Zoo Biology, 37, 156–161.
http://dx.doi.org/10.1002/zoo.21410
Hill, S. P., & Broom, D. M. (2009). Measuring zoo animal welfare: Theory and practice. Zoo Biology, 28, 531–544.
http://dx.doi.org/10.1002/zoo.20276
Kjaer, J., Glawatz, H., Scholz, B., Rettenbacher, S., & Tauson, R. (2011). Reducing stress during welfare inspection:
Validation of a non-intrusive version of the LayWel plumage scoring system for laying hens. British
Poultry Science, 52, 149–154. http://dx.doi.org/10.1080/00071668.2011.554799
Lattin, C. R., Reed, J. M., DesRochers, D. W., & Romero, L. M. (2011). Elevated corticosterone in feathers
correlates with corticosterone-induced decreased feather quality: A validation study. Journal of Avian
Biology, 42, 257–252. http://dx.doi.org/10.1111/j.1600-048X.2010.05310.x
LayWel Project. Retrieved from http://www.laywel.edu.
Less, E. H., Kuhar, C. W., Dennis, P. M., & Lukas, K. E. (2012). Assessing inactivity in zoo gorillas using keeper
ratings and behavioral data. Applied Animal Behaviour Science, 137, 74–79.
http://dx.doi.org/10.1016/j.applanim.2012.01.001
Martin, P., & Bateson, P. (2007). Measuring behavior: An introductory guide (3rd ed.). Cambridge, UK: Cambridge
University Press.
Melfi, V. A. (2009). There are big gaps in our knowledge, and thus approach, to zoo animal welfare: A case for
evidence-based zoo animal management. Zoo Biology, 28, 574–588. http://dx.doi.org/10.1002/zoo.20288
Noldus, L. P. J. J. (1991). The observer: A software system for collection and analysis of observational data.
Behavior Research Methods, Instruments, & Computers, 23, 415–429.
Watters, J. V., Margulis, S. W., & Atsalis, S. (2009). Behavioral monitoring in zoos and aquariums: A tool for
guiding husbandry and directing research. Zoo Biology, 28, 35–48. http://dx.doi.org/10.1002/zoo.20207
Whitham, J. C., & Miller, L. J. (2016). Using technology to monitor and improve zoo animal welfare. Animal
Welfare, 25, 395–409. http://dx.doi.org/10.7120/09627286.25.4.395
Whitham, J. C., & Wielebnowski, N. (2009). Animal-based welfare monitoring: Using keeper ratings as an
assessment tool. Zoo Biology, 28, 545–560. http://dx.doi.org/10.1002/zoo.20281
Whitham, J. C., & Wielebnowski, N. (2013). New directions for zoo animal welfare science. Applied Animal
Behaviour Science, 147, 247–260. http://dx.doi.org/10.1016/j.applanim.2013.02.004You can also read