Sensitivity and Specificity of Gastric Ultrasonography in Determination of Gastric Contents - AANA
←
→
Page content transcription
If your browser does not render page correctly, please read the page content below
Sensitivity and Specificity of Gastric
Ultrasonography in Determination of Gastric
Contents
Eric J. Johnson, DNAP, CRNA
Julie Morbach, MA, RDMS, RVT, RT(R)
Cindy Blake, MEd, RDMS, RVT
Shannon Pecka, PhD, CRNA
Perioperative pulmonary aspiration (PPA) is a major 90% for identification of liquids. Interrater reliability
cause of morbidity and mortality. During anesthesia, results yielded an intraclass correlation coefficient
airway reflexes become depressed, placing patients (ICC)=.781 for the solid group; ICC=.950 for the fluid
at risk of PPA. Gastric ultrasonography (GUS) can be group; and ICC=.761 for the fasted group. Statistically
used to qualitatively differentiate between solids, liq- significant differences were found for the effect that
uids, and empty gastric contents. The purpose of this body mass index classifications had on sensitivity
study was to determine the sensitivity and specificity and specificity of GUS for predicting gastric con-
of GUS in identifying gastric contents after partici- tent. Results of this study demonstrated that GUS is
pants were randomly assigned to consume 1 donut, highly sensitive, specific, and reliable with low false-
drink 360 mL of water, or remain fasted (n=60 each positive and false-negative rates in the identification
group). Ultrasonography was performed by a blinded of fluid gastric content.
scanner, and qualitative findings were recorded by
2 sonography examiners and the primary scanner. Keywords: Diagnostic accuracy, gastric content, gas-
Findings from the water group included a sensi- tric ultrasound, pulmonary aspiration, sensitivity and
tivity of 95% to 100% and specificity of 87.5% to specificity.
D
uring anesthesia, airway reflexes become from full depiction of all the layers to a target or bull’s-
depressed, placing patients at risk of intraop- eye appearance5 (Figure 2).
erative pulmonary aspiration. Aspiration of Different approaches to gastric ultrasonography
gastric contents can cause chemical pneumo- (GUS) have been used to assess quality and quantity of
nitis characterized by bronchospasm, hypox- gastric contents.6 One approach used in previous studies
emia, and atelectasis. In serious cases, epithelial degen- was to examine the cross-sectional area of the antrum to
eration, interstitial and alveolar edema, and hemorrhage quantitatively evaluate fluid contents.7-15 A second ap-
into air spaces can rapidly progress to acute respiratory proach uses a grading system (Grades 0, 1, and 2)13 to
distress syndrome. Researchers have found that proper qualitatively evaluate fluid contents by assessment of the
assessment of aspiration risk may aid in preventing pul- gastric antrum in the supine and right lateral decubitus
monary aspiration by improving the choice of anesthetic position.10,13,16 A third approach (and the one used in
technique that anesthesia providers make for patients.1-3 this study) includes an assessment of the gastric antrum
It has also been found that despite fasting, patients may to qualitatively differentiate between solids, clear liquids,
present with a full stomach.3,4 and empty gastric contents.8,13,17 Anatomical landmarks
Sonographic imaging allows for real-time assess- (liver, abdominal aorta, pancreas, inferior vena cava
ment of gastric contents and may be a useful aspiration [IVC]) are used to locate the gastric antrum for direct
risk assessment adjunct to traditional nothing-by-mouth visualization of gastric contents. Gastric contents are
fasting status. Brightness-mode (B-mode) ultrasonogra- then differentiated based on visualization of a collapsed
phy (grayscale) is used to identify the 4 to 5 concentric antrum (empty stomach), an expanded antrum and a
layers of the gut signature5 (Figure 1). The layers should hypoechoic finding (liquids in the stomach), or an ex-
alternate in appearance between hyperechoic and hy- panded antrum and a hyperechoic finding (solids in the
poechoic.5 The muscular components of the gut wall stomach). This approach may be a useful tool to deter-
(muscularis mucosa and muscularis propria) are those mine gastric content and guide anesthetic induction tech-
that appear hypoechoic.5 Routine cross-sectional sono- nique and intraoperative anesthesia management, and to
graphic imaging can depict the gut signature as anything determine if surgical delay or cancellation is warranted.
www.aana.com/aanajournalonline AANA Journal February 2021 Vol. 89, No. 1 9
Figure 1. Concentric Layers of Bowel
Abbreviations: BMI, body mass index; IVC, inferior vena cava; Figure 2. Target or “Bulls-Eye” Appearance
Panc, pancreas. Abbreviation: Panc, pancreas.
Researchers have only recently begun examin- criteria included pregnancy, previous gastric or esopha-
ing the sensitivity and specificity of GUS to identify geal surgery, known upper gastrointestinal tract abnor-
gastric content using the direct visualization approach. malities, diabetes, hepatic impairment, or neurologic
Sensitivity is the probability of correctly identifying the disorders. After participant recruitment, study scans were
presence of a disease when the disease does actually exist. scheduled, instructions and additional study information
Specificity is the probability of correctly identifying the were sent to participants, and participants were instruct-
absence of a disease when the disease does not actually ed to remain fasted from solids, liquids, and chewing
exist.18 Sensitivity has been found to be high in begin- gum for a minimum of 8 hours before their scheduled
ning studies using the direct visualization approach, study scan time.
whereas specificity results are mixed.7,17 • Procedures. Informed consent was obtained on
The primary outcome of this study was to evaluate arrival the day of the scheduled study. Participants were
the diagnostic accuracy of GUS in identifying presence, randomly assigned to 3 equal-sized groups: (1) remain
absence, and type of gastric contents using the direct fasted, (2) consume 1 donut, and (3) consume 360 mL
visualization approach. Diagnostic accuracy is defined as of water. Gastric ultrasonography was performed by
the sensitivity and specificity of GUS for allowing the de- scanner A (a doctor of nurse anesthesia practice student)
termination of gastric contents including solids, liquids, in the sonography laboratory. The GUS scans began 1 to
or an empty stomach. A secondary outcome of this study 10 minutes after participant randomization and ingestion
included examining the impact of body mass index (BMI) according to the assigned group, and the scanner was
on correct identification (assessment) of gastric contents. blinded to the participant’s randomization. The primary
Primary research questions included the following: outcomes of sensitivity, specificity, false-positive rates,
1.What is the sensitivity and specificity of GUS in and false-negative rates were evaluated by comparing a
identifying presence (including type) and absence of participant’s randomization status (solid/liquid/empty)
gastric contents? to the scanner and examiners’ qualitative assessment of
2.What are the false-positive and false-negative rates “empty,” “solid,” or “liquid” as identified during GUS
in identifying presence (including type) and absence of evaluation. Clear liquids were defined as a hypoecho-
gastric contents? ic finding within the stomach (antrum). Solids were
defined as a hyperechoic finding within the stomach
Methods (antrum). Empty was defined as a collapsed antrum with
• Participants. After institutional review board approval, no visible content.
the convenience sample consisting of sonography and For GUS the Epiq 5 Diamond Select ultrasound
nurse anesthesia students was recruited to participate. machine (Philips)19 with a low-frequency C6-2 curvilin-
The sample size was determined by reviewing prior ear array transducer on the abdominal setting was used.
studies examining sensitivity and specificity for de- Participants were initially scanned in the supine posi-
termining the type of gastric contents using similar tion followed by the right lateral decubitus position. To
methods.7,17 Inclusion criteria included the ability to ensure consistency between participants, the researchers
understand the study protocol; age 19 to 85 years; and used the following procedure. The gastric antrum was
willingness to consume 1 donut or 360 mL of water, and best visualized with the curvilinear transducer placed
appropriately fast for a minimum of 8 hours. Exclusion in the midline sagittal plane in the epigastric region and
10 AANA Journal February 2021 Vol. 89, No. 1 www.aana.com/aanajournalonline
Total sample                     Solids                   Liquids                         Fasted
 Characteristic                (N=60)a                        (n=20)                   (n=20)                          (n=20)
 Age, y                   Mean (SD)=26.25 (5.3)        Mean (SD)=25.65 (4.78)     Mean (SD)=26.7 (4.87)       Mean (SD)=26.37 (6.56)
                          Median=27.0                  Mean rank=29               Mean rank=31.6              Mean rank=29.37
                          χ2=.269 (df=2), P=.874
 Fasting time, h          Mean (SD)=9.95 (1.4)         Mean (SD)=9.48 (1.437)     Mean (SD)=10.13 (1.39)      Mean (SD)=10.13 (1.321)
                          Median=10.0                  Mean rank=23.85            Mean rank=33.23             Mean rank=33.08
                          χ2=2.83 (df=2), P=.243
 Body mass index,         Mean (SD)=24.47 (4.7)        Mean (SD)=24.08 (4.3)      Mean (SD)=23.38 (3.78)      Mean (SD)=26.107 (1.304)
 kg/m2                    Median=23.17                 Mean rank=28.53            Mean rank=27.08             Mean rank=34.63
                          χ2=2.11 (df=2), P=.348
 Scan
  Mean=3.71 (1.87)                                     Mean (SD)=4.25 (2.197)     Mean (SD)=2.83 (1.12)       Mean (SD)=4.05 (1.92)
 time, min
  Median=3.0                                           Mean rank=35.28            Mean rank=21.5              Mean rank=33.39
  χ2=7.9 (df=2), P=.019b                               Solids/liquids groupsc     Liquids/fasted groupsc      Fasted/solids groupsc
 		                                                    U=101, P=.006b             U=119, P=.04b               U=183.5, P=.85

Table 1. Demographic Information
aKruskal-Wallace test was used to analyze differences between groups. Age, fasting time, and body mass index were found to be
nonsignificant.
bSignificant (P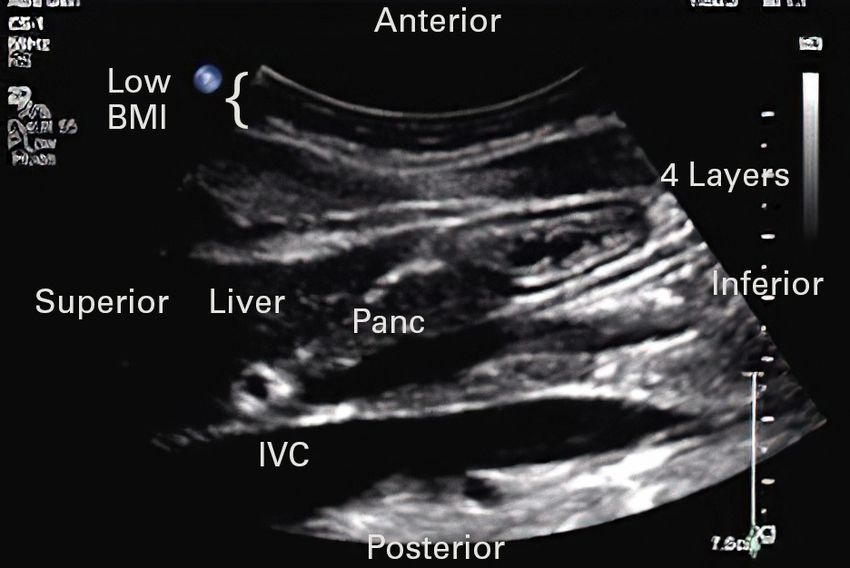
Sensitivity             Specificity          False positive            False negative

 Solids (solids)
   Scanner A                      45                      90                      10                       55
   Examiner A                     65                      80                      20                       35
   Examiner B                     50                     82.5                    17.5                      50
 Fluids (liquids)
   Scanner A                     100                     87.5                    12.5                       0
   Examiner A                    100                     87.5                    12.5                       0
   Examiner B                     95                      90                      10                        5
 Fasted (fasted)
   Scanner A                      75                     82.5                    17.5                      25
   Examiner A                     45                     87.5                    12.5                      55
   Examiner B                     60                      80                      20                       40

Table 3. Sensitivity, Specificity, False Positives, and False Negatives (percent)

Results                                                         weight, obese) on the accuracy of correct assessments of
Forty-two healthy volunteers were recruited to par-             scanners and examiners. Because the BMI category for
ticipate in the study. Eighteen of the 42 participants          underweight included 1 participant, it was not included
were randomly selected to different groups twice with           in the analysis. Statistically significant differences were
2 weeks between scans to attain a total of 60 random-           found between BMI weight categories of obese, over-
ized GUS scans. Participants’ BMIs were categorized into        weight, and normal/healthy for all researchers (scanner
underweight (BMI
BMI (≥30)               BMI (25-29.9)                 BMI (18.5-24.9)
 Researcher                      Obese (n=11)           Overweight (n=11)            Normal/healthy (n=37)               P valuea
 Scanner A:                          7/11 (63.6)              6/11 (54.5)                    31/37 (83.8)                  ≤.001b
 Correct assessments,
 No. (%)
 Examiner A:                         4/11 (36.4)              7/11 (63.6)                    30/37 (81.1)                  .002b
 Correct assessments,
 No. (%)
 Examiner B:                         5/11 (45.5)              8/11 (72.7)                    28/37 (75.7)                  .005b
 Correct assessments,
 No. (%)

Table 4. Effect of Body Mass Index (BMI) on Accuracy of Correct Assessments
aFisher exact test was used to evaluate differences in correct assessments between BMI categories (kg/m2) of obese, overweight, and
normal/healthy. Underweight category was not included in the analysis because there was only one participant.
bSignificant (P
Test Definition Example
Sensitivity Probability of correctly identifying a •P
robability of correctly identifying solids by GUS when a donut was
condition that exists. It is the probability consumed.
that a test is positive when the condition is
•P
robability of correctly identifying liquids by GUS when water was
known to exist.30
consumed.
•P
robability of correctly identifying an empty stomach when the
stomach is truly empty.
• Positive test and positive disease.
Specificity Probability of correctly identifying that a •P
robability of correctly identifying the absence of a donut when
condition does not exist. It is the probability water has been consumed or a person has an empty stomach.
that a test is negative when the condition is •P
robability of correctly identifying the absence of water when a
known to not exist.30 donut has been consumed or a person has an empty stomach.
•P
robability of correctly identifying the absence of gastric contents by
GUS when a person consumed a donut or water.
• Negative test and negative disease.
False negative Probability of not identifying a condition • “Misses”
when the condition actually does exist.30
•P
robability of identifying an empty stomach by GUS when a donut
was actually consumed.
• Negative test and positive disease.
False positive Probability of identifying that a condition • “False alarms”
does exist when a condition does not •P
robability of identifying a donut by GUS when an empty stomach is
actually exist.30 the reality.
• Positive test and negative disease.
Table 5. Statistical Measures of Accuracy and Examples
Abbreviation: GUS, gastric ultrasonography.
overweight (54.5%-72.7%) or obese (36.4%-63.6%) par- dividuals with different BMIs. Differences in the amount
ticipants. The higher the BMI weight category, the lower of adipose tissue present in the anterior abdominal area
the accuracy of all researchers for correct assessment can be seen. The adipose tissue itself may interfere with
of gastric content. These differences were found to be scanning if it is thickest in this region. In our study, sen-
statistically significant. For normal/healthy-weight par- sitivity and specificity of the obese weight category were
ticipants, the researchers had the highest overall accuracy lowest, indicating that BMI may affect accuracy.
and for obese participants had the lowest overall accura- The right lateral decubitus body position aids in the
cy. These results are consistent with those of a prior study assessment of the pylorus for the exact purpose of repo-
finding that higher weight was associated with reduced sitioning adipose tissue and air within the body. If fluid
accuracy in pregnant females after 32 weeks’ gestation.27 is present, it may likely move to the more dependent
It is important to note, however, that like our study, most portion of the stomach, making the antrum/pylorus
studies evaluating GUS accuracy exclude the pregnant easier to identify. We found in our study that captur-
population. No prior studies have examined the impact of ing a cine loop was more helpful in identifying contents
BMI weight categories on GUS accuracy for identification compared with a still image. A cine loop is a display of
of gastric contents in the nonpregnant population. numerous static images that allow for demonstration of
Body mass index may have an impact on the size of the active bowel.
the antrum,31 as well as having an attenuation effect on There are limitations to this study. The scanner was a
sound propagation. Brahee et al32 noted that physicians doctor of nurse anesthesia practice student. The scanner
routinely commented that the quality of ultrasound did have formal didactic training in ultrasound principles
images for obese patients (BMI ≥30 kg/m2) was severely and had used ultrasound imaging techniques in the clini-
reduced. Image quality is believed to be diminished due cal setting in 139 clinical cases according to records from
to attenuation, or weakening, of a sound wave as it propa- a student tracking system (Typhon, Typhon Group).
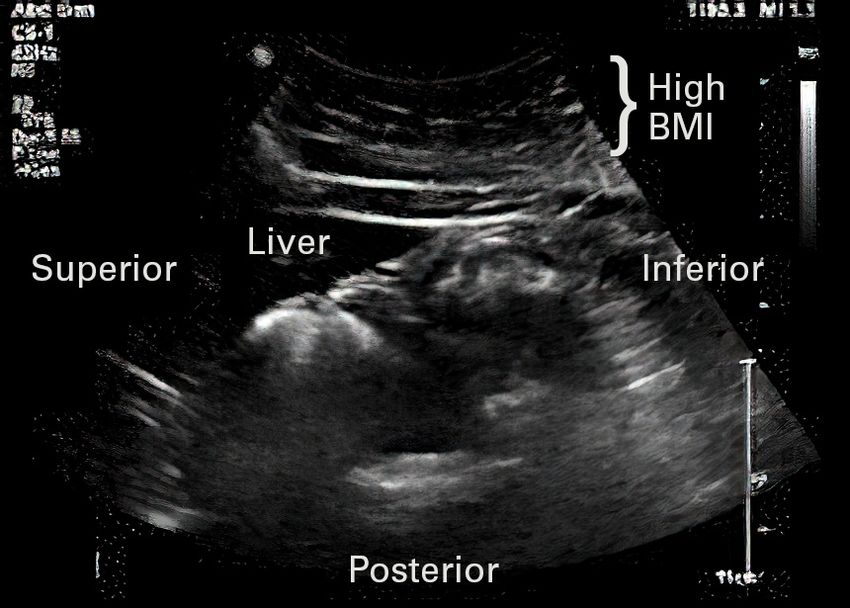
gates through tissue. The transducer frequency used for However, experiences were limited in GUS. Prestudy
a patient with a normal BMI would be inadequate to pen- GUS examinations numbered 15. A prior study of 6 anes-
etrate through tissue of patients with a higher BMI. See thesiologists found that there may be a learning curve to
Figure 1 (low BMI) and Figure 4 (high BMI) in which the GUS requiring approximately 24 to 33 scans to achieve
same transducer was used for images produced from in- 90% to 95% success rates following a teaching interven-
14 AANA Journal February 2021 Vol. 89, No. 1 www.aana.com/aanajournalonlineFigure 3. Air Within the Stomach Figure 4. Participant With High Body Mass Index (BMI)
tion.26 Similar to other studies,17,24,27 our study did find transducer is designed for clear image generation and
high reliability when examining ICC between the student deeper penetration to visualize structures located within
registered nurse anesthetist and 2 expert sonographers. the abdominal cavity. In clinical practice, the machine
The sonography experts also noted that it was more dif- used most often for point-of-care testing is the Fujifilm
ficult to evaluate still images and short cine loops com- SonoSite.33 The Fujifilm SonoSite is designed for more
pared with real-time scans. Real-time imaging allows for superficial structures and uses a linear array transducer.
a more complete scan and the ability to explore tissue in The SonoSite does offer a curved array transducer that
relation to other abdominal structures. can be used for scanning in the abdominal cavity and that
Effects on the BMI categories of weight may have been is recommended to improve image clarity for abdominal
influenced by rescanning of participants and inadequate organs. In the event that only a linear transducer is avail-
sample sizes. Rescanning of participants was not included able, clarity of deep abdominal structures may be reduced.
in the original design of the study and may have affected In conclusion, this study demonstrated that GUS is
study results. The sample size may have been inadequate highly sensitive, specific, and reliable with low false-
to account for the effects of BMI categories of weight. The positive and false-negative rates in the identification of
original design of the study included a continuous BMI liquid gastric content. Gastric ultrasonography was more
variable. The analysis for this study indicates that BMI accurate in allowing the correct identification of gastric
weight category may have an effect on accuracy. Future content in normal/healthy-weight participants compared
studies are needed to control for the effect of BMI weight with higher weight categories. In this study, GUS demon-
categories on GUS assessment and must include an ad- strated that there is a high rate of false positives and false
equately powered study with a higher sample size. negatives for the empty and solid states.
The unknown baseline gastric content of participants
REFERENCES
was also a limitation. Participants were assumed to have 1. Sakai T, Planinsic RM, Quinlan JJ, Handley LJ, Kim T-Y, Hilmi IA.
empty stomachs after fasting, and baseline GUS contents The incidence and outcome of perioperative pulmonary aspiration
were not assessed before randomization. It is possible in a university hospital: a 4-year retrospective analysis. Anesth Analg.
2006;103(4):941-947. doi:10.1213/01.ane.0000237296.57941.e7
that excess baseline gastric sections (>1.5 mL/kg or >100 2. Cook TM, Woodall N, Frerk C; Fourth National Audit Project.
mL) and/or residual undigested food may have affected Major complications of airway management in the UK: results of the
results for the fasted group.10,13 A retrospective review Fourth National Audit Project of the Royal College of Anaesthetists
and the Difficult Airway Society. Part 1: anaesthesia. Br J Anaesth.
of scans from 8 participants who were randomized to the 2011;106(5):617-631. doi:10.1093/bja/aer058
fasted group showed they were scored by all examiners 3. Neelakanta G, Chikyarappa A. A review of patients with pulmo-
as liquid or solid. Examiners noted that several of these nary aspiration of gastric contents during anesthesia reported to
scans appeared to be of mixed gastric contents (liquid the Departmental Quality Assurance Committee. J Clin Anesth.
2006;18(2):102-107. doi:10.1016/j.jclinane.2005.07.002
and solids). A possible explanation for this is baseline
4. Van de Putte P, Vernieuwe L, Jerjir A, Verschueren L, Tacken M, Per-
gastric sections and/or residual undigested food. These las A. When fasted is not empty: a retrospective cohort study of gas-
findings may have led to lower sensitivity and specificity tric content in fasted surgical patients. Br J Anaesth. 2017;118(3):363-
findings for the fasted group. 371. doi:10.1093/bja/aew435
5. Wilson SR. The gastrointestinal tract. In: Rumack C, Levine D, eds.
Finally, the application to clinical point-of-care testing Diagnostic Ultrasound. 5th ed. Vol 1. Elsevier; 2018:256-307.
must be considered. In this research study an Epiq 6. Van de Putte P, Perlas A. Ultrasound assessment of gastric content and
5 Ultrasound System with a curved array transducer volume. Br J Anaesth. 2014;113(1):12-22. doi:10.1093/bja/aeu151
(C6-2) and a general abdominal preset was used.19 This 7. Kruisselbrink, R, Gharapetian A, Chaparro LE, et al. Diagnostic accu-
www.aana.com/aanajournalonline AANA Journal February 2021 Vol. 89, No. 1 15racy of point-of-care gastric ultrasound. Anesth Analg. 2019;128(1):89- can Society of Anesthesiologists task force on preoperative fasting
95. doi:10.1213/ANE.0000000000003372 and the use of pharmacologic agents to reduce the risk of pulmo-
8. Perlas A, Chan VW, Lupu CM, Mitsakakis N, Hanbidge A. Ultra- nary aspiration. Anesthesiology. 2017;126(3):376-393. doi:10.1097/
sound assessment of gastric content and volume. Anesthesiology. ALN.0000000000001452
2009;111(1):82-89. doi:10.1097/ALN.0b013e3181a97250 24. Kruisselbrink R, Arzola C, Endersby R, Tse C, Chan V, Perlas
9. Alakkad H, Kruisselbrink R, Chin KJ, et al. Point-of-care ultrasound A. Intra- and interrater reliability of ultrasound assessment of
defines gastric content and changes the anesthetic management of gastric volume. Anesthesiology. 2014;121(1):46-51. doi:10.1097/
elective surgical patients who have not followed fasting instructions: ALN.0000000000000193
a prospective case series. Can J Anaesth. 2015;62(11):1188-1195. 25. Cubillos J, Tse C, Chan VWS, Perlas A. Bedside ultrasound assess-
doi:10.1007/s12630-015-0449-1 ment of gastric content: an observational study. Can J Anaesth.
10. Perlas A, Mitsakakis N, Liu L, et al. Validation of a mathematical 2012;59(4):416-423. doi:10.1007/s12630-011-9661-9
model for ultrasound assessment of gastric volume by gastroscopic 26. Arzola C, Carvalho JC, Cubillos J, Ye XY, Perlas A. Anesthesiologists’
examination. Anesth Analg. 2013;116(2):357-363. doi:10.1213/ learning curves for bedside qualitative ultrasound assessment of
ANE.0b013e318274fc19 gastric content: a cohort study. Can J Anaesth. 2013;60(8):771-779.
11. Bouvet L, Mazoit J-X, Chassard D, Allaouchiche B, Boselli E, Ben- doi:10.1007/s12630-013-9974-y
hamou D. Clinical assessment of the ultrasonographic measure- 27. Arzola C, Cubillos J, Perlas A, Downey K, Carvolho JC. Interrater reli-
ment of antral area for estimating preoperative gastric content ability of qualitative ultrasound assessment of gastric content in the
and volume. Anesthesiology. 2011;114(5):1086-1092. doi:10.1097/ third trimester of pregnancy. Br J Anaesth. 2014;113(6):1018-1023.
ALN.0b013e31820dee48 doi:10.1093/bja/aeu257
12. Bouvet L, Miquel A, Chassard D, Boselli E, Allaouchiche B, Benhamou 28. Van de Putte P, Vernieuwe L, Jerjir A, Verschueren L, Tacken M,
D. Could a single standardized ultrasonographic measurement of Perlas A. When fasted is not empty: a retrospective cohort study of
antral area be of interest for assessing gastric contents? A preliminary gastric content in fasted surgical patients. BJA.2017;118(3):363-371.
report. Eur J Anaesthesiol. 2009:26(12):1015-1019. doi:10.1097/ doi:10.1093/bja/aew435
EJA.0b013e32833161fd 29. Edelman SK. B-Mode. Understanding Ultrasound Physics. 4th ed. Tops
13. Perlas A, Davis L, Khan M, Mitsakakis N, Chan VW. Gastric sonography Printing Inc; 2012:161.
in the fasted surgical patient: a prospective descriptive study. Anesth 30. Duffy ME, Munro BH, Jacobsen BS. Key principles of statistical infer-
Analg. 2011;113(1):93-97. doi:10.1213/ANE.0b013e31821b98c0 ence. In: Munro BH, ed. Statistical Methods for Health Care Research.
14. Kaydu A, Gokcek E. Preoperative assessment of ultrasonographic 5th ed. Lippincott Williams & Wilkins; 2005:73-105.
measurement of antral area for gastric content. Med Sci Monit. 31. Van de Putte P, Perlas A. Gastric sonography in the severely obese
2018;24:5542-5548. doi:10.12659/MSM.908520 surgical patient: a feasibility study. Anesth Analg. 2014;119(5):1105-
15. Bisinotto FM, Pansani P, da Silveira LA, et al. Qualitative and quan- 1110. doi:10.1213/ANE.0000000000000373
titative ultrasound assessment of gastric content. Rev Assoc Med Bras. 32. Brahee DD, Ogedegbe C, Hassler C, et al. Body mass index and abdom-
2017;63(2):134-141. doi:10.1590/1806-9282.63.02.134 inal ultrasound image quality: a pilot survey of sonographers. J Diagn
16. Gagey A-C, de Queiroz Siqueira M, Monard C, et al. The effect of Med Sonography. 2013;29(2):66-72. doi:10.1177/8756479313476919
pre-operative gastric ultrasound examination on the choice of general 33. Fujifilm SonoSite Inc. SonoSite. Accessed October 9, 2019. https://
anaesthetic induction technique for non-elective paediatric sur- www.sonosite.com/products/sonosite-sii
gery. A prospective cohort study. Anaesthesia. 2018;73(3):304-312.
doi:10.1111/anae.14179
17. Mackenzie DC, Azad AM, Noble VE, Liteplo AS. Test performance AUTHORS
of point-of-care ultrasound for gastric content. Am J Emerg Med. Eric J. Johnson, DNAP, CRNA, is a staff CRNA at Associated Anesthesiolo-
2019;37(1):123-126. doi:10.1016/j.ajem.2018.10.045 gists, P.C., in Lincoln, Nebraska.
18. Ryan-Wenger NA. Evaluation of measurement precision, accuracy, Julie Morbach, MA, RDMS, RVT, RT(R), is an assistant professor and
and error in biophysical data for clinical research and practice. In: program director of diagnostic medical sonography at Bryan College of
Waltz CF, Strickland OL, Lenz ER, eds. Measurement in Nursing and Health Sciences, Department of Health Professions, Lincoln, Nebraska.
Health Research. 4th ed. Springer Publishing Co; 2010:371-383. Cindy Blake, MEd, RDMS, RVT, is an assistant professor and clinical
19. Philips Epiq 5 ultrasound system for vascular. Philips. Accessed coordinator of diagnostic medical sonography at Bryan College of Health
November 12, 2020. https://www.usa.philips.com/healthcare/ Sciences, Department of Health Professions.
product/HC795204V/epiq-5-ultrasound-system-for-vascular/ Shannon Pecka, PhD, CRNA, is an associate professor and assistant pro-
overview[AU: Is this the machine that you used?] gram director at Bryan College of Health Sciences, School of Nurse Anesthesia.
20. Studycast system and CoreArchive Image Storage. Core Sound Imaging.
Accessed September 27, 2019. https://www.corestudycast.com
21. IBM SPSS software. IBM Corp; 2019. Accessed November 20, 2019. DISCLOSURES
https://www.ibm.com/analytics/spss-statistics-software The authors have declared no financial relationship with any commercial
entity to the context of this article. The authors did not discuss off-label
22. Centers for Disease Control and Prevention. Assessing your weight. use within the article.
Accessed October 8, 2019. https://www.cdc.gov/healthyweight/
assessing/index.html
23. American Society of Anesthesiologists. Practice guidelines for pre- ACKNOWLEDGMENTS
operative fasting and the use of pharmacologic agents to reduce The authors would like to acknowledge Michelle Johnson, PhD, RN, for
the risk of pulmonary aspiration: application to healthy patients her assistance with this study, including obtaining consent and random-
undergoing elective procedures: an updated report by the Ameri- ization of participants.
16 AANA Journal February 2021 Vol. 89, No. 1 www.aana.com/aanajournalonlineYou can also read