Franklin D. Roosevelt - "The nation that destroys it's soil, destroys itself."
←
→
Page content transcription
If your browser does not render page correctly, please read the page content below
USDA is an equal opportunity provider and employer.
C.Chavez 2012

        “The nation that destroys it’s soil, destroys itself.”

                                                - Franklin D. Roosevelt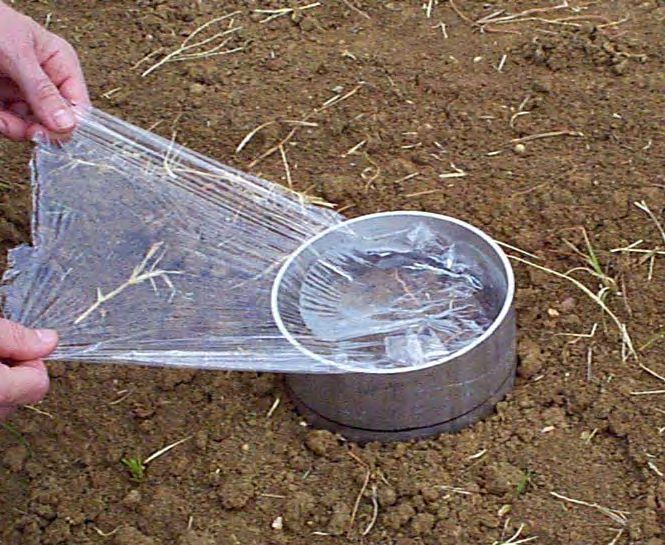
What tests are in the kit guide?

Measuring soil quality-provides guidelines for sampling and site characterization.

Soil respiration-measured using an aluminum cylinder that is 6 inches in diameter and 5 inches
long. The cylinder is capped and accumulated carbon dioxide respired by soil organisms and
plant roots is measured. Respiration provides a measure of biological activity, which is related to
nutrient cycling and breakdown of pollutants in the soil.

Infiltration-measured using the same cylinder as in the soil respiration test. Infiltration is
important to reducing runoff and storing water in the soil for plant growth.

Bulk density-measured by inserting a 3-inch-diameter cylinder 3 inches into the soil surface and
removing the intact soil. Bulk density is related to root growth, biological activity, and
movement of water and air in the soil.

Electrical conductivity (EC)-measured with a pocket EC meter. It provides a measure of
salinity (excess salts) in the soil.

Soil pH-measured with a pocket pH meter. It relates to nutrient availability and plant growth.

Soil nitrate-measured by dipping nitrate test strips into the solution filtered from a 1:1 ratio
soil/water mixture. Soil nitrate levels are important for plant growth and water quality.

Aggregate stability-determined by sieving soil in water and measuring the amount of aggregates
greater than 0.25 mm in diameter that remain on the sieve. Aggregation is important in
decreasing erosion, increasing water and air movement, and preserving organic matter in the soil.

Soil slaking-determined by putting soil fragments or aggregates in water and estimating the
degree of slaking. Slaking is important to reducing erosion and development of surface crusts.

                                                  2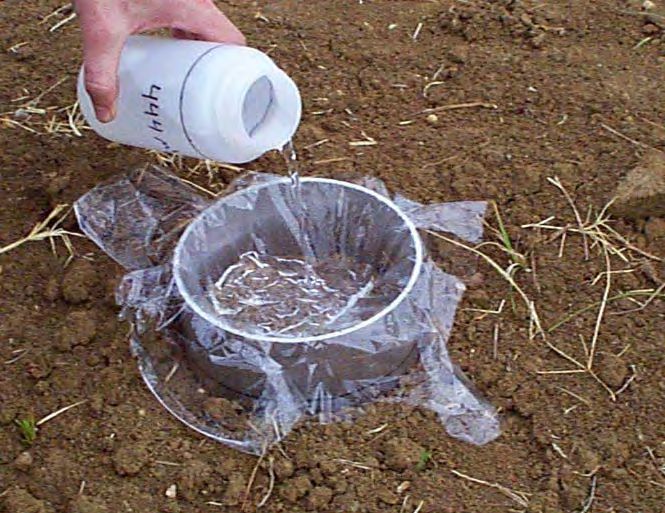
Earthworms-determined by counting the number of earthworms found in a square-foot hole.
They are important in nutrient cycling and creating large pores for water and air movement in the
soil.

Soil physical observations and estimations-shows how to observe soil structure and root
patterns and to estimate topsoil depth, penetration resistance, and soil texture in the soil profile.

These properties are important to the physical environment for plant growth.

Water quality tests: (estimates salinity, nitrate and nitrite levels in water).

Electrical conductivity (EC)-measured with a pocket EC meter. It provides a measure of
salinity (excess salts) in the water.

Soil pH-measured with a pocket pH meter. It relates to nutrient availability and plant growth.

Soil nitrate-measured by dipping nitrate test strips into the solution filtered from a 1:1 ratio
soil/water mixture. Soil nitrate levels are important for plant growth and water quality.

                                                   3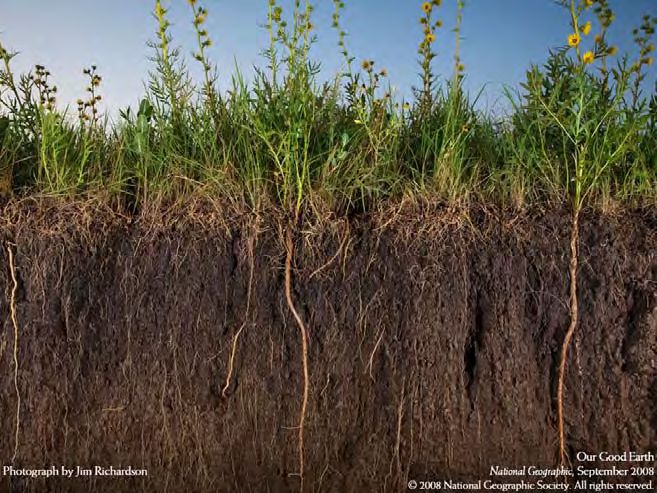
Soil Respiration Test:
Full Description of the procedure is at: http://soils.usda.gov/sqi/assessment/files/chpt2.pdf
Simplified version of procedure:
1: Drive Ring into Soil.
Make sure that the soil has been wet for at least 6 to 24 hours.
2: Cover the Ring with plastic lid and wait for 30 minutes to allow CO2 to accumulate in the ring.
3. Connect all parts of the Draeger Tube Apparatus.
Connect the needle to one of the section of plastic tubing.
On the other end of the same tubing connect the Draeger tub (remember to break open both ends of the
Draeger tube before connecting and note that the arrow on the tube points away from the needle).
Connect the second piece of plastic tubing to the other end of the Draeger tub.
Connect the syringe to the end of the plastic tubing.
4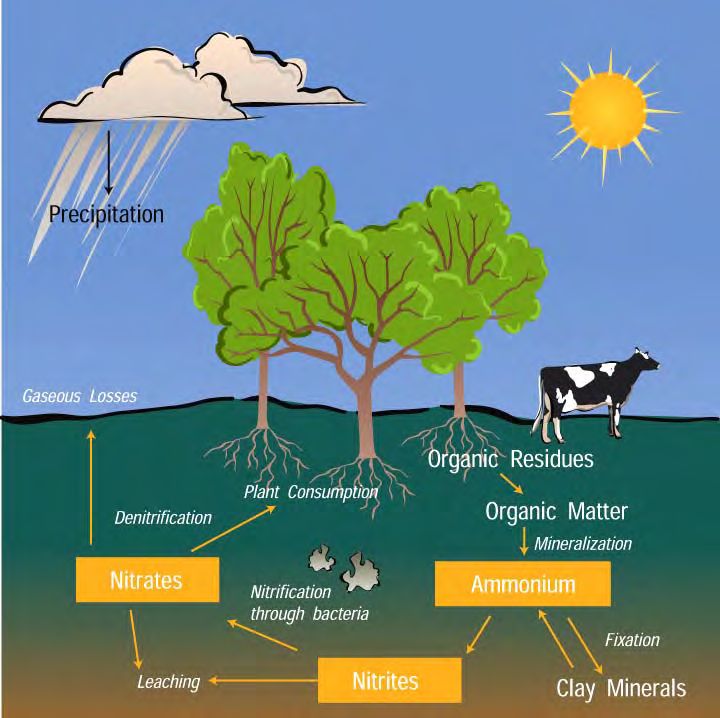
4. Insert the needle on the end of the syringe apparatus in to the stopper on one of the plastic lid on the ring
after the 30 minute wait.
Insert another needle at the other end of the stopper on the plastic lid on the ring. This will create air flow
when the syringe is drawn.
5. Start drawing the syringe at a rate of 100cc over a 15 second span.
6. Record the soil Temperature and the percent of CO2.
7. Enter the reading from the Draeger tube apparatus on the data worksheet.
8. Run the Soil Respiration Calculations.
(lb CO2-C/acre/day) = PF x TF x (%CO2 - 0.035) x 22.91 x H
PF = pressure factor = 1
TF = temperature factor = (soil temperature in Celsius + 273) ÷ 273
H = inside height of ring = 5.08 cm (2 inches)
5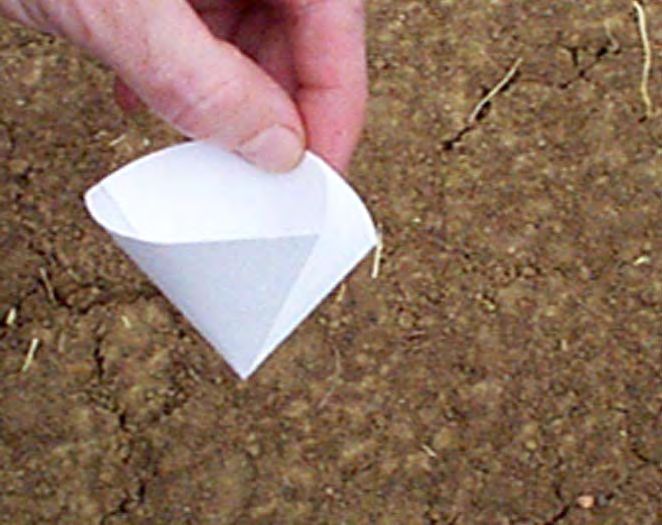
Soil respiration (lbs CO2-C/a/d)
Class Soil condition:
0.0 - No soil activity Soil has no biological activity and is virtually sterile.
< 9.5 - Very low soil activity
Soil is very depleted of available organic matter and has
little biological activity.
9.5 – 16 - Moderately low soil activity
Soil is somewhat depleted of available organic matter,
and biological activity is low.
16 – 32 - Medium soil activity
Soil is approaching or declining from an ideal state of
biological activity.
32 – 64 - Ideal soil activity
Soil is in an ideal state of biological activity and has
adequate organic matter and active populations of
microorganisms.
> 64 - Unusually high soil activity
Soil has a very high level of microbial activity and has
high levels of available organic matter, possibly from the
addition of large quantities of fresh organic matter or manure.
Conversion of Woods End Solvita respiration levels: (mg CO2/kg/wk) x 0.039 x (1.2 g/cm3) x
(7.6 cm depth) ÷ 10 x 0.89 = (lbs CO2-C/acre/day). It was assumed all respiration was
coming from a 7.6 cm depth with an average bulk density of 1.2 g/cm3 (Doran et al., 1997).
((0.5 X 0.39 X1.2 X7.6) / 10) X 0.89 = 0.015
Why do this test:
Soil Respiration:
Is the production of carbon dioxide (CO2) as a result of biological activity in the soil
by microorganisms, live roots, earthworms, nematodes, and insects.
Tillage or cultivation can result in loss of soil carbon (C) and increases in the amount of
CO2 released.
Biological activity is a direct reflection of the breakdown of organic matter in the soil.
The breaking down of organic matter indicates two process:
(1) loss of soil carbon and
(2) turn over of nutrients.
Use cover crops. Cover crops help control erosion as well as improve soil tilth,
increases organic matter levels, enhances water infiltration and lessens pest
problems.
Use of cover crops and Organic Matter reduces the temperature of soil by 15
degrees, which increases the microbial activity.
Soil moisture is very important - a dry soil has low or no microbial activity.
6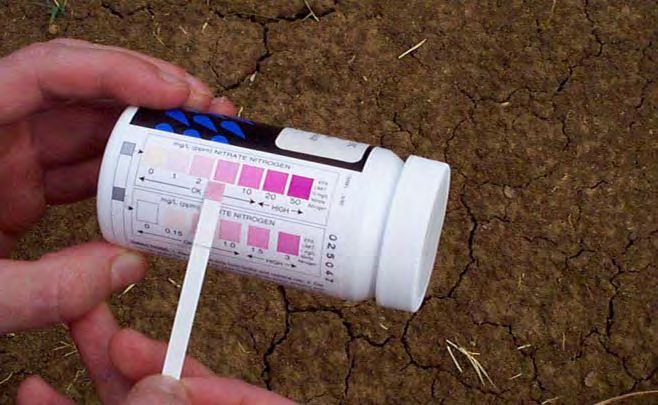
Infiltration Test:
Full Description of the procedure is at: http://soils.usda.gov/sqi/assessment/files/chpt3.pdf
Simplified version of procedure:
1. Firm the Soil along the inside edges of the 6 inch ring used in the respiration test.
2. Line the inside of the ring with plastic wrap.
3. Pour 444 mL of distilled water (15 oz or 1 inch of water).
4. Remove the plastic wrap (slowly) and record the time.
Record the amount of time (in minutes) it takes for the 1" of water to infiltrate the soil.
Stop timing when the surface is just glistening.
7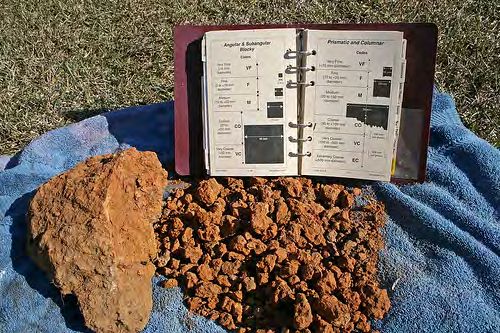
5. If the soil was not at field capacity it is recommended to repeat the infiltration test.
In the same ring, perform Steps 2, 3, & 4 with a second inch of water.
On the Soil Data worksheet, enter the number of minutes elapsed for the second infiltration
measurement.
Note: a second respiration measurement will be performed, set the lid loosely on the ring and
leave it covered for preferably 16 to 24 hours (6-hour minimum) before beginning the
second test (Chapter 2). (Remove lid and replace it before beginning the second soil respiration
measurement).
Why do this test:
Infiltration Test
Tillage will affect the infiltration rate temporarily. Immediately after tillage, higher
infiltration may occur due to the loosening of surface crusts or compacted areas. The soil
will revert back to a poor soil with poor intake rate and bulk density.
Tillage fluffs up the soil. However, tillage further disrupts aggregates and soil structure,
creating the potential for compaction, surface crusting, and loss of continuous surface
connected pores.
Compacted soils will have less pore space, resulting in lower infiltration rates. Soils that
tend to form surface crusts, which seal the soil surface, can have severely reduced
infiltration rates.
It is affected by the development of plant roots, earthworm burrows, soil aggregation, and
by overall increases in stable organic matter (Sarrantonio et al., 1996).
Texture or the percentage of sand, silt, and clay will affect the infiltration rate.
Benefits to having high Organic Carbon: They include rapid decomposition of crop
residues, granulation of soil into water-stable aggregates, decreased crusting and
clouding, improved internal drainage, better water infiltration, and increased water
and nutrient holding capacity.
Improvements in the soil's physical structure facilitate easier minimal tillage,
increased water storage capacity, reduced erosion, better formation and harvesting
of root crops, higher intake value and deeper, more prolific plant root systems.
Irrigation of a field should be done when an intake value is known and an effective
Irrigation water management plan is followed.
If the field develops soil structure or aggregates with an increase of active carbon,
the intake value will increase.
8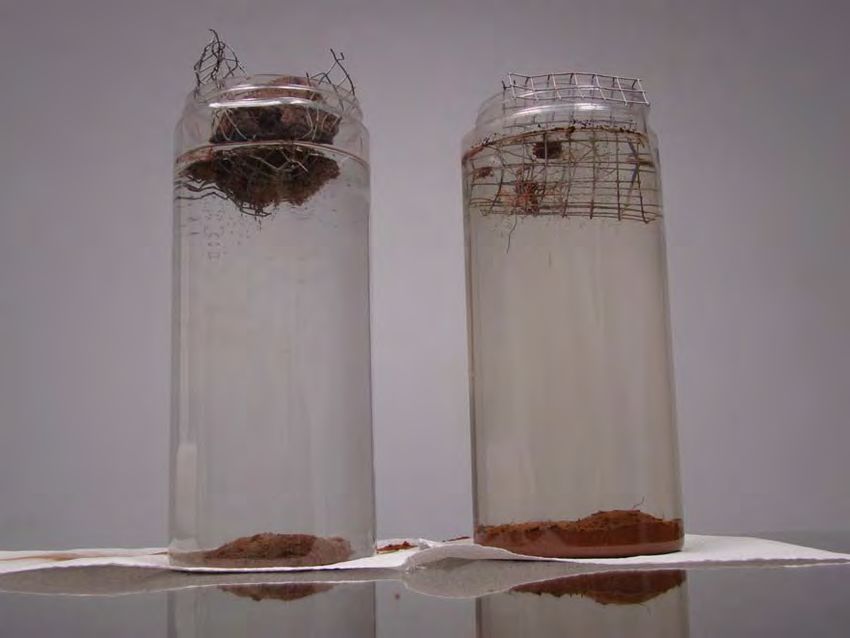
Bulk Density Test: (due to time this test was not run)
Full Description of the procedure is at: http://soils.usda.gov/sqi/assessment/files/chpt4.pdf
Simplified version of procedure:
1. Drive Ring into Soil
Using the hand sledge and block of wood, drive the 3-inch diameter ring, beveled edge down, to a
depth of 3 inches .
The exact depth of the ring must be determined for accurate measurement of soil volume. To do
this, the height of the ring above the soil should be measured. Take four measurements (evenly
spaced) of the height from the soil surface to the top of the ring and calculate the average. Record
the average on the Soil Data worksheet.
2. Dig around the ring.
3. With the trowel underneath it, carefully lift it out to prevent any loss of soil.
4. Remove excess soil from the sample with a flat bladed knife.
5. The bottom of the sample should be flat
6. and even with the edges of the ring
Note: the remainder of the procedure should be done in a lab or office or home.
7. Weigh the soil sample in its bag.
8. Extract Subsample to Determine Water Content and Dry Soil Weight.
Take a 1/8-cup level scoop subsample of loose soil (not packed down) from the plastic
Bag and place it in a paper cup (a glass or ceramic cup may be used).
9. Weigh and Record Subsample in its cup. (also weigh the cup w/o subsample) and record.
9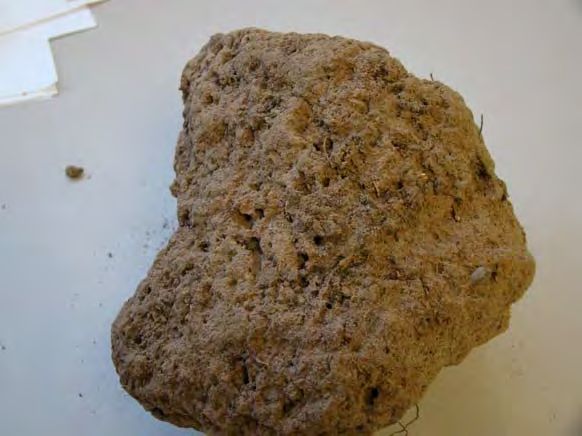
10. Dry the subsample in a microwave.
Two or more, four minute cycles at full power.
When its weight does not change after a drying cycle, then it is dry.
11. Calculations (see page 13) in the soil quality test kit guide.
12. special note:
Soil texture Ideal bulk densities Bulk densities that may Bulk densities that
affect root growth restrict root growth
(g/cm3) (g/cm3) (g/cm3)
sands, loamy sands < 1.60 1.69 > 1.80
sandy loams, loams < 1.40 1.63 > 1.80
sandy clay loams, < 1.40 1.60 > 1.75
loams, clay loams
silts, silt loams < 1.30 1.60 > 1.75
silt loams, < 1.40 1.55 > 1.65
silty clay loams
sandy clays, silty < 1.10 1.49 > 1.58
clays, < 1.10 1.39 > 1.47
some clay loams
(35-45% clay)
clays (> 45% clay)
Soil bulk density can serve as an indicator of compaction and relative restrictions to root growth
Note: soils with rock fragments have their own procedure.
Why do this test:
Bulk Density Test:
Is the measurement of particles and the pore space between the particles.
Soil bulk density can serve as an indicator of compaction and relative restrictions to root
growth
Bulk Density can be altered by cultivation; trampling by animals; agricultural machinery;
and weather (raindrop impact).
Minimize number and weight of field operations. We all know that working soil too
wet is detrimental. It should be avoided at all costs. However, soil with good
structure and an extensive network of roots will be resilient to compaction.
The bulk density of water is 1 gr/ml. Soils are denser than water.
10Electrical conductivity, pH, and soil nitrate are all measured from the same soil subsample
Photo of an EC pocket meter.
Photo of an pH pocket meter.
Basic pH / EC pocket meter maintenance:
1. Calibrate pocket meter before your first use.
2. Do not immerse above the immersion level
3. When not in use, switch off the meter and replace protective cap.
4. Clean electrodes periodically with alcohol for a few minutes.
5. Replace all four batteries if the display becomes faint.
6. After each use, rinse the electrode with water to minimize contamination.
7. Always store the pocket meter, clean and dry.
8. Keep all EC and pH electrodes clean when in storage.
11Electrical Conductivity Test
Full Description of the procedure is at: http://soils.usda.gov/sqi/assessment/files/chpt5.pdf
Simplified version of procedure:
1. Collect a 1/8 cup of the soil surface.
Place it in the plastic container.
2. Add 1/8 cup of distilled water to the plastic container.
Put the lid on the container and shake vigorously about 30 to 45 seconds.
3. Insert the EC pocket meter into the soil-water mixture. (See Calibration Tip).
Take the reading while the soil particles are still suspended in solution
Do not immerse the meter above the immersion level.
Allow the reading to stabilize.
4. Turn the meter off and thoroughly rinse the meter with distilled water.
Save the soil-water mixture for the pH measurement
Note: this test can also be done on irrigation water samples.
Electrical
Conductivity
(dS m-1 at 25 C) Salinity class Crop response Microbial response
0 - 0.98 Non saline Almost negligible Few organisms affected
effects
0.98 - 1.71 Very slightly saline Yields of very sensitive Selected microbial processes
crops restricted altered (nitrification/de-nitrification)
1.71 - 3.16 Slightly saline Yields of most crops Major microbial processes
Restricted influenced (respiration/ ammonification)
3.16 - 6.07 Moderately saline Only tolerant crops Salt tolerant microorganisms
yield satisfactorily predominate (fungi,
actinomycetes, some bacteria)
> 6.07 Strongly saline Only very tolerant crops A select few halophytic
yield satisfactorily organisms are active
12Why do this test:
Electrical Conductivity (EC):
Excess salts will hinder plant growth by affecting the soil-water balance. The salts
associated with soil salinity are: As a result of these charges, positively charged ions
(cations) such as hydrogen H+, potassium K+, ammonium NH+4, calcium Ca2+,
magnesium Mg2+, aluminum Al3+, etc. NOTE: the test does not tell you what kid of
salts only that there is salts. Important soil anions include bicarbonate (HCO3-),
chloride (Cl-), carbonate (CO3=), nitrate (NO3-), orthophosphate (H2PO4-), and
sulfate (SO4=).
Site specific interpretations for soil quality will depend on specific land use and crop
tolerance. Moderate to high EC will indicate a reduction of crop production, reduction in
microbial responses and reduction of soil quality.
Timing and amount of watering can help in the management of salty soils. The soil
crop salt tolerance table must be used.
Need to have a soil and water test to determine types of salts.
13Soil pH Test
Full Description of the procedure is at: http://soils.usda.gov/sqi/assessment/files/chpt6.pdf
Simplified version of procedure:
1 Collect a 1/8 cup of the soil surface.
Place it in the plastic container.
2 Add 1/8 cup of distilled water to the plastic container.
Put the lid on the container and shake vigorously about 30 to 45 seconds.
3. Insert the pH pocket meter into the soil-water mixture, (See Calibration Tip).
Take the reading while the soil particles are still suspended in solution
Do not immerse the meter above the immersion level.
Allow the reading to stabilize.
5. Turn the meter off and thoroughly rinse the meter with
Note: this test can also be done on irrigation water samples.
14Why do this test:
Soil pH.
Nutrient availability is affected by changes in the solubility of soil minerals.
Most minerals are more soluble in a slightly acid soils than in neutral or slightly basic
soils.
The greatest availability for most nutrients is between pH 6 and 7. Macronutrients are
made more available to the plant in this pH range.
Soil pH also affects the activity of beneficial microorganisms, which affects nutrient
availability.
In general, fungi function at a wide pH range, but bacteria and actinomycetes function
better at intermediate and higher pH.
Visual inspection of the crops, grasses, trees etc., for leaf burn, chlorosis, Uniform
chlorosis, Plants are stunted, unusual coloring to name a few.
Soils that contain 0.5% to 30% CaCo3 are buffered soils and have pH above 7. If elemental sulfur
or sulfuric acid is applied to the field, you must have calcium carbonate (CaCo3).
15Soil Nitrate Test (NO3-)
Use the same sample prepared for the EC and pH tests to measure soil nitrates. If you are starting with a fresh soil
sample, read the introduction and follow Steps 1-3 in the EC Test Chapter on preparing the sample.
Full Description of the procedure is at: http://soils.usda.gov/sqi/assessment/files/chpt7.pdf
Simplified version of procedure:
1. Fold the filter paper in half (into a cone).
2. Open the filter paper into the shape of a cone and push it quickly into the jar with the soil/water mixture.
3. Wait until about an eye dropper full of the solution has seeped through to the inside of the filter paper.
164. Using the eye dropper and on nitrate/nitrite test strip, place 1 or 2 drops of the filtered solution on each of
the strips two pads. Note the time.
5. Record the time, after 60 seconds read the nitrate/nitrite test strip.
Estimate the nitrate amount according to the degree of color change.
Enter the value from the nitrate scale on the Soil Data worksheet in ppm
6. Using the value in ppm in the for Calculation (page 17 of the guide book).
Estimated (lb NO3-N/acre) =
(ppm extract NO3-N) x (depth of soil sampled in cm) x bulk density x 0.89
10
Note: this test can also be done on irrigation water samples.
Generalized soil nitrogen cycle:
17Why do this test:
Soil Nitrate (NO3).
Organic nitrogen (organic matter, crop residue, Ammonia and manure) is converted
by microorganisms to nitrate that is taken up used by plants and other
microorganisms.
If nitrate is not used by the crop then it can easily be moved out of the root zone in to the
ground water or into surface waters through leaching and become an environmental
liability.
Tillage or cultivation can result in loss of ammonia gas to the air.
Nitrogen loss from the soil system is greatly affected by soil type and climate.
Sandy soils may lose Nitrogen through leaching while on heavy, poorly drained,
anaerobic soils. It may be lost through a conversion by microorganisms into a gas.
Proper fertilizer use. Use fertilizers that enhance the soil. A good approach is to feed
the soil, rather than feed the plant. A good soil will grow healthy crops. Don't over
do it with fertility amendments as that is a waste and can be a pollutant.
This test does not replace the lab test but it is a basic test after the soil and tissues
tests are run.
18Aggregate Stability
Full Description of the procedure is at: http://soils.usda.gov/sqi/assessment/files/chpt7.pdf
Simplified version of procedure:
Considerations: If the soil is moist, air-dry a sample before determining aggregate stability.
When taking a soil sample, care should taken not to disrupt the soil aggregates.
1. Sieve an air dry soil sample.
Put about ¼ cup of soil in a 2mm sieve and shake
collecting the soil that is passing through.
Try and pass all of the soil particles. (no rock fragments).
2. weigh the sieved soil sample.
Record the weight on the worksheet
3. Weigh out 10 grams of the soil from the previous step.
Place the soil sample in the .25mm sieve.
Lay a terry cloth sheet with distilled water
Slow the soil to wet up slowly, wet the soil for five minutes.
4. Using the lid to the plastic container, place the sieve’s with soil in to it.
Add distilled water to just above the soil sample.
Slowly move the sieve up and down in the water
Make sure the aggregates remain immersed in water on the upstroke.
After wetting, place the sieves on a dry terry cloth.
196. Place the sieve containing the aggregates on the drying apparatus
Allow the samples to dry using the low power setting.
Be careful when drying the soil to prevent particles from blowing out of the sieve.
7. After drying, weigh the sieve containing the aggregates.
Weight of the sieve and aggregates / recode the weight.
8. Prepare the calgon solution
Calgon solution: put about 2 tbsp of calgon per 1/2 gallon of tap water. (Or about 1/2 tbsp of
calgon per 1 quart of tap water).
Let the aggregates in the sieve to soak for five minutes,
Moving the sieve up and down.
Only the sand particles should remain in the sieve.
9. Remove the excess water by first placing the sieve with the sand on a dry terry cloth.
Allow the sand to dry.
After drying, weigh the sieve containing the sand.
Record the weight of the sieve plus sand on the worksheet.
10. Complete the water stable aggregate calculations.
Table 8:
Organic Matter Water Stable Clay Water Stable
(%) Aggregates (%) (%) Aggregates (%)
0.4 53 5 60
0.8 66 10 65
1.2 70 20 70
2 75 30 74
4 77 40 78
8 81 60 82
12 85 80 86
For example:
for a soil with 2% organic matter and 10% clay, the suitable aggregate stability range (taken from
Table 8) would be 65 to 75% water stable aggregates.
20Why do this test:
Aggregate Stability test:
Upon rapid wetting, capillary water entering the pores causes air entrapped inside the
aggregate pores to increase in pressure causing them to rupture.
Soil aggregates protect organic matter within their structure from microbial attack.
Formation and preservation of aggregates allows organic matter to be preserved in the
soil.
Minimize tillage. Tillage operations that pulverize soil aggregates are the most
damaging. Secondary tillage is often harder on the soil than primary tillage. Tillage
systems that maximize surface residues are preferred. Use tillage sparingly to solve
specific soil problems.
Major practices – cover crops, no till, crop rotation, mulching, composting,
21Slake Test
Full Description of the procedure is at: http://soils.usda.gov/sqi/assessment/files/chpt9.pdf
Simplified version of procedure:
Considerations: The soil should be Air-Dry when running this test.
1. Carefully remove soil fragments or aggregates (little clods or ped) from the surface.
If there is a surface crust, carefully sample it.
Be careful not to shatter the soil fragments or ped’s while sampling.
Collect 16 separate soil fragments/peds/clods.
2. Remove the baskets from the stability kit and set aside.
Fill the compartments in the box with water.
The water should be 2 cm deep
The temperature of water should be the same as the soil temperature.
3. Place soil fragments in the basket one at a time.
Lower one of the sieves into the box compartment filled with water.
Notice the soil fragment for five minutes.
After five minutes, raise the basket out of the water.
Then lower it back in to the bottom of the box compartment filled with water.
Repeat immersion four times (total of five immersions).
Refer to the stability class table below to determine classes…
Stability class Criteria for assignment to stability class (for “Standard Characterization”)
0 - Soil too unstable to sample (falls through sieve).
1 - 50 % of structural integrity lost within 5 seconds of insertion in water.
2 - 50 % of structural integrity lost 5 - 30 seconds after insertion.
3 - 50 % of structural integrity lost 30 - 300 seconds after insertion or < 10 % of
soil remains on the sieve after 5 dipping cycles.
4 - 10 - 25% of soil remaining on sieve after 5 dipping cycles.
5 - 25 - 75% of soil remaining on sieve after 5 dipping cycles.
6 - 75 - 100% of soil remaining on sieve after 5 dipping cycles.
22Why do this test:
Slake Test,
Slaking indicates the stability of soil aggregates, resistance to erosion.
Slaking also suggests how well soil can maintain its structure to provide water and air for
plants and soil microorganisms when it is rapidly wetted.
Conservation tillage systems, such as no-till, reduce slaking by reducing soil disturbing
activities that break aggregates apart and accelerate decomposition of organic matter.
No-till and residue management lead to increased soil organic matter and improved
aggregate stability and soil structure, particularly when cover crops or sod-based
rotations provide an additional source of residue.
Minimize erosion. Erosion takes away your very best soil! It's your surface soil that has
the highest fertility that goes "down the drain", during a rainstorm. If you farm land that
is susceptible to erosion, controlling it should be your top priority. Soil erosion is the
most detrimental aspect of agriculture. We can't turn our backs on soil erosion and call
ourselves sustainable!
Major practices – cover crops, no-tillage, crop rotation, mulching, composting,
minimum tillage.
23Earthworms
Full Description of the procedure is at: http://soils.usda.gov/sqi/assessment/files/chpt10.pdf
Simplified version of procedure:
Considerations: When examining the soil for earthworms, avoid places where their populations
might be affected, such as near mulch or compost piles. The abundance of earthworms is usually
patchy within a field and varies with season. Therefore, count earthworms several times during a
season and use the average to gauge changes from year to year.
1. Dig a soil pit, about 12 inches wide, 12 inches long and 12 inches deep.
Try to minimize the number of cuts with the shovel to avoid damage to the earthworms.
Pile the soil to one side of the hole/pit.
2. Separate and count the number of earthworms.
Record the total number of earthworms (those found in the hole).
You could also use a mustard solution to flush out any additional earthworms
Mustard solution ( 2 tbs., of mustard powder in ½ gallon of tap water).
If you use the mustard solution, you should rinse the earthworms in water before returning them to
the soil.
Note: About 10 earthworms per square foot of soil are generally considered a good population. Populations
generally do not exceed 20 per square foot of soil generally.
Note: the action of microorganisms (breaking down plant and animal residues and creating soil
organic matter and humus as a binding material).
24Why do this test:
Earthworm Test,
Earthworms are most active during the spring and fall, which are the best times to
observe their activity.
Earthworms dramatically alter soil structure, water movement, nutrient dynamics,
and plant growth.
Earthworms get their nutrition from microorganism and organic matter. As it passes
through the earthworm and get broken down in the intestine. The nutrients held by the
organic matter and microorganisms are then released into a form that plants could use.
At the same time the earthworms mix and create aggregates. Earthworms can turn over
the top six inches of soil in ten to twenty years.
Earthworms increase porosity and drainage as they move through the soil.
Earthworms will increase the Available Water Holding Capacity by increasing soil
porosity and aggregation.
Earthworms also create channels for root growth and also carry plant residue or organic
matter further down into the soil.
Minimize use of pesticides. Some pesticides are slightly toxic to non- target soil
organisms. Dyfonate, Counter, and Thimet can affect earthworms. Triazines also
have a negative affect on the worms.
Practice crop rotation. Grow crops that have different rooting action and residue
production. This helps in providing a habitat for diverse soil organisms.
Major practices – cover crops, no till, crop rotation, mulching, composting,
minimum till.
Notice: this is the same Sandy Loam soil that was used in this mornings slake test.
25Soil Physical Observations and Estimations.
Full Description of the procedure is at: http://soils.usda.gov/sqi/assessment/files/chpt11.pdf
Simplified version of procedure:
1. Dig a hole about 1 foot deep and 1 foot wide.
2. Measure the depth of the topsoil. Look for color changes from the soil surface downward
through the soil pit face.
Record the darker surface layer.
3. Take a look at the roots in the hole.
The roots should be well branched with lots of fine root hairs.
Look for restrictive layers, the roots will tell you.
4. Feel for restrictive layers, with metal rod.
Feel for the resistance as you push the rod into the soil.
26A penetrometer can also be used, it measures PSI.
5. Look at the soil structure and measure in the different layers. Soil structure
affects the retention and transmission of water and air in the soil as well as the mechanical
properties of the soil. Observing and describing soil structure in the field is subjective and
qualitative.
Record the type, size and grade of the structural aggregates for each layer.
Type: Granular, Blocky, Platy, Single grain, or Massive.
Size: Platy or Blocky - Fine, medium or thick.
Soil processes involved in the development of soil structure are as follows (Rowell, 1994):
· drying and wetting, which cause shrinking and swelling, creating cracks and channels;
· freezing and thawing, which creates spaces as ice is formed;
· The action of roots (removal of water, release of exudates (organic materials), and formation
of root channels);
· The action of soil animals (moving soil material around, creating burrows, and bringing soil
Figure 4. General position of soil compaction zones in cultivated systems (Bennie, 1996)
CULTIVATED LAYER (9 inches) Zone 1 through 4:
Zone 1: Surface crusting, which may impede seedling emergence
and water infiltration.
Zone 2: Low impedance zone for roots; loosened by tillage.
Zone 3: Plowed or deeply loosened cultivated soil that has been re-
compacted by vehicular traffic.
LOWEST LAYER OF THE PROWLAYER (10 TO 14 inches)
ZONE 4
Zone 4: Subsoil compaction by wheel traffic and tillage implement-
soil interactions during tillage.
SUBSOIL LAYER (15 inches plus) ZONE 5
Zone 5: May contain high mechanical impedance due to inherent
actors, such as duripans, fragipans, ortstein layers, petrocalcic layers
etc. which may occur near the surface if topsoil is not present.
Penetration resistance depends strongly on the soil water content: the dryer the soil, the greater
27the resistance to penetration. Therefore, the water content of the soil should be noted when
taking
a measurement. Penetration resistance is best determined when the soil is at field capacity, which
is a uniform condition that can be reproduced from season to season.
6. Texture can be determined by feel. Place approximately ¼ cup of soil in palm. Add water
drop wise and knead the soil to break down all aggregates. Soil is at the proper consistency when
plastic and moldable, like moist putty.
Sand - feels gritty. - 2.0 mm (very coarse) to .05 mm (very fine);
Silt - feels smooth like baby powder or foot powder. - .05 mm to .002 mm;
Clay – feels sticky. - Smaller than .002 mm.
Twelve Soil Textural Classes. Definitions of the 12 textural classes are based on the relative
proportion, or weight, of these three particle classifications. Sandy soil, for example, has a
greater
proportion of sand particles than silt or clay. In reading the textural triangle (Figure 5), any two
particle size percentages will locate the textural class. For example, a soil containing 20% clay
and 40% sand is located in the loam textural class (Figure 5).
Soil Texture Triangle.
28Review of why we do these tests:
291. Soil Respiration:
Is the production of carbon dioxide (CO2) as a result of biological activity in the soil
by microorganisms, live roots (rhizosphere.), earthworms, nematodes, and insects.
Tillage or cultivation can result in loss of soil carbon (C) and increases in the
amount of CO2 released, to the atmosphere. (Therefore use minimum till or No-till,
Cover crops, mulching etc…)
Biological activity is a direct reflection of the breakdown of organic matter in the
soil. The breaking down of organic matter indicates two process:
(1) loss of soil carbon and
(2) turn over of nutrients.
Use cover crops. Cover crops help control erosion as well as improve soil tilth, increases
organic matter levels, enhances water infiltration and lessens pest problems.
Use of cover crops and Organic Matter reduces the temperature of soil by 15-20 degrees,
which increases the microbial activity.
Soil moisture is very important - a dry soil has low or no microbial activity also over
irrigating fields is also detrimental to microbial activity (anaerobic)
2. Infiltration Test
Tillage will affect the infiltration rate temporarily. Immediately after tillage, higher
infiltration may occur due to the loosening of surface crusts or compacted areas.
The soil will revert back to a poor soil with poor intake rate and higher bulk
density. (Therefore use minimum till or No-till, Cover crops, mulching etc…)
Compacted soils will have less pore space, resulting in lower infiltration rates. Soils
that tend to form surface crusts, which seal the soil surface, can have severely
reduced infiltration rates.
Soil Quality: good structure, higher active carbon, high microbe activity, crop
residue or cover crop, minimum till or no till - will increase the available water
holding capacity, lower soil temperature, lower ph, increase crop vigor, less disease
SAR and ECiw (Salinity) – Affects the infiltration rate. The higher the soil the salts the
more water you will need to put on the plant. Should use the Soil - Crop Salt Tolerance
table. ECiw X 1.5 = ECe surface irrigation and ECiw X 3 = ECe drip irrigation.
You may need to add 5% or 10% or up to 15% more water for leaching salts.
SAR and ECiw (Salinity and Sodium) are not important in Sandy Soil.
Texture or the percentage of sand, silt, and clay will affect the infiltration rate.
2. Infiltration Test Continued:
30 Tillage fluffs up the soil. However, tillage further disrupts aggregates and soil structure,
creating the potential for compaction, surface crusting, and loss of continuous surface
connected pores.
It is affected by the development of plant roots, earthworm burrows, soil aggregation, and
by overall increases in stable organic matter (Sarrantonio et al., 1996).
Benefits to having high Organic Carbon: They include rapid decomposition of crop
residues, granulation of soil into water-stable aggregates, decreased crusting and
clouding, improved internal drainage, better water infiltration, and increased water and
nutrient holding capacity.
Improvements in the soil's physical structure facilitate easier minimal tillage, increased
water storage capacity, reduced erosion, better formation and harvesting of root crops,
higher intake value and deeper, more prolific plant root systems.
Irrigation of a field should be done when an intake value is known and an effective
Irrigation water management plan is followed.
If the field develops soil structure or aggregates with an increase of active carbon, the
intake value will increase.
3. Bulk Density Test:
Minimize number and weight of field operations. We all know that working soil too
wet is detrimental. It should be avoided at all costs. However, soil with good
structure and an extensive network of roots will be resilient to compaction.
Is the measurement of particles and the pore space between the particles.
Soil bulk density can serve as an indicator of compaction and relative restrictions to root
growth
Bulk Density can be altered by cultivation; trampling by animals; agricultural machinery;
and weather (raindrop impact).
The bulk density of water is 1 gr/ml. Soils are denser than water.
4. Electrical Conductivity (EC):
Excess salts will hinder plant growth by affecting the soil-water balance. The salts
associated with soil salinity are: As a result of these charges, positively
charged ions (cations) such as hydrogen H+, potassium K+,
ammonium NH+4, calcium Ca2+, magnesium Mg2+, aluminum Al3+,
Negitave charged ions (Anions) Cl- chloride, SO4-2 sulfate, CO3-2 etc.
NOTE: the test does not tell you what kid of salts only that there is salts.
You need to take a soil test to determine the type of salts. I affects the soil nutrient
uptake.
314. Electrical Conductivity (EC) Continued:
Site specific interpretations for soil quality will depend on specific land use and crop
tolerance. Moderate to high EC will indicate a reduction of crop production, reduction in
microbial responses and reduction of soil quality.
Timing and amount of watering can help in the management of salty soils. The soil crop
salt tolerance table must be used.
Need to have a soil and water test to determine types of salts.
5. Soil pH.
Nutrient availability is affected by changes in the solubility of soil minerals.
Most minerals are more soluble in a slightly acid soil than in neutral or slightly
basic soils.
Soil pH also affects the activity of beneficial microorganisms, which affects nutrient
availability.
The greatest availability for most nutrients is between pH 6 and 7. Macronutrients are
made more available to the plant in this pH range.
In general, fungi function at a wide pH range, but bacteria and actinomycetes function
better at intermediate and higher pH.
Visual inspection of the crops, grasses, trees etc., for leaf burn, chlorosis, Uniform
chlorosis, Plants are stunted, unusual coloring to name a few.
Soils that contain 0.5% to 30% CaCo3 are buffered soils and have pH above 7. If
elemental sulfur or sulfuric acid is applied to the field, you must have calcium carbonate
(CaCo3).
326. Soil Nitrate (NO3).
This test does not replace the lab test but it is a basic test after the soil and tissues
tests are run.
Organic nitrogen (organic matter, crop residue, Ammonia and manure) is converted
by microorganisms to nitrate that is taken up used by plants and other
microorganisms.
If nitrate is not used by the crop then it can easily be moved out of the root zone in
to the ground water or into surface waters through leaching and become an
environmental liability.
Tillage or cultivation can result in loss of ammonia gas to the air.
Nitrogen loss from the soil system is greatly affected by soil type and climate.
Sandy soils may lose Nitrogen through leaching while on heavy, poorly drained,
anaerobic soils. It may be lost through a conversion by microorganisms into a gas.
Proper fertilizer use. Use fertilizers that enhance the soil. A good approach is to feed
the soil, rather than feed the plant. A good soil will grow healthy crops. Don't over
do it with fertility amendments as that is a waste and can be a pollutant.
7. Aggregate Stability test: To Be Done by Soil Scientist
Major practices – cover crops, no till, crop rotation, mulching, composting, and
other practices preserve the soil structure, CO2 , Active Carbon, soil microbiology
(earthworms, fungi, bacteria, nematodes, etc.), creates larger aggregates, more pore
space, increase available holding capacity, flush out salts a little easer.
Upon rapid wetting, capillary water entering the pores causes air entrapped inside the
aggregate pores to increase in pressure causing them to rupture.
Soil aggregates protect organic matter within their structure from microbial attack.
Formation and preservation of aggregates allows organic matter to be preserved in the
soil.
Minimize tillage. Tillage operations that pulverize soil aggregates are the most damaging.
Secondary tillage is often harder on the soil than primary tillage. Tillage systems that
maximize surface residues are preferred. Use tillage sparingly to solve specific soil
problems.
338. Slake Test: To Be Done by Soil Scientist
Slaking indicates the stability of soil aggregates, resistance to erosion.
Slaking also suggests how well soil can maintain its structure to provide water and air for
plants and soil microorganisms when it is rapidly wetted.
Conservation tillage systems, such as no-till, reduce slaking by reducing soil disturbing
activities that break aggregates apart and accelerate decomposition of organic matter.
No-till and residue management lead to increased soil organic matter and improved
aggregate stability and soil structure, particularly when cover crops or sod-based rotations
provide an additional source of residue.
Minimize erosion. Erosion takes away your very best soil! It's your surface soil that has
the highest fertility that goes "down the drain", during a rainstorm. If you farm land that
is susceptible to erosion, controlling it should be your top priority. Soil erosion is the
most detrimental aspect of agriculture. We can't turn our backs on soil erosion and call
ourselves sustainable!
Major practices – cover crops, no-tillage, crop rotation, mulching, composting, minimum
tillage.
Note: Both soils are a sandy loam texture; the one on the left has strong aggregate stability and
higher organic matter. The soil on the right has low organic matter and low organic matter.
Soil on the right fell apart in about 10 to 15 minutes; the soil on the left was still intact after
being in water after three days.
349. Earthworm Test,
Practice crop rotation. Grow crops that have different rooting action and residue
production. This helps in providing a habitat for diverse soil organisms.
Major practices – cover crops, no-tillage, crop rotation, mulching, composting,
minimum tillage.
Earthworms dramatically alter soil structure, water movement, nutrient dynamics,
and plant growth.
Earthworms are most active during the spring and fall, which are the best times to
observe their activity.
Earthworms get their nutrition from microorganism and organic matter. As it passes
through the earthworm and get broken down in the intestine. The nutrients held by the
organic matter and microorganisms are then released into a form that plants could use.
At the same time the earthworms mix and create aggregates. Earthworms can turn over
the top six inches of soil in ten to twenty years.
Earthworms increase porosity and drainage as they move through the soil.
Earthworms will increase the Available Water Holding Capacity by increasing soil
porosity and aggregation.
Earthworms also create channels for root growth and also carry plant residue or organic
matter further down into the soil.
Minimize use of pesticides. Some pesticides are slightly toxic to non- target soil
organisms. Dyfonate, Counter, and Thimet can affect earthworms. Triazines also
have a negative affect on the worms.
A soil should have 10 to 15 earthworms per cubic foot.
35What should you do after the work-shop:
In the next few months or years as you continue working the land and using some or all of the
practices that we talked about. You should also continue to monitor the changes in the soil as we
discussed today for success or failure. A soil quality guide sheet should be used to continue the
collection of field data with the understanding that these guide sheets be used to compare the soil
quality from year to year if the farming practices worked. Work towards a sustainable soil
management and find ways to apply them in your operation.
If you feel a little over whelmed by our presentations, start with one or two new practices and
build on them. Seek additional assistance form our offices and research for other farmers that
have used this soil quality kit to build their soils.
For more information about Soil Quality and Soil Health:
http://soils.usda.gov/sqi/
36Component No-Till vs. Conventional
Crop Yields NT = CT
(Except during drought)
Weed Biomass NT > CT
Residue Decomposition Rates CT > NT
Surface Crop & Weed Residues NT > CT
Surface Litter (%N) NT > CT
Nitrification Activity NT > CT
In upper soil layer
Total Soil N NT > CT
In upper soil layer
Organic Matter NT > CT
Soil Moisture NT > CT
Foliage Arthropods CT = NT
Arthropods Species Diversity NT > CT
37**************************************************************************************
For Sale by Owner
– Great for home owner landscaping.
"The U.S. Department of Agriculture (USDA) prohibits discrimination in all of its programs and activities
on the basis of race, color, national origin, age, disability, and where applicable, sex (including gender
identity and expression), marital status, familial status, parental status, religion, sexual orientation, political
beliefs, genetic information, reprisal, or because all or part of an individual's income is derived from any
public assistance program. (Not all prohibited bases apply to all programs.) Persons with disabilities who
require alternative means for communication of program information (Braille, large print, audiotape, etc.)
should contact USDA's TARGET Center at (202) 720-2600 (voice and TDD).“
38You can also read