EXTREME HEAT
    The Economic and Social
Consequences for the United States
←
→
Page content transcription
If your browser does not render page correctly, please read the page content below
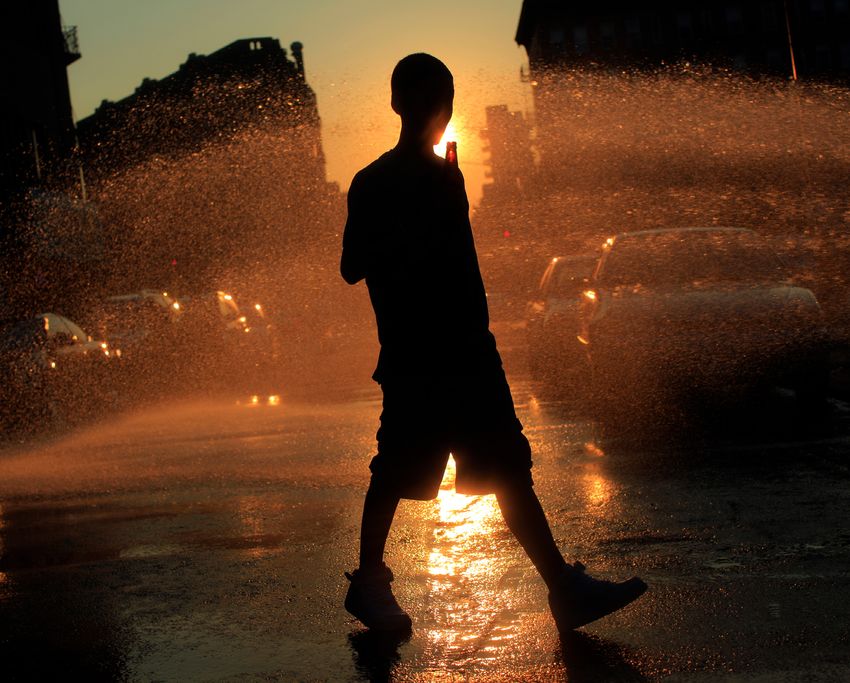
EXTREME HEAT
The Economic and Social
Consequences for the United StatesAdrienne-Arsht Rockefeller Foundation Resilience Center
The Adrienne Arsht-Rockefeller Foundation Resilience Center, housed at the Atlantic Council, was
founded in 2019 with the ambitious goal of reaching one billion people with Resilience solutions to
climate change, migration and security by 2030.
In 2020, the Center launched the Extreme Heat Resilience Alliance (EHRA), a coalition of more than 30
global city and county leaders and experts in public health, finance, humanitarian assistance, disaster
management, climate science, risk, insurance and public infrastructure, committed to protecting lives
and livelihoods, particularly vulnerable people and communities, from the dangers of extreme heat. City
Champions for Heat Action (CCHA), a cornerstone program of EHRA, was launched in 2021 to bring
together elected leaders of major cities and counties around the world to reduce heat risk for their
citizens. The initiative has spurred climate-forward cities such as Miami-Dade County, Athens, Greece and
Freetown, Sierra Leone to commit to naming Chief Heat Officers and accelerating vital heat interventions.
The Center is also spearheading a global movement to name and categorize heatwaves to help sound
the alarm for approaching emergencies and build a culture of preparedness around extreme heat. For
more information please visit https://www.onebillionresilient.org/ or follow us on Twitter at @ArshtRock.
Vivid Economics
Vivid Economics is a leading strategic economics consultancy with global reach. We strive to create lasting
value for our clients, both in government and the private sector, and for society at large. We are a premier
consultant in the policy-commerce interface and resource- and environment-intensive sectors, where we
advise on the most critical and complex policy and commercial questions facing clients around the world.
The success we bring to our clients reflects a strong partnership culture, solid foundation of skills and
analytical assets, and close cooperation with a large network of contacts across key organizations.
This report was produced by the Atlantic Council’s Adrienne
Arsht Rockefeller Foundation Resilience Center with analysis
by Vivid Economics and support from Bank of America.EXTREME HEAT
The Economic and Social
Consequences for the United States
ISBN-13: 978-1-61977-192-5
Cover: REUTERS/Eric Thayer.
This report is written and published in accordance with the Atlantic Council Policy on Intellectual Independence. The au-
thors are solely responsible for its analysis and recommendations. The Atlantic Council and its donors do not determine,
nor do they necessarily endorse or advocate for, any of this report’s conclusions.
August 2021Extreme Heat: The Economic and Social Consequences for the United States
Table of Contents
1. Introduction 1
2. Impact on Labor Productivity 2
3. Impact on Agricultural Yields 7
4. Impact on Health Outcomes 8
Bibliography 11
Annex 13
Methodology 15
ii ATLANTIC COUNCILExtreme Heat: The Economic and Social Consequences for the United States
1 Introduction
The United States has historically faced periods of ex- ones, from people enduring uncomfortable conditions and
treme heat, but climate change over the next 30 years workers taking sick leave, and enduring losses, for exam-
could make these events more frequent, widespread, ple, due to interruptions to education or property damage
and severe. Under prevailing late-twentieth-century cli- from wildfires which can be more severe due to extreme
mate conditions, around 5 percent of the current pop- heat’s effect on the environment. Tourism and other leisure
ulation—roughly 16.5 million people—could expect to activities are also affected as temperatures rise, making
experience 100+ days per year where the daily maximum walking, shopping, and sightseeing uncomfortable and
temperature is above 90°F. Without concerted action to potentially dangerous.
limit emissions, this could increase to around 30 percent
of the population by 2050. Many more people face ex- This paper quantifies some of the likely socioeconomic
treme heat in unusually warm years: the recent heat wave impacts of heat in the United States under current and
in the Pacific Northwest provides stark evidence of how possible future conditions. It provides new, quantitative
even relatively cool parts of the country can be exposed evidence of the economic importance of heat for policy
to high-severity heat events. makers and investors and shows how impacts are disag-
gregated across regions, socioeconomic groups, and sec-
The economic and societal consequences of extreme tors of the economy. As Table A1 in the Annex highlights,
heat are pervasive. Impacts encompass reductions in this paper considers only a subset of the ways in which
GDP, as workers and infrastructure systems become less extreme heat can impact the US economy and society and
productive, as well as wider detrimental effects on well-be- appraises impacts only in “normal”—as opposed to unusu-
ing, as healthcare outcomes worsen and people are un- ally warm—years, meaning it provides a conservative view
able to access outdoor space. Impacts include transitory of the overall significance of the issue.
Figure 1: Number of Days Where Daily Maximum Temperature Exceeds 90°F, by County
Baseline 2030 2050
Hot days Hot days Hot days
Hot days
0 to 25 0 to 25 0 to 25
25 to 50 25 to 50 0 to 25
25 to 50
50 to 75 50 to 75 50 to 75
75 to 100 75 to 100 25 to 50
75 to 100
100 to 130 100 to 130 100 to 130
130 to 170 130 to 170 50 to 75
130 to 170
170 to 200 170 to 200 170 to 200
75 to 100
100 to 130
130 to 170
170 to 200
Note: Baseline based on historical climate data from 1986 to 2005. Future outlooks for 2030 and 2050 are based on an ensemble
mean of 10 CMIP5 climate models run under the RCP 8.5 emissions scenario for 2021 to 2040 and 2041 to 2060, respectively. See
methodology document for further details.
Source: County-level analysis conducted by Vivid Economics.
ATLANTIC COUNCIL 1Extreme Heat: The Economic and Social Consequences for the United States
2 Impact on Labor Productivity
Extreme heat-related labor productivity losses already heat-related losses amount to more than 0.5 percent of
affect all regions and sectors of the US economy. Under economic activity (gross value added; GVA) in 62 percent
baseline climate conditions, the United States could lose of counties (they exceed $5 million in a similar share of
on average approximately $100 billion annually from counties) and only in a small number of counties in Alaska
heat-induced lost labor productivity—approximately the are they zero.2 By comparison, in fiscal year 2020 Harris
annual budget for the Department of Homeland Security County, Texas, spent approximately 0.5 percent of its bud-
($51.7 billion) and the Department of Housing and Urban get on mental health support and 0.8 percent on public
Development ($44.1 billion) combined (US Government libraries (Harris County 2019). Losses are proportionally
Publishing Office 2019).1 By comparison, the “record-break- steepest in sectors such as agriculture and construction
ing” 2020 Atlantic hurricane season caused an estimated where outdoor work is prevalent but are greatest overall
$60 billion to $65 billion in loss and damages, including in services (~$600 million), the most valuable sector of the
physical damages, lost economic activity, and health im- economy, which remains vulnerable to heat due to limited
pacts (Puleo 2020). Damages significantly affect most air-conditioning.3 The services sector covers a wide range
localities of the United States—in a typical year, annual of industries and occupations with varying exposure, from
Figure 2: Distribution of Economic Losses from Reduced Worker Productivity Due to Heat Stress, Baseline Scenario
Share of counties with % of GVA loss
Baseline annual modeled due to heat stress (%) Percent loss within range, baseline
0.0 to 0.2
0.2 to 0.5
0.5 to 1.0
14%
1.0 to 1.5
1.5 to 2.0
22%
2.0 to 3.0
3.0 to 5.0
2%
24%
1%
5%
0%
0%−0.25%
0.25%−0.5%
0.5%−1%
32% 1%−2%
2%−3%
3%−4%
4% and more
Note: Gross value added lost across all sectors of the economy in 2020, based on historical climate data from 1986 to 2005.
Source: Vivid Economics. Data on workability (share of productive working hours lost due to human heat stress) from Woodwell
Climate Research Center (WCRC).
1 2020 results based on the “baseline” climate scenario using historical data from 1986 to 2005. See the methodology document for further details. The
effect of heat stress on work comes through two channels: the need to take breaks to rest, hydrate, or seek cooling in a less exposed environment, and a
natural self-limiting response of an overheated body reducing effort to maintain function. See (Dunne et al. 2013).
2 Measured as lost gross value added (GVA), the measure of the value of goods and services produced in an area, industry, or sector of an economy.
3 “Services” includes a wide range of industries, including white-collar services, restaurants and hospitality, transportation, education, retail and wholesale
trade, healthcare, and more. See the methodology document for further details.
2 ATLANTIC COUNCILExtreme Heat: The Economic and Social Consequences for the United States
Figure 3: Estimated Economic Losses from Reduced Worker Productivity Due to Heat Stress, Baseline, by Major Sector
4.0 600
3.5
500
3.0
400
$ GVA lost, bln
2.5
% GVA lost
2.0 300
1.5
200
1.0
100
0.5
0.0 0
Baseline 2030 2050 Baseline 2030 2050
Agriculture Construction Manufacturing Services Agriculture Construction Manufacturing Services
Note: Based on historical climate data from 1986 to 2005 and 2020 economic data for baseline and projections for 2030 (2021 to
2040) and 2050 (2041 to 2060) under RCP 8.5 and SSP5. See methodology document for more details.
Source: Vivid Economics. Data on workability (share of productive working hours lost due to human heat stress) from Woodwell
Climate Research Center (WCRC).
Figure 4: Evolution of Modeled Economic Losses from Reduced Worker
Productivity Driven by Human Heat Stress, Baseline, 2030, and 2050
Baseline 2030 2050
Baseline annual modeled GVA loss due to heat stress (%) Modeled
Percent loss annual GVA loss due to heat stress in 2030 (%) Modeled
Percent loss annual GVA loss due to heat stress in 2050 (%) Percent loss
0.0 to 0.2 0.0 to 0.2 0.0 to 0.2
0.2 to 0.5 0.2 to 0.5 0.2 to 0.5
0.5 to 1.0 0.5 to 1.0 0.5 to 1.0
1.0 to 2.0 1.0 to 2.0 1.0 to 2.0
2.0 to 3.0 2.0 to 3.0 2.0 to 3.0
3.0 to 4.0 3.0 to 4.0 3.0 to 4.0
4.0 to 5.0 4.0 to 5.0 4.0 to 5.0
5.0 to 6.0 5.0 to 6.0 5.0 to 6.0
Note: Based on historical climate data from 1986 to 2005 and 2020 economic data for baseline and projections for 2030 (2021-
2040) and 2050 (2041-2060) under RCP 8.5 and SSP5. See methodology document for more details.
Source: Vivid Economics. Data on workability (share of productive working hours lost due to human heat stress) from Woodwell
Climate Research Center (WCRC)
office jobs which are largely air-conditioned to work in but also affect a larger share of the economy, amounting
transportation and warehousing which largely takes place to an estimated ~0.5 percent of projected GDP by 2030
outside or in environments that are not air-conditioned. and ~1 percent of GDP by 2050. Texas, Mississippi, and
Alabama are already among the states facing the highest
Without meaningful action to reduce emissions and/or heat stress-related economic losses and could also face
adapt to extreme heat, labor productivity losses could the greatest increase in losses as a share of output. By
double to nearly $200 billion by 2030 and reach $500 2050, 80 percent of the counties in the United States could
billion by 2050. Losses mount not only in dollar terms lose more than 0.5 percent of their GVA due to heat-related
ATLANTIC COUNCIL 3Extreme Heat: The Economic and Social Consequences for the United States
Figure 5: Exposure to Heat by Race, Baseline Climate Conditions
Average Annual number of days with exposure to maximum daily temperature above 90°F by race, baseline
42
37
28
21
Asian White Black Hispanic
Note: Based on historical climate data from 1986 to 2005 and demographic details from the 2019 American Community Survey.
Source: Vivid Economics.
Box 1: Texas Accounts for Almost a Third of National Labor Productivity Losses
Texas is exposed to the greatest labor productivity terms, from ~$30 billion or ~1.5 percent of GVA on aver-
losses due to heat stress under baseline conditions, age in the baseline period to ~110 billion or ~2.5 percent
and, without adaptation, this will remain the case in of GVA by 2050. High Texan losses can be explained
2050. Without adaptation or action to reduce emissions, by both the level of heat and composition of economic
losses are projected to mount in absolute and relative activity, with relatively high levels of outdoor work.
Figure B1.1
Estimated baseline GVA loss by county in Texas
due to labor exposure to heat stress (%)
Employment in Construction and
Employment in construction and
other outdoors activities (%)
other outdoorinactivities
Employment
40
(%) and
Construction
other outdoors activities (%)
GVA
GVA lossloss
(%) (%) 40
30
5.0
5.0 30
4.0 20
3.0 4.0
20
10
2.0 3.0
1.0
2.0 10
1.0
4 ATLANTIC COUNCILExtreme Heat: The Economic and Social Consequences for the United States
Box 2: Hispanic Workers Are Likely to Be Disproportionately
Affected by Heat Stress in Southern California
California is exposed to significant losses from heat-in- tionately represented in the demographics of agricul-
duced labor productivity impacts under baseline climate tural workers (Isaacs 2020). As such, Hispanic workers
conditions, worth around $3 billion. By comparison, the are likely to experience heat-related losses equiva-
2019-2020 state budget allocated $2.75 billion in emer- lent to ~2.0 percent of their productivity in Imperial
gency investments for housing and homelessness (State County, relative to ~1.7 percent for White workers.
of California 2019, 67). These losses are concentrated
in counties in Southern California, which are hotter and In 2005, California became the first state to establish a
often more dependent on agriculture. For example, statewide occupational heat illness prevention directive
Imperial County has desert conditions but, due to irriga- that applies to all outdoor workers, requiring employ-
tion supplied by the Colorado River, is one of the most ers to provide water, rest, shade, and training. Although
productive farming regions in the state, with 9.2 percent studies have found farms comply with the standards,
of workers in the county employed in agriculture. the measures are not sufficiently effective to eliminate
heat-related illness among farmworkers (Mitchell et al.
Imperial County borders Mexico and 85 percent of its 2018).
population is Hispanic. Hispanic workers are dispropor-
Figure B2.1: Baseline % Employment in Agriculture, % GVA Lost,
and Percentage of Hispanic Working Population in California
Hispanic people in population (%)
Employment in Agriculture (%)
30 80
GVA loss (%)
60
20 1.20
0.90
40
10
0.60
20
0.30
0
productivity losses, and 86 percent of the counties in the worker is likely to experience ~40 to 45 such days. White
United States may face losses of at least $5 million per year. and Asian workers typically live in cooler areas and are
exposed to approximately ~25 to 30 and ~20 to 25 days,
Black and Hispanic workers face proportional productiv- respectively, with temperatures above 90°F. Greater expo-
ity losses 18% percent greater than non-Hispanic White sure to this heat stress means Black and Hispanic workers
workers. Black and Hispanic workers tend to live and work tend to face worse working conditions and, on average,
in more heat-exposed regions of the country. On aver- lose ~1.3 percent of their productivity. In contrast, an av-
age, a Black worker is likely to experience ~35 to 40 days erage non-Hispanic White worker tends to face a lower
with maximum temperature above 90°F, and a Hispanic average productivity loss of ~1.1 percent.
ATLANTIC COUNCIL 5Extreme Heat: The Economic and Social Consequences for the United States
Box 3: Florida’s Hot and Humid Conditions Threaten Its Service-Driven Economy
Hot and humid conditions in Florida result in high labor ensure low cost alternatives for cooling and managing
productivity losses. At $11 billion in a typical year, labor extreme temperatures, this will not only negatively im-
productivity losses in Florida are second only to Texas pact our customers experience, it will also impact our
and are expected to increase more than fourfold to $52 ability to attract and retain visitor numbers” (Flavelle
billion by 2050. Florida is a services-driven economy, a 2019). The impact of heat on tourism has been found in
sector which accounts for 89 percent of employment, empirical analysis. For example, a study of an outdoor
with leisure and hospitality alone accounting for 11 per- tourist attraction in California (the Living Desert Zoo and
cent (US Bureau of Labor Statistics 2021). Disney World Botanical Gardens in Palm Desert) found that visitor at-
is a major employer in the sector, with the resort em- tendance declined at temperatures of 86°F and higher
ploying 77,000 workers before the COVID-19 pandemic, (Yañez et al. 2020). In Orange and Osceola Counties,
and has expressed concern about the risk of extreme where Disney World Resort is based, the number of hot
heat associated with climate change. In its disclosure days is expected to increase by 50 percent between
to CDP, Disney outlined that rising temperatures are al- now and 2050, reaching 151 and 156 days, respectively.
ready affecting “the comfort and health and well-being The tourism sector offers particular adaptation chal-
of customers” and “if measures are not taken to lenges due to the outdoor nature of many activities.
Figure B3.1
Baseline 2050
Hot days Hot days
0 to 25 Hot days
0 to 25
25 to 50 25 to 50
50 to 75 50 0
to to
75 25
75 to 100 75 25 to 50
to 100
100 to 130 100 to 130
130 to 170 50 to 75
130 to 170
170 to 200 17075 to 100
to 200
100 to 130
130 to 170
170 to 200
6 ATLANTIC COUNCILExtreme Heat: The Economic and Social Consequences for the United States
3 Impact on Agricultural Yields
Physical impacts on crop yields can compound with re- could grow from ~2 percent to 13 percent and ~1 percent
duced labor productivity in US agriculture: without adap- to 11 percent, respectively. Wheat, whose earlier growing
tation, corn yields in key regions could fall by ~10 percent season means losses are minimal under baseline condi-
by 2050. Many key crops are vulnerable to extreme heat: tions, could experience yield losses of up to 11 percent by
corn, soy, and wheat, which collectively covered approxi- 2050. With the United States accounting for nearly a third
mately 62 percent of harvested area in the United States of global corn exports, the economic consequences could
in 2010, could face significant losses during growing sea- be internationally significant (US Department of Agriculture
sons without adaptation (Schauberger et al. 2017). In the 2020). Reduced corn supply could cause prices to rise,
Midwest, yield losses associated with heat for corn and resulting in higher prices for foods and fuels that use corn
soy, whose growing seasons are in the spring and summer, as a major input (Forbes 2021).
Box 4: Illinois’ Agricultural Prowess Is Vulnerable to a Changing Climate
Illinois is a leading producer of soybeans, corn, and pork gests that Illinois loses ~$200 million on average each
products in the United States. The sale of Illinois’ ag- year from heat-damaged major crops.1 Absent adapta-
ricultural commodities generates $19 billion each year, tion, this number could increase to ~$1.6 billion by 2050,
of which corn accounts for 54 percent and soybeans driven primarily by projected losses in corn (67 percent)
27 percent, and agriculture accounts for 6 percent of and soybeans (32 percent). A separate study found that
employment (Illinois Department of Agriculture 2021). Illinois could lose up to ~$13 billion each year from crop
Under baseline climate conditions, the analysis sug- losses by the end of the century (Gordon et al. 2015).
Figure B4.1: Estimated Lost Corn Production in Baseline and
Modeled 2050 Climate Scenarios in Illinois (in $ millions)
Lost production (mln$) Lost production (mln$)
4
20
2 15
10
4
2
1 Corn, cotton, soybeans, and wheat.
ATLANTIC COUNCIL 7Extreme Heat: The Economic and Social Consequences for the United States
4 Impact on Health Outcomes
Extreme heat is already a leading cause of mortality in by climate change and population growth, as well as de-
the United States, but without adaptation, deaths could mographic shifts from an aging population. People aged
increase more than sixfold. Under baseline climate and 65 and older are more than twenty times more likely to
current demographic conditions, more than 8,500 deaths die from heat-related events compared to people aged
would be expected in a typical year as a consequence 1 to 44 years.
of daily average temperatures above 90°F, concen-
trated in the country’s hottest areas. This is projected These projections do not account for factors that could
to increase more than sixfold to ~59,000 by 2050, with increase future mortality. Access to air-conditioning is
increases projected to be concentrated in already hot a critical mitigant of health risks from heat. More wide-
areas in southwestern Arizona, Southern California, and spread heat episodes could affect areas where access is
southwest Texas, as well as becoming more widespread. least well established at present, including in lower-income
Estimated increases in heat-related mortality are affected communities, while increased demand for air-conditioning
Box 5: Arizona’s Hot Conditions Could Increase the Risk of Heat-Related Deaths
Arizona averaged approximately 50 dangerous heat appropriate in the environment. Tree canopy cover re-
days (above 90°F average temperature) per year during duces not only the surface temperature outdoors by as
the baseline period. This figure is likely to increase to much as 45°F but can also cool buildings and reduce in-
~80 by 2050. Arizona accounts for 45 percent of the door cooling energy costs (US Environmental Protection
modeled heat-related deaths in the baseline period, but Agency 2021)
as extreme heat becomes more widespread across the
United States, other states will see relative increases.
By 2050, Arizona will account for only 22 percent of the
modeled heat-related deaths, while Texas will account Figure B5.1: Heat-related excess mortality, baseline
for 30 percent.
In 2020, officials in Arizona reported 520 heat-related Mortality rate
deaths, of which 315 were in Maricopa County (where 0 to 1
1 to 2
Phoenix is located) and 155 were among the homeless 2 to 5
5 to 10
population (James 2021). Although the Phoenix metro- 10 to 20
20 to 40
politan area experiences the most deaths by number, 40 to 60
there is growing concern about the rural western part of 60 to 160
the state, which experience high rates of heat-related ill-
ness attributed to energy poverty and inaccessibility of
public services (Stone 2021). In Arizona, mobile homes
account for 11 percent of housing units and can pres-
ent a particular risk (Segedy 2018). The poor design of
mobile homes means that residents tend to spend a
high proportion of their income on energy bills (Jessel
et al. 2019). Low-income, elderly people living in these
types of housing with limited access to cool, indoor
public space are highly vulnerable to heat-related ill-
ness. In 2019, rural Yuma County’s heat illness rate was
nearly three times higher than the state average (Stone
2021). Exposure to dangerous high temperatures may
be mitigated by increasing tree canopy cover, where
8 ATLANTIC COUNCILExtreme Heat: The Economic and Social Consequences for the United States
Figure 6: Estimated Mortality Due to Extreme Heat Days
(Above 90°F Mean Daily Temperature), Baseline, 2030, and 2050
Excess mortality rate due to days with mean Excess deaths due to days with mean Excess deaths due to days with mean
temperature above 90°F, baseline temperature above 90°F, 2030 temperature above 90°F, 2050
Mortality rate Mortality rate Mortality rate
0 to 1 0 to 1 0 to 1
1 to 2 1 to 2 1 to 2
2 to 5 2 to 5 2 to 5
5 to 10 5 to 10 5 to 10
10 to 20 10 to 20 10 to 20
20 to 40 20 to 40 20 to 40
40 to 60 40 to 60 40 to 60
60 to 160 60 to 160 60 to 160
Missing Missing Missing
Note: Baseline based on historical climate data, 1986 to 2005. Future outlook for 2030 and 2050 is based on an ensemble mean
of 10 CMIP5 climate models run under the RCP 8.5 emissions scenario for 2021 to 2040 and 2041 to 2060, respectively. See
methodology document for further details.
Source: County-level analysis conducted by Vivid Economics.
Box 6: Occupational Injuries
In addition to impacts on mortality, there is evidence Extreme heat is estimated to explain around 120,000
that extreme heat can lead to higher rates of occupa- occupational injuries on average per year during the
tional injuries. This can have effects on both health baseline period. Without adaptation, this number could
outcomes and productivity. Park et al. 2021 found that increase nearly fourfold to ~450,000.
hot days increase occupational injuries for outdoor and
indoor activities, even those not directly related to heat
such as falls, slips, and trips (Park et al. 2021).
Figure B6.1
Modeled occupational injuries due to heat days above 90°F, baseline Injuries
Modeled occupational injuries due to heat days above 90°F in 2050 Injuries
0 to 25 0 to 25
25 to 50 25 to 50
50 to 100 50 to 100
100 to 250 100 to 250
250 to 500 250 to 500
500 to 1,000 500 to 1,000
1,000 to 2,000 1,000 to 2,000
2,000 to 5,000 2,000 to 5,000
Missing Missing
ATLANTIC COUNCIL 9Extreme Heat: The Economic and Social Consequences for the United States
strains grid capacity, risking outages.4 Additionally, climate alone left 35 percent of households in New Jersey without
change could increase the likelihood of heat events coin- power in August 2020, and more than 90,000 households
ciding with other physical hazards that can cause power in Connecticut were left without power for over a week,
outages. The 2020 Atlantic hurricane season caused leading the governor to declare a state of emergency
millions of Americans to lose power during the summer (Mersereau 2020; Scinto 2020).
months when heat was most intense. Tropical Storm Isaias
4 California regularly faces grid stress due to peak demand for air-conditioning on hot days. The grid operator issues “Flex Alerts” to request voluntary
reductions in energy use by consumers (California ISO 2021; Ormseth 2021).
10 ATLANTIC COUNCILExtreme Heat: The Economic and Social Consequences for the United States
Bibliography
California ISO. 2021. What is a Flex Alert? http://flexalert. Outages.” Forbes. August 4. https://www.forbes.com/
org/. sites/dennismersereau/2020/08/04/isaias-severs-
power-to-millions-heres-how-to-prepare-for-future-
Dunne, John P., Ronald J. Stouffer, and Jasmin G. John. power-outages/?sh=398866851063.
2013. “Reductions in labour capacity from heat stress
under climate warming.” Nature Climate Change Mitchell, Diane C., Javier Castro, Tracey L. Armitage,
3(6): 563–566. https://doi.org/10.1038/nclimate1827. Daniel J. Tancredi, Deborah H. Bennett, and Marc B.
Schenker. 2018. “Physical activity and common tasks
Flavelle, Christopher. 2019. “From Banks to Telecoms, of California farm workers: California Heat Illness
Large Firms Disclose Risks, Opportunities of Prevention Study (CHIPS).” Journal of Occupational
Climate Change.” Insurance Journal. January and Environmental Hygiene 15 (12): 857–869. https://
22. https://www.insurancejournal.com/news/ doi.org/10.1080/15459624.2018.1519319.
national/2019/01/22/515447.htm.
Ormseth, Matthew. 2021. “Grid operator, expecting hot
Gordon, Kate, Matthew Lewis, Jamesine Rogers, and weather and high demand for electricity, issues flex
Finona Kinniburgh. 2015. Heat in the Heartland: alert for Wednesday.” Los Angeles Times. July 27.
Climate Change and Economic Risk in the Midwest. https://www.latimes.com/california/story/2021-07-27/
January. https://riskybusiness.org/site/assets/ grid-operator-expecting-hot-weather-and-high-
uploads/2015/09/RBP-Midwest-Report-WEB-1-26-15. demand-for-electricity-issues-flex-alert-for-
pdf. wednesday.
Harris County. 2019. FY 2019-20 Budgets. Harris Park, R. Jisung, Nora Pankratz, and A. Patrick Behrer.
County, Texas. February 8. https://agenda. 2021. Temperature, Workplace Safety, and Labor
harriscountytx.gov/2019/2019-02-12-Vol3-FY2019-20- Market Inequality. IZA Institute of Labor Economics.
ProposedBudget.pdf. IZA DP No. 14560. July. https://www.iza.org/
publications/dp/14560/temperature-workplace-
Illinois Department of Agriculture. 2021. Facts About safety-and-labor-market-inequality.
Illinois Agriculture. https://www2.illinois.gov/sites/agr/
About/Pages/Facts-About-Illinois-Agriculture.aspx. Puleo, Mark. 2020. “Record-breaking 2020 hurricane
season caused $60 billion to $65 billion in economic
Isaacs, Steve. 2020. “Hired Farm Labor and the Role of damage.” AccuWeather. December 1. https://www.
Hispanic Workers.” College of Agriculture Food and accuweather.com/en/hurricane/record-breaking-
Environment. October 29. https://agecon.ca.uky.edu/ 2020-hurricane-season-caused-60-billion-to-65-
hired-farm-labor-and-the-role-of-hispanic-workers. billion-in-economic-damage/858788.
James, Ian. 2021. “Low-income and Latino Schauberger, Bernhard, Sotirios Archontoulis, Almut
neighborhoods endure more extreme heat in Arneth, Juraj Balkovic, Philippe Ciais, Delphine
the Southwest, study shows.” AZCentral. March Deryng, Joshua Elliott, Christian Folberth, Nikolay
15. https://eu.azcentral.com/story/news/local/ Khabarov, Christoph Müller, Thomas A. M. Pugh,
arizona-environment/2021/03/15/poor-and-latino- Susanne Rolinski, Sibyll Schaphoff, Erwin Schmid,
neighborhoods-endure-hotter-temperatures-study- Xuhui Wang, Wolfram Schlenker, and Katja Frieler.
finds/6920826002/. 2017. “Consistent negative response of US crops to
high temperatures in observations and crop models.”
Jessel, Sonal, Samantha Sawyer, and Diana Hernández. Nature Communications 8 (January 19), 13931.
2019. “Energy, Poverty, and Health in Climate https://doi.org/10.1038/ncomms13931.
Change: A Comprehensive Review of an Emerging
Literature.” Frontiers in Public Health 7: 357. https:// Scinto, Rich. 2020. “CT Power Outages: Still 90,000
doi.org/10.3389/FPUBH.2019.00357. Without Electricity Monday.” Patch. August 6
(updated August 10). https://patch.com/connecticut/
Mersereau, Dennis. 2020. “Isaias Severs Power To across-ct/ct-power-outages-town-town-592-000-
Millions—Here’s How To Prepare For Future Power without-power.
ATLANTIC COUNCIL 11Extreme Heat: The Economic and Social Consequences for the United States
Segedy, Jason. 2018. “Notes from the Underground.” US Bureau of Labor Statistics. 2021. Economy at a
thestile1972 (blog). September 22. https:// Glance: Florida. https://www.bls.gov/eag/eag.fl.htm.
thestile1972.tumblr.com/post/178354001485/housing-
in-america-mobile-homes. US Department of Agriculture. 2020. Corn 2020 Export
Highlights. USDA Foreign Agricultural Service.
Sorvino, Chloe. 2021. “It’s Not Just Fuel—$7 Corn https://www.fas.usda.gov/corn-2020-export-
Is Sending Meat Prices Soaring.” Forbes. highlights.
May 14. https://www.forbes.com/sites/
chloesorvino/2021/05/14/its-not-just-fuel---7-corn-is- US Environmental Protection Agency. 2021. “Using Trees
sending-meat-prices-soaring/ and Vegetation to Reduce Heat Islands.” https://www.
epa.gov/heatislands/using-trees-and-vegetation-
State of California. 2019. California State Budget 2019- reduce-heat-islands.
20. http://www.ebudget.ca.gov/2019-20/pdf/
Enacted/BudgetSummary/FullBudgetSummary. US Government Publishing Office. 2019. A Budget for a
pdf#:~:text=The Budget allocates %2414.3 billion Better America: Fiscal year 2020 Budget of the U.S.
in 2019-20%2C and,resiliency and pay down the Government. https://www.govinfo.gov/content/pkg/
state%27s unfunded liabilities. BUDGET-2020-BUD/pdf/BUDGET-2020-BUD.pdf.
Stone, Erin. 2021. “Few resources, long distances and a Yañez, Cindy C., Francesca M. Hopkins, and William C.
fearless outlook make heat deadlier in rural Arizona.” Porter. 2020. “Projected impacts of climate change
AZCentral. January 19. https://eu.azcentral.com/ on tourism in the Coachella Valley, California.”
story/news/local/arizona-environment/2021/01/19/ Climatic Change 162 (September 4): 707–721. https://
few-resources-heat-deadly-threat-rural- doi.org/10.1007/s10584-020-02843-x.
arizona/6647412002/.
12 ATLANTIC COUNCILExtreme Heat: The Economic and Social Consequences for the United States
Annex
Table A1: Socioeconomic Impact Channels of Extreme Heat in the United States
Category Mechanism Explanation Analysis
Productivity losses Labor productivity Heat stress reduces labor Annual heat stress-related
productivity, as workers gross value added loss
slow down work and take across the economy,
extra breaks to prevent grouped into four major
overheating. sectors, estimated by
county for baseline, 2030,
and 2050.
Mechanical failures Extreme heat can cause Not estimated in analysis
machinery to overheat
and fail, including vehicles,
computers, and cooled
production processes, for
example.
Infrastructure system Transport infrastructure Not estimated in analysis
failures (for example, runways)
can become unusable in
extreme heat.
Absenteeism Workers who are ill or Not estimated in analysis
injured due to extreme heat
could be unable to work.
Agricultural yield loss Heat stress during key Annual heat-related yield
stages of crop development loss for corn, soy, wheat,
during the growing season and cotton estimated by
could lead to reduced crop county for baseline, 2030,
yields. and 2050.
Health impacts Mortality Extreme heat places stress Annual heat-related deaths
on body systems and can estimated by county and
lead to premature death. age group for baseline,
2030, and 2050.
Occupational injures Exposure to extreme heat Annual heat-related occu-
at work can increase not pational injuries estimated
only heat-related illness, by county for baseline,
but also accidental injury. 2030, and 2050.
Morbidity Heat stress can lead to Not estimated in analysis
both acute heat-related
illness and exacerbation of
chronic illness, especially
cardiovascular, pulmonary,
and renal.
ATLANTIC COUNCIL 13Extreme Heat: The Economic and Social Consequences for the United States
Category Mechanism Explanation Analysis
Health impacts Healthcare costs Hospital admissions and Not estimated in analysis
ongoing treatment can
increase costs both to the
healthcare system and the
individual.
Asset damages Wildfires Dry conditions, driven Not estimated in analysis
in part by heat, can
contribute to increases in
the likelihood of wildfire
occurrence and wildfire
severity.
Other socioeconomic Education Heat can reduce learning Not estimated in analysis
impacts and human capital
development when
students must learn in
environments without air-
conditioning.
Outdoor activities Outdoor activities can Not estimated in analysis
become less enjoyable
and less safe when
temperatures are very high.
Active transport modes
(walking, cycling) could be
reduced.
Domestic activities Normal household activities Not estimated in analysis
may suffer in extreme heat;
comfort and time spent on
these activities are likely to
be reduced.
Tourism Exposure to extreme heat Not estimated in analysis
may reduce tourism to
locations which currently
receive significant income
from tourist activities.
Price effects Impacts on productivity can Not estimated in analysis
increase prices for essential
commodities such as food.
Source: Vivid Economics.
14 ATLANTIC COUNCILExtreme Heat: The Economic and Social Consequences for the United States Methodology This methodology document accompanies the August 2021 report “Extreme Heat: Economic and Social Consequences for the United States” and provides additional detail into the assumptions of the main report and the sources relied on to support and develop those assumptions. Read the methodology document here. ATLANTIC COUNCIL 15
Extreme Heat: The Economic and Social Consequences for the United States
The Atlantic Council is a nonpartisan organization that promotes
constructive US leadership and engagement in international
affairs based on the central role of the Atlantic community in
meeting today’s global c hallenges.
© 2021 The Atlantic Council of the United States. All rights
reserved. No part of this publication may be reproduced or
transmitted in any form or by any means without permission
in writing from the Atlantic Council, except in the case of brief
quotations in news articles, critical articles, or reviews. Please
direct inquiries to:
Atlantic Council
1030 15th Street, NW, 12th Floor, Washington, DC 20005
(202) 463-7226, www.AtlanticCouncil.org
16 ATLANTIC COUNCILYou can also read