Shareholders Report Volume 1 2021 - National Weather Service Austin/San Antonio
←
→
Page content transcription
If your browser does not render page correctly, please read the page content below

2021
 Shareholders
    Report

    Volume 1

National Weather Service
  Austin/San Antonio
TABLE OF CONTENTS

Another Active Tropical Season Forecast for the
                       Atlantic Basin
                              By: Jason Runyen, Lead Meteorologist
To say the 2020 Atlantic Basin hurricane season was
active is an understatement. Thirty named storms
occurred in 2020, breaking the previous record of 28
storms set in 2005. Official records date back to
1851. Out of these 30 named storms, 11 struck the
U.S. The previous record for landfalls in the U.S.
during a single season was nine set in 1916. Nearly
the entire coastline of the U.S. from Texas to Maine
was at one time under some type of watch or warning
from a tropical system. The 2020 season was also
only the second time on record of having 5 or more
tropical cyclones at the same time!

                                                           Other contributing factors for an active season
                                                           include predicted warmer-than-average sea
                                                           surface temperatures in the tropical Atlantic
                                                           Ocean and Caribbean Sea, weaker tropical
                                                           Atlantic trade winds, and an enhanced west
                                                           African monsoon.

                                                           The NOAA forecast for 2021 indicates a likely
                                                           range of 13 to 20 named storms (winds of 39 mph
                                                           or higher), of which 6 to 10 could become
                                                           hurricanes (winds of 74 mph or higher), including
                                                           3 to 5 major hurricanes (category 3, 4 or 5; with
   Major Hurricane Laura approaching the southwest         winds of 111 mph or higher). This forecast reflects
           coast of Louisiana Aug 26, 2020                 a 90% chance of either near-normal to above-
                                                           normal tropical cyclone activity.

Favorable conditions will once again be in place for       So what is normal? Last month, NOAA updated
an active hurricane season in the Atlantic basin this      the statistics used to determine when hurricane
year. El Nino Southern Oscillation (ENSO) conditions       seasons are above-, near-, or below-average
are currently in the neutral phase, with the possibility   relative to the latest 30-year climate record. Every
of the return of La Nina later in the hurricane season.    ten years the averages are updated to the most
“ENSO-neutral and La Nina support the conditions           recent 30-year climate record, which for 2021 is
associated with the ongoing high-activity era,” said       now based on the 1991-2020 averages. From
Matthew Rosencrans, lead seasonal hurricane                2011-2020 the averages were based on the 1981-
forecaster at NOAA’s Climate Prediction Center. The        2010 climate record.
forecast ENSO conditions also correlate to an
increased risk for Texas. During ENSO-neutral or La        For more information on the 2020 Atlantic
Nina conditions Texas is twice as likely to experience     Hurricane Season from two NHC
a tropical storm or hurricane strike than during El        scientists, see their recent blog post here.
Nino conditions.
                                                                                                              pg

                                                                                                              2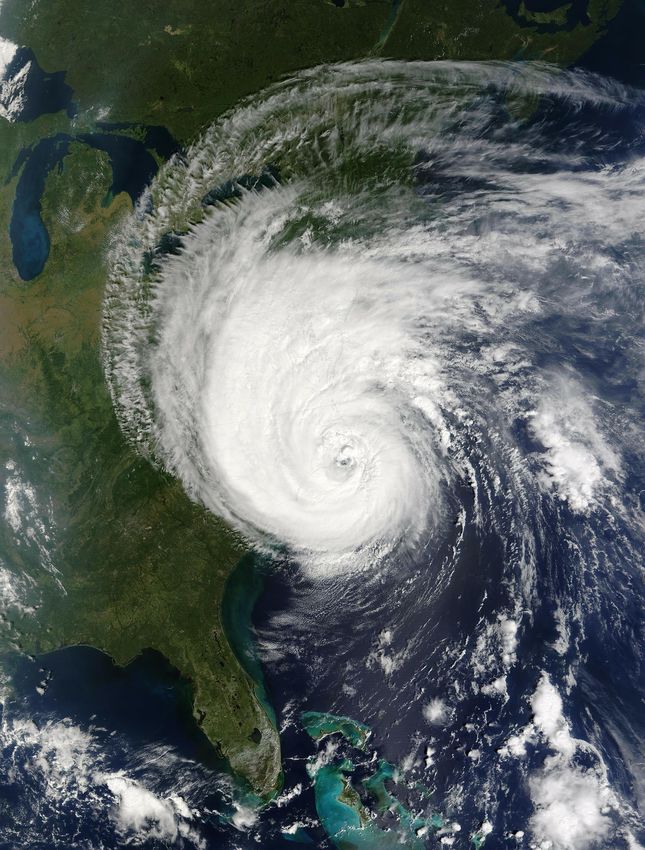
The 1991-2020 climate record indicates an average          Below is the list of names that will be used during
hurricane season producing 14 named storms, of             the 2021 tropical season. Only twice before, in
which 7 become hurricanes, including 3 major               2005 and 2020, has the list of names been
hurricanes. This is an increase in both named              exhausted forcing forecasters to use the Greek
storms and hurricanes compared to the 1981-2010            Alphabet. New for this season, and future
period of record. The increase in the averages may         seasons, the Greek alphabet will no longer be
be attributed to the overall improvement in observing      used if the main list of names is completely used.
platforms, including NOAA’s fleet of next-generation       During the 2020 season, use of the Greek
environmental satellites and continued hurricane           Alphabet led to confusion due to unfamiliarity and
reconnaissance. It may also be due to the warming          similar-sounding names. Instead, a supplemental
ocean and atmosphere which are influenced by               list of names, approved by the World
climate change. The update also reflects a very            Meteorological Organization, will be used anytime
busy period over the last 30 years, which includes         the standard seasonal list is exhausted.
many years of a positive Atlantic Multi-decadal
Oscillation, which can increase Atlantic hurricane
activity.

Like previous tropical seasons, 2021 started early.
This year marks the 7th straight year that the
Atlantic Basin has experienced a named tropical
cyclone prior to the start of the official season, which
is June 1. Tropical Storm Ana formed and dissipated
over the open Atlantic May 22-23.

While the official hurricane season runs June 1st
through November 30th in the Atlantic basin, it’s
important to note that on average two-thirds of all
hurricanes in the Atlantic Basin form after August
28th, and half form after September 9th. Over 90%
of all major hurricanes (Category 3-5 on the Saffir-
Simpson Hurricane Wind Scale) have occurred from
August through October.
                                                                                                                 pg

                                                                                                                 3
Science Corner: What do Hurricanes Require in
                     Order to Form?
                           By: Nick Hampshire, Lead Meteorologist

Hurricane season for the Atlantic Basin spans from June 1st through November 30th and tropical systems that
track through the western Gulf of Mexico can bring impacts to South-Central Texas. Have you ever wondered
what needs to happen for a hurricane to form?

Tropical systems are initially classified as a wave or tropical disturbance that can then strengthen into a tropical
depression. After further strengthening, once maximum winds reach 34 knots (39 mph) the system is classified
as a tropical storm and finally at 64 knots (74 mph), a hurricane. The first thing needed for a tropical system to
develop is the system has to be a certain distance away from the equator. As the earth spins, a rotating force
(Coriolis Force) is created in the atmosphere with the force being strongest at the poles and non-existent at the
equator. This spin is what allows low-pressure systems in the northern hemisphere to rotate counterclockwise.
Typically, tropical systems in the Northern Hemisphere will not develop south of 5 °N latitude.

The second thing needed is warm ocean temperatures and this is the reason hurricane season is in the
summer. Research has shown that the general minimum temperature needed is 80 degrees °F. The
associated low pressure system lifts the warm air and moisture into the atmosphere and is the fuel needed to
keep the tropical system thriving.

Third, temperature needs to be decreasing with increasing height throughout the atmosphere. As the tropical
system continues, it generates heat as air is lifted from the warm ocean layer that is exhausted into the
atmosphere from the center of the rotating system. In order for this warm air to rise, the surrounding air must
be cooler. Therefore, the change of temperature with height must be negative at all times.

Tropical systems also require low vertical wind shear in the atmosphere, meaning very little change in wind
speed and direction with height. Hurricanes are vertically stacked weather systems and any high winds in the
upper atmosphere would tilt the upper level circulation of the system away from the surface low pressure
system causing the continued deep warm-air circulation to cease.

Last, there needs to be deep moisture in the atmosphere extending from the surface into the upper levels of
the atmosphere. For example, if there is any dry air in the mid-levels of the atmosphere, the warm-moist air
rising from the lower atmosphere would begin to evaporate. Evaporation leads to cooling and therefore the
warm and moist air needed would cool and dry as the rising parcels encounter the drier air, disrupting the
warm-core structure of the system.

                                                                                                                  pg

                                                                                                                  4
Climate Data Stewardship at the National Weather
                        Service
                                    By: Keith White, Meteorologist
One of many responsibilities of the National Weather
Service (NWS) is stewardship over weather data that
is used in long term records of our climate. The
accuracy of these data are of the utmost importance
as they are essential to decisions made in sectors
such as agriculture, insurance, energy,
transportation, water resources, and health. As
Climate Services Focal Point at NWS Austin/San
Antonio, I frequently use these data to answer
questions from the public as well as our partners in
the media, government, and other stakeholders,
many of whom need to be able to make informed
decisions beyond the 7-day accuracy window of
weather forecasts.

Data is collected via a range of different sources,
from automated systems to volunteer cooperative              An Automated Surface Observing System (ASOS)
observers entering data manually each day. After
several rounds of quality control (QC) it ends up at its
final repository at the National Centers for               For decades leading up to the installation of
Environmental Information (NCEI) which “hosts and          hundreds of additional automated systems like the
provides public access to one of the most significant      ASOS and it’s little brother the Automated Weather
archives for environmental data on Earth.”                 Observing System (AWOS) in the 1990s, paid
                                                           observers took manual observations of all of the
The primary systems used for remote weather                same weather elements a minimum of each hour
observations, the Automated Surface Observing              24/7/365 at a few hundred locations nationwide. In
System (ASOS; figure 1), are typically located at          addition, the Cooperative Observer Program
airports. There, in addition to providing valuable data    (COOP), which also dates to the 19th century and
to meteorologists in support of forecast and warning       continues to this day, provides daily observations of
operations, they help ensure flights are able to take      maximum and minimum temperature and
off and land in safe weather conditions. The               precipitation at a few thousand locations. These
instruments provide data for the following weather         observations date back as far as the mid-1800s in
elements:                                                  some places, although here in south-central Texas
                                                           records typically begin in the 1880s to early 1900s.
1) Sky condition, including cloud height and amount        As noted in one of several NWS Directives
(clear, scattered, broken, overcast) up to 12,000 feet     documents (the backbone of NWS operations)
2) Visibility (to at least 10 statute miles)               pertaining to climate services, the COOP mission is
3) Basic present weather information: type and             “to provide observational data...necessary to define
intensity for rain, snow, and freezing rain                the climate of the United States and to help measure
4) Obstructions to vision: fog, haze                       extreme weather events, climate variability, and long-
5) Pressure: sea-level pressure, altimeter setting         term climate change.” Some of these sites also serve
6) Ambient temperature, dew point temperature at 2         as a backup should an ASOS go down, which
meters                                                     happened for 4 days in Del Rio this past February.
7) Wind: direction, speed and character (gusts,
squalls) at 10 meters                                                                                               pg
8) Precipitation accumulation
                                                                                                                    5
National Weather Service offices are primarily staffed
by meteorologists, but we also rely on our support staff
to keep things running smoothly. Our Electronics
Technicians, for example, are in charge of both routine
maintenance and repair of NWS ASOS systems (in
addition to NOAA Weather Radio transmitters,
Automated Radiosonde Observing Systems, weather
radar, and more), and help keep them running 24/7/365
to collect this valuable data and ensure its accuracy.

Occasionally, bad data is still transmitted, either by
ASOS/AWOS or by human-entered COOP data. Some
systems have automated QC checks implemented that
flag observations if they fail a certain number of
standard deviations from climatology, and they can be
corroborated by meteorologists here or corrected if
needed. I also perform a thorough, manual QC process
each month for our four long-term climate data site
ASOS stations of Del Rio, San Antonio, Austin
Bergstrom and Austin Camp Mabry before the data are
sent to NCEI. Per NWS Directives: “...all data are
preliminary until they have been subject to all levels of
NCEI quality control. Once they have passed this
quality control, the data are considered “final data.”’       Monthly Observation Form for Austin, TX April 1915
NCEI’s data products are then sent back to us for one
last round of checks before they are finalized and
become part of the official historical weather record.

But what about when we discover possible data errors          Taking this investigation a step further, I used these
in the historical archive? Well, there’s a process for that   original paper forms to fill in several decades worth of
too! As one example, I recently discovered that our           missing snowfall data from the Austin Bergstrom
database showed a 3.8” snow event for April 2, 1915 at        International Airport site. Long-time NWS partner
Austin. Clearly that seems improbable, but I had to           Troy Kimmel assisted in this effort to ensure our
verify. First, I took a peek at temperature and               historical archive databases are as complete as
precipitation data for that date: 0.18” of precipitation      possible.
and a low of 39, neither of which mesh with nearly 4” of
accumulating snow. If the snow data was entered               This all just scratches the surface of all the hard work
incorrectly, could the other data for that date have been     that goes into climate data stewardship. In fact, I’ve
as well? Thankfully, there’s a tool at NCEI for               really only touched on parts of a few of the “Ten
meteorologists and researchers to view the original           Principles of Climate Monitoring” that are outlined in
paper forms dating back as far as records were taken.         our directives, much of which would bore many of
Over a 12 year period from 2000-2011, the Climate             you readers!
Database Modernization Program produced nearly 56
million images from all types of physical media. You          You can access some of the historical records for our
can see in Figure 2 that the temperature and                  four primary sites on a recently revamped webpage
precipitation data were correct, and that there was no        here.
mention of snow that month. I took this evidence to
NCEI via a ticketing tool called Datzilla. They hold
power over the final decisions when it comes to
historical data corrections, and were happy to correct
the data in all of our archive databases.                                                                           pg

                                                                                                                    6
Precipitation Estimation Using the WSR-88D Radars
                             By: Aaron Treadway, Lead Meteorologist
There are a variety of methods that meteorologists use to measure precipitation. The truest and most
accurate way is through direct rain gauge observations at official National Weather Service (NWS) observing
sites (ASOS and AWOS at airports), NWS cooperative observers, USGS, and private rain gauge networks
(such as LCRA, GBRA, and some local counties), and the public CoCoRaHS network. While some of these
rain gauge networks report in real time or every 15 minutes, others only report once a day. This means that
NWS meteorologists need a faster way to measure precipitation so they can issue life-saving Flood
Advisories and Flash Flood Warnings. The WSR-88D radar meets this requirement. Weather radar updates
every two to four minutes and allows forecasters to see where heavy rain is falling and estimate how much
has fallen in the last hour or through an entire event. There are several base and dual-pol products that help
the radar detect what is falling from the clouds and how heavy the precipitation is, along with several derived
products that produce an estimate of how much rain has fallen. These various products are discussed below.

The first group of products are called base or dual-pol products. They are directly processed from the data
received from the radar beam. Dual-Polarization was introduced about ten years ago and allows for the
vertical and horizontal cross section of what the radar ‘sees’ to be measured. This helps the radar tell the
difference between rain, hail, snow, biological targets, and debris. To learn more about how radar works visit
the NWS Educational JetStream.

   Base Reflectivity (Z)
   This is the familiar product shown on TV
   frequently. The base reflectivity measures
   how much energy is sent back to the radar
   from the precipitation. Brighter colors,
   indicating higher reflectivity, mean either
   larger targets (like big rain drops or hail) or
   higher concentrations of raindrops (heavier
   rainfall). As a legacy radar product, base
   reflectivity provides a good initial estimate of
   precipitation intensity.
   Correlation Coefficient (CC)
   The next most common product used in
   examining precipitation is correlation
   coefficient. This dual-pol product measures
   how the horizontal and vertical pulses are
   behaving as the radar scans. More uniform
   scans produce high CC (the reds) and
   mean rain or snow while more complex
   scatters produce low CC (the blues) and
   often mean biological targets or debris
   being lofted into the atmosphere. CC can
   also help differentiate between hail and
   rainfall.

                                                                                                                  pg

                                                                                                                  7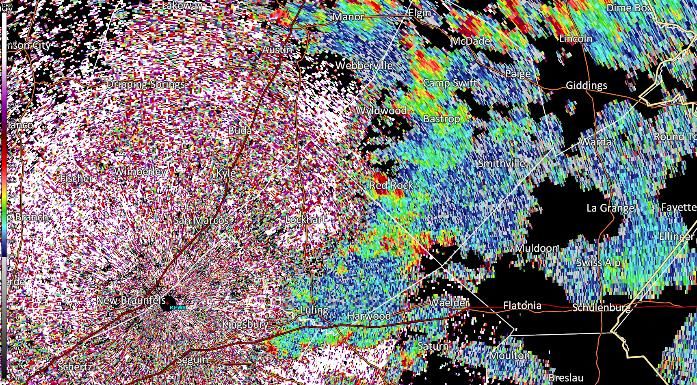
Differential Reflectivity (ZDR)
 Another dual-pol variable is differential
 reflectivity which represents the difference
 between the vertical and horizontal profiles of
 the targets the radar is seeing. Because rain
 drops tend to be flatter and fatter ZDR is
 positive for raindrops, but it is near zero for
 hail (because hail tumbles it appears spherical
 to the radar). The larger the rain drops (which
 tend to produce heavier rain), the larger the
 ZDR.

 Specific Differential Phase (KDP)
 KDP is similar to ZDR in that it looks at the
 orientation and shape of the target the radar is
 detecting. Horizontally oriented targets (like
 rainfall) produce a positive KDP. A benefit of
 KDP is that it is also sensitive to the
 concentration of targets. The more targets
 being scanned, the higher the KDP. That
 means that higher values of KDP (the brighter
 colors) represent higher concentrations or
 heavier rainfall.

 Hydrometeor Classification (HC)
 This product runs dual-pol variables through
 an algorithm and produces a best guess of the
 type of target the radar is seeing. As an
 example, in the image to the right the red is
 small hail, dark green is heavy rainfall, and
 light green is lighter rainfall. Snow, ice
 crystals, clutter, and biological targets are
 other potential classifications produced by this
 algorithm.

Meteorologists can use these five base and dual-pol products to detect pockets of heavy rainfall and
differentiate them from other meteorological targets like hail, using the radar to identify the location of the
heaviest rainfall and track its anticipated direction. However, the radar also takes the data from these
products and processes them into derived products that not only estimate rainfall rates, but rainfall totals as
well.

The second group of products are the derived products and they are calculated in two different ways. The
first way, called the Precipitation Processing Subsystem, uses only the reflectivity, a legacy product, to
determine the precipitation estimation. This may tend to overestimate some precipitation as it is more likely to
translate higher reflectivity contaminated with hail into heavier precipitation. The Quantitative Precipitation
Estimation Algorithm is much more complex, using three equations rather than one, along with the additional
dual-pol variables to produce a more accurate picture of precipitation amounts. Meteorologists often use both
the legacy and the dual-pol estimates in tandem to compare their outputs and observe the range of possible
precipitation amounts. When rain gauge data is available, the estimates are also compared to that data to
determine whether the legacy and dual-pol estimation are over, under, or accurately estimating the amount of
precipitation.                                                                                                   pg

                                                                                                                  8
Digital/Instantaneous Precipitation Rate
  The instantaneous precipitation rate product is
  often used in South Central Texas where heavy
  rainfall, even for a short time, can cause flash
  flooding. The product gives the meteorologist an
  idea where the heaviest rainfall is at the moment
  and is updated with each volume scan. The
  resolution of 250 meters also provides a detailed
  look at the different rainfall rates in the storms
  observed by the radar. Logically, heavier rainfall
  rates produce higher rainfall totals.

  One Hour Precipitation
  This product is produced using both the legacy
  and the dual-pol estimations. The product can
  have two different resolutions (2 km and 250 m)
  and can sometimes have a bias applied to it.
  Regardless of the product differences, it
  considers the precipitation estimation over the
  last hour of time. These one hour totals help
  forecasters make decisions on issuing flash flood
  warnings using flash flood guidance produced by
  the River Forecast Centers. If rainfall amounts
  exceed a certain amount over a one hour period,
  flash flooding is likely. That amount varies based
  on land cover, topography, and antecedent
  conditions.
  Storm Total Precipitation
  This product is also produced using both the
  legacy and the dual-pol estimations. Similar to
  the one hour precipitation product it has two
  resolutions (2 km and 1 degree by 0.25 km). This
  product takes into account all precipitation
  estimated during the duration of a storm. It can
  be manually reset or will reset itself one hour
  after no precipitation is detected by the radar. It
  provides a good overview of how much rainfall
  has fallen during a single storm event and allows
  for easy detection of areas that have seen the
  highest estimated rainfall amounts. Again,
  comparing these estimated totals to gauge
  observations is key.

These eight products are used routinely by meteorologists at the National Weather Service to estimate
precipitation totals and make determinations on whether life saving Flood Advisories and Flash Flood
Warnings are needed. They, along with ground truth data from rain gauges, are also used by River Forecast
Centers to estimate runoff into nearby streams, creeks, and rivers to determine if a River Flood Warning is
needed. While these products all originate from individual radars, like the ones in New Braunfels, near
Brackettville, and near Granger, they are only a portion of the tools meteorologists use to estimate
precipitation. In the next installment of the newsletter we will look into Multi-Radar Multi-Sensor precipitation
estimation products that stitch together output from all of the NWS radars to create a more holistic picture of
precipitation amounts and their impacts over urban areas and within river systems, and how current
estimated rainfall compares with historic rains.                                                                  pg

                                                                                                                 9
NWS Austin/San Antonio Forecasters Provide Support
to Core Partners through the Pandemic
By: Jason Runyen, Lead Meteorologist
The National Weather Service (NWS) has a strong partnership with local, state, and federal emergency
management agencies, which are considered core partners. We support them with Impact-Based Decision
Support Services (IDSS) not only through weather events but a variety of hazards.
IDSS are forecast advice and interpretative services the NWS provides to help core partners, such as
emergency personnel and public safety officials, make decisions when weather, water and climate impacts
the lives and livelihoods of the American people. This support may be needed in response to a particular
event or routinely to support high-value decision making. NWS staff across the U.S. work hand-in-hand
with partners at local, state and national levels to ensure these decision-makers have the most accurate,
reliable and trustworthy weather, water and climate information. NWS Austin/San Antonio accomplishes
this task not only through a commitment to science and technology, but by decades of building trust
through deep relationships with key decision-makers.
The last year and a half has brought many challenges to our emergency management, public safety, and
health officials, with the COVID-19 pandemic being arguably the greatest. Early in the pandemic it was
recognized that weather would impact both logistical and safety efforts at outdoor COVID testing clinics,
and eventually in 2021 at mass outdoor vaccination sites. Beginning in March of 2020 NWS Austin/San
Antonio forecasters began providing daily weather briefings to the Bexar County Office of Emergency
Management, City of San Antonio Office of Emergency Management, Travis County Office of Emergency
Management, and City of Austin Office of Homeland Security and Emergency Management. This support
expanded to other jurisdictions across South-Central Texas through 2020 and into 2021.
Customized weather briefings were emailed to emergency management partners daily by forecasters,
addressing specific wind, lightning, and temperature thresholds that would begin causing impacts at
outdoor testing and vaccination clinics. The weather briefings were created in a format that could easily be
inserted into the core partner’s daily Incident Action Plans, and also were dynamic, containing QR codes
that a partner could scan to get the very latest forecast and current conditions.
Pg
10(Images: Drive through vaccination site at the Alamodome in San Antonio. During certain weather conditions
mitigative actions were required to keep health responders and the public safe and to prevent damage to tents
and other temporary structures).
These impact-based forecasts aided in advanced planning to protect deployed resources to outdoor testing
and vaccination sites, such as camera systems, light towers, and tents which could be damaged if not
secured. Advanced notifications of high heat, cold, ice, lightning, and high winds also enhanced personnel
and public protection.
As the days of the pandemic turned into weeks and months, a variety of weather events impacted our core
partner’s response to the pandemic. This included severe storms, high winds, lightning, floods, heat, tropical
systems, and even the historic winter storm this past February. Ahead of and during these rapidly evolving
weather events forecasters also provided forecasts to core partners via phone calls, virtual conference call
briefings, and NWSChat, which is an internal weather chat room between the NWS, emergency management
partners, and the media. The impact-based forecasts provided in these situations allowed core partners to
make better informed decisions in the operational movement of both personnel and equipment.
“The National Weather Service personnel in New Braunfels are one of our most valued partners for all
operations. Their professionalism, commitment to providing rapidly actionable weather products, and subject-
matter expertise enables us to better protect responders, the public, and our community”, said Mark
Chadwick, Emergency Management Specialist for the Bexar County Office of Emergency Management.
NWS Austin/San Antonio (New Braunfels) provided 442 consecutive days of weather support to aid decision
making of core partners during the pandemic. Weekly briefings continue for some partners.
NWS Austin/San Antonio forecasters stand committed to serving our emergency management partners
through the remainder of the pandemic and any future all-hazards responses.
Pg
11Phenology – Nature’s Calendar
By: Jon W. Zeitler, Science and Operations Officer
While it makes sense that plants and animals are The ways we can measure phenology are through
strongly influenced by short-term weather and long- our own sight, sound, touch, smell, and sometimes
term climate, the reality is more dramatic and intricate. even our own general health. Examples include: 1)
Phenology is the study of recurring plant and animal seeing the first tree buds or flowers appear, 2)
life cycle stages, and how those stages relate to hearing the first call of a particular migrating bird, 3)
weather, climate, and changes in daylight. Another smelling or touching when flowers, fruits, or
way to look at it is phenology is nature’s calendar. Just vegetables are ripe or at full bloom, and 4) when our
as we use calendars to keep track of time as well as allergies act up due to the pollen released in the
plan and anticipate regularly recurring events, plants spring.
and animals do the same in their life cycles. But nature
itself is the calendar.
The figure below shows the basic life cycles of plants
and animals broken down into observable events,
called phenophases. I grew up in Minnesota, and one
of the phenophases people looked for was the first
sighting of a robin in the late winter – a sure sign
spring would be coming soon. In fact, in addition to the
life cycle events shown below, hibernation and
seasonal migration are also examples of how birds and
animals react to changes in temperature, precipitation,
or both.
Source: National Phenology Network
The figure above shows phenophases of the common
lilac. These occur each year, and the dates are
tracked by a network of people around the country.
This allows researchers to relate the date changes
(i.e., lilac blooming earlier than 30 years ago) to
changes in temperature and rainfall, as those affect
the plant’s development. It’s one of the ways we can
track changes in climate without using direct
measurements of temperature or rainfall.
The next figure shows a map of the average first leaf
dates across the United States.
As you might imagine, knowledge of phenology is very
important to farmers, ranchers, fishers, and hunters.
By tracking events and their relation to weather,
climate, and the length of day, one can make good
decisions for planting, fertilizing, harvesting, and taking
care of livestock. Even for your own backyard, knowing
the best conditions for planting and taking care of
plants can make a big difference. Plants do the same
by nature – when to bud, develop flowers, etc., while
birds and other animals know when to look for flowers, Pg
fruits, and nuts for food.
12Source:
National
Phenology
Network
Sometimes, phenology can even impact tourism. For example, the cherry
blossoms bloom in Washington, DC each spring. But the peak bloom
period is not very long, so knowing the average dates, and how the
weather in the winter leading up to those typical dates may affect the
bloom, can help you plan in advance for the best time to make the trip.
The National Park Service helps keep track of this as shown to the right:
If your group would like a more in-depth presentation on phenology,
please contact me at: jon.zeitler@noaa.gov. We can do a virtual
presentation via Zoom, Google Meet, or similar software, or hopefully if
the COVID situation keeps improving, a live presentation at your group’s
meeting this coming fall/winter.
You can also find more information on phenology at these sources:
USA National Phenology Network
Dr. Pam Knox’s Climate and Agriculture in the Southeast Blog
Texas A&M Natural Resources Institute
Texas Master Gardeners
Pg
Texas Master Naturalists
13Employee Awards
Information Technology Officer John Sullivan Meteorologist-in-Charge Joe Arellano [right]
on the New Braunfels 88D Radar tower presenting Senior Forecaster Jason Runyen
[left] with the 2020 NWS National Cline Award
NWS Austin/San Antonio’s Information Technology NWS Austin/San Antonio’s Senior Forecaster Jason
Officer John Sullivan was awarded the 2020 NWS Runyen was awarded both the 2020 NWS Southern
Southern Regional Cline Award for Support Services! Regional Cline Award and the 2020 NWS National
John was presented this prestigious award for the high Cline Award for Program Management! Jason was
level of information technology support services presented with these prestigious awards for initiative,
provided to the several operational programs, services, innovation, and creativity displayed in the Impact
and staff at NWS Austin/San Antonio as well as Based Decision Support Services Program and
throughout the Southern Region of the NWS. technical proficiency and teamwork in the Tropical
Program.
The Isaac M. Cline Award recognizes operational excellence of line and program staff employees in the
delivery of products and services supporting and enhancing the achievement of NWS strategic and
operating plans.
The awards are named in honor of Isaac M. Cline, one of the most recognized employees in weather
service history. Mr. Cline made numerous contributions to the mission of the Weather Bureau. Most
noteworthy of his accomplishments were the actions he took during the Galveston hurricane of 1900, the
deadliest weather event in U.S. history. Isaac Cline’s acute understanding of weather conditions, and his
heroic forecasts and hurricane warnings saved several thousand lives.
The Isaac Cline Award has 3 levels: Local, Regional, and National.
Congratulations to both John and Jason on achieving these Pg
regional and national awards!
14It’s been a cooler than usual summer thus far, but the peak of our
summer heat is typically during the first half of August. Here’s
some reminders and recommended heat safety practices:
Pg
15Pg 16
National Weather Service
   Austin/San Antonio

            2090 Airport Rd
        New Braunfels, TX, 78130
            (830) 629-0130

            weather.gov/ewx

Find us on social media! (images are links)

             Newsletter Editors:
               Keith White
                Jon Zeitler
                 Paul Yura
You can also read