The Development of Seabed Sediment Mapping Methods: The Opportunity Application in the Coastal Waters - IOPscience
←
→
Page content transcription
If your browser does not render page correctly, please read the page content below

IOP Conference Series: Earth and Environmental Science

PAPER • OPEN ACCESS

The Development of Seabed Sediment Mapping Methods: The
Opportunity Application in the Coastal Waters
To cite this article: Khomsin et al 2021 IOP Conf. Ser.: Earth Environ. Sci. 731 012039

View the article online for updates and enhancements.

                               This content was downloaded from IP address 46.4.80.155 on 16/08/2021 at 07:52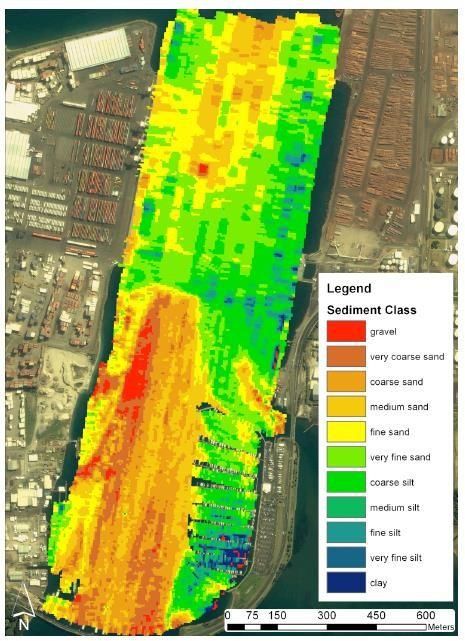
Geomatics International Conference 2020                                                                        IOP Publishing
IOP Conf. Series: Earth and Environmental Science 731 (2021) 012039                        doi:10.1088/1755-1315/731/1/012039

The Development of Seabed Sediment Mapping Methods: The
Opportunity Application in the Coastal Waters

                     Khomsin1, Mukhtasor1, D G Pratomo2, Suntoyo1

                     1
                       Coastal Management and Engineering Program, Ocean Engineering Department, ITS
                     Surabaya 60111
                     2
                       Geomatics Engineering Departement, ITS Surabaya 60111

                     Abstract. Coastal areas have a significant role in human life worldwide, where world economic
                     activities are concentrated in coastal areas. One of which is the activity of loading and unloading
                     import-export goods through ports. Ports management must use a nautical chart to ensure the
                     safety of shipping activities. The nautical chart contains graphical information from the sea and
                     coastal areas, namely: seabed topography, natural and artificial seabed features, coastlines,
                     navigation hazards, both natural and artificial navigation aids, tides, currents, human-made
                     structures such as ports, buildings, and bridges. Seabed sediment is also essential information
                     that must be available in the Nautical Chart. Several techniques and methods are used to make
                     a seabed sediment map, namely mechanical grab (lead line, grab sampler, coring) and acoustic
                     (side-scan sonar, singlebeam, and multibeam echosounder). This paper reviews seabed sediment
                     mapping techniques and proposes techniques and methods in the future.

                     Keywords: nautical chart, seabed sediment, mechanical, acoustic, grab sampler, multibeam
                     echo sounder

1. Introduction
Coastal areas (coastline, coastal environments, and seashore) have been known as a human attraction
 for thousands of years and are continuing today. Many human activities are concentrated in this coastal
area. Besides, many major cities in the world are developing in this region. One of the coastal areas'
economic activities is loading and unloading ships at the port, which requires a nautical chart to support
economic activity. A nautical chart plays an essential role in sea navigation, which depicts seafloor and
 shoreline configuration. It contains graphical information from the sea and coastal areas [1]: bathymetry,
both natural and artificial seabed features, coastlines, navigation hazards, both natural and artificial
navigation aids, tides, and currents, human-made structures such as ports, buildings, and bridges. Also,
  information that is also important that must be in the nautical chart is seabed sediments characteristics.
     Characteristics of seabed sediments are essential for ship safety [2], especially when the ship wants
to stop while in the middle of the sea by throwing anchors. Seabed sediment characteristics are also
essential for construction (installing gas and oil pipelines, laying cables of electricity, optics and
telecommunications, and platform structure) and the environment (benthic habitat impacts, transport
sediment, dredging material, and disposal offshore waste). Furthermore, the intensifying human
exploitation of the oceans has led to an increased demand for accurate seafloor information maps—the
information required for both the seafloor topography and the distribution of the seafloor composition.
The problem is the unavailability of nautical charts, which contain necessary and complete seabed
sediment information, or seabed sediment maps that are complete and accurate.

              Content from this work may be used under the terms of the Creative Commons Attribution 3.0 licence. Any further distribution
              of this work must maintain attribution to the author(s) and the title of the work, journal citation and DOI.
Published under licence by IOP Publishing Ltd                          1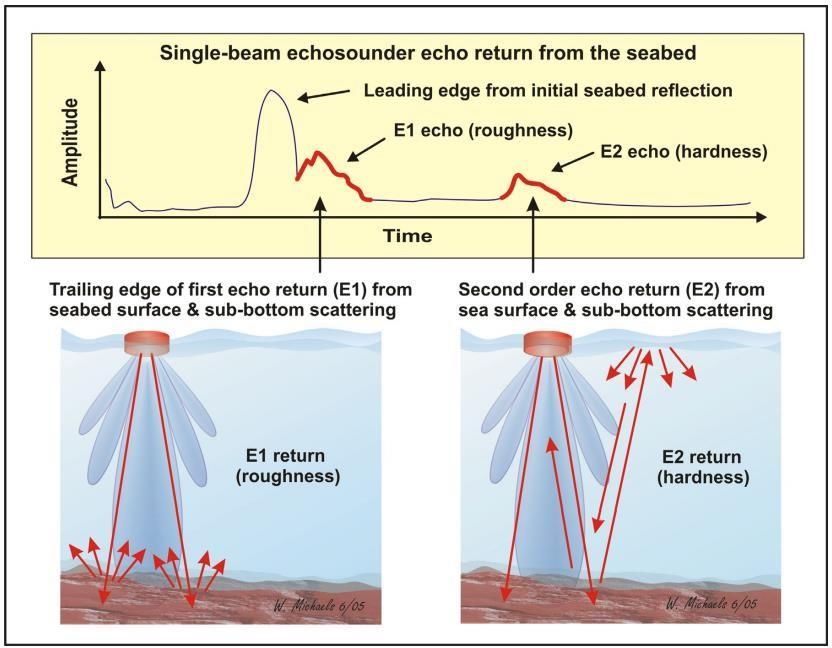
Geomatics International Conference 2020                                                     IOP Publishing
IOP Conf. Series: Earth and Environmental Science 731 (2021) 012039     doi:10.1088/1755-1315/731/1/012039

    The need for very accurate seabed sediment maps near the coastal waters is increasing. It will take
more than one century before mapping based on modern means [2]. The solution proposed here is to
start from a rough knowledge established with the past and gradually supplement it with the more recent
technology to make a seabed sediment map. Seabed sediment mapping methods have developed rapidly
from year to year and from mechanical to acoustic methods. This paper explains the evolution of seabed
sediment mapping technology and future development to accelerate the availability of complete and
accurate seabed sediment maps.

2. Sediment Mapping Method
2.1 Sediment and Sedimentation
Sediment is solid particles such as sand produced by the natural process of erosion and weathering,
transported to other locations by the actions of wind, water, ice, and mass wasting, all operating under
gravity [3]. Eventually, sediment settles out and accumulates after transport; this process is known as a
deposition. Sedimentation is a general term for the processes of erosion, transport, and deposition. There
are three basic types of sediment: rock fragments (clastic sediments), mineral deposits (chemical
sediments), and organic matter (biological sediments) [4]. This paper will focus on clastic sediment,
which has three primary grain sizes: gravel, sand, and mud. Gravel refers to grains greater than 2 mm in
size, sand refers to grains less than 2 mm but greater than 63 µm in size, and mud refers to grains less
than 63 µm in size. These three significant classes can be subdivided further using the Udden-Wentworth
grain size scale [5].

                  Table 1. Sediment Grain Sizes [5]
                          Class terms (x)         Particle Type         Size (mm)
                             Boulders                                      >256
                             Cobbles                                   256 ≤ x < 64
                                                      Gravel
                             Pebble)                                     64 ≤ x < 4
                             Granules                                    4≤x
Geomatics International Conference 2020                                                      IOP Publishing
IOP Conf. Series: Earth and Environmental Science 731 (2021) 012039      doi:10.1088/1755-1315/731/1/012039

better for collecting fine-grained cohesive sediments, such as mud and clay, than non-cohesive sediment
such as sand, cone shells, and gravel. These are usually easy to deploy (even from small vessels and in
rougher sea conditions) and can give a very large sample.

                                    Figure 1. Van Veen Grab Sampler

    There are several drawbacks to seabed sediment sampling using a grab sampler. The first weakness
is the limitation of this tool in taking the bottom sediment only for shallow waters. The deeper the waters,
the more difficult it is to collect bottom sediment because the more in-depth the pressure is, the difficulty
in taking sediment samples, incredibly hard sediments such as sand, rock, and gravel. The second is that
this tool has difficulty extracting sediment samples that are too soft, such as silt and clay, so that the
sediment is more comfortable releasing (loss of fine sediments). Another disadvantage is the low
accuracy of determining the seabed sediment position. At the time of sampling, the ship's position had
shifted to another location due to currents, waves, or something else. Besides, this tool cannot provide
information on seafloor conditions, and samples only give information about the seabed surface.
    Furthermore, a larger sampler will require a winch for deployment. It needs a time-consuming and
costly process to analyze these samples in a laboratory [7] [8] [9]. The drawback of seabed sediment
retrieval with the grab sampler is that it is static data retrieval, requiring a considerable time to create a
seabed sediment map with many samples. The higher spatial resolution of seabed sediment it needs
many sampling points (Figure 2). The more sample points cause the length of the observation time and,
consequently, the more expensive. [10] shows the spatial distribution of the sediment textural data in
Tauranga Harbour derived from grab samples (Figure 2). The color-coded clusters group similar
sampling sites and does not mean representing the actual sediment class boundaries of the area.

                         Figure 2. Seabed sediment map from grab samples [10]

                                                       3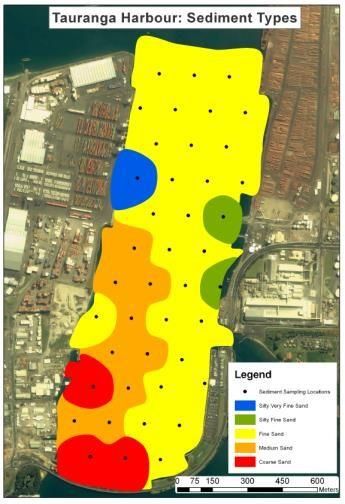
Geomatics International Conference 2020                                                    IOP Publishing
IOP Conf. Series: Earth and Environmental Science 731 (2021) 012039    doi:10.1088/1755-1315/731/1/012039

2.2.2 Sediment Cores
Unlike the grab sediment sampler, core sediments can take sediment on the seabed surface and capture
the stratigraphic layers with depth. Several types of sediment cores: gravity corers, multiple gravity
corers, hydraulically damped corers, box corers, piston corers, freeze corers, Vibro corers, and drilling.
Their application depends on environmental conditions and desired research [7]. Gravity core (Figure
3) is the type most often used to collect seabed sediments. It can quickly and continuously pick up
bottom sediments to several thousand meters from the seafloor [8]. It can also be operated with various
types of vehicles. The gravity core application is for dredging, offshore oil and gas engineering, pipeline
and cable routes, and is very useful for controlling soil types in geophysical surveys.
    Like the sediment grab sampler, this gravity core also has the same disadvantage if used for necessary
seabed sediment mapping. It cannot produce continuous primary sediment data so that the more samples
needed, the more time is required, and ultimately the costs incurred are also more significant. Gravity
corers are only really suitable for collecting very soft to hard clays because penetration in hard clays or
sand is usually limited [7]. Furthermore, the samples obtained are generally of average to moderate
quality. Core samples are not easy to acquire as grab samples. These techniques can be expensive since
they require dedicated ships and equipment, lengthy measurements, and a labor-intensive analysis
afterward. Not only is the acquisition more expensive, so the core analysis and storage [8] [9]. Another
essential drawback is that these techniques provide information on point positions only. As in the grab
sampler (Figure 2), the seabed sediment distribution map from the gravity core has a low spatial
resolution. The denser the sample points will produce a high resolution and vice versa. However, the
closer the sample points are, it will take a long time and be expensive.

                                         Figure 3. Gravity Core

2.3 Acoustic System Techniques
Remote sensing techniques based on acoustic waves such as single beam echosounder, side-scan sonar,
and multibeam echosounder have provided technological solutions for seabed mapping such as mapping
ocean depths and seabed features. Underwater acoustics is applied as one of the most efficient and
accurate applications to understand the seabed characteristics and locate and identify marine objects in
an accurate way [11]. One of the studies that have developed over time is the mapping or classification
of seabed sediments in various areas with various spatial scale variations that aim to support marine
areas' management. The sound scattering theory from the ocean floor emphasizes the different
theoretical models currently in use and ongoing evolution [12].

2.3.1 Single Beam Echo Sounder
The principle of single beam echo sounder (SBES) generates an acoustic pulse that travels through the
water column, is reflected off the seabed, and is received back on board the vessel by a transducer

                                                     4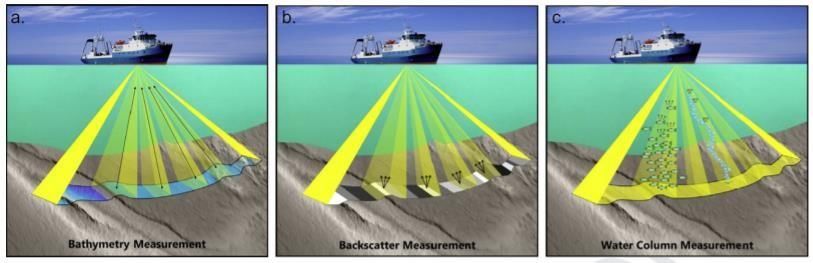
Geomatics International Conference 2020                                                    IOP Publishing
IOP Conf. Series: Earth and Environmental Science 731 (2021) 012039    doi:10.1088/1755-1315/731/1/012039

(Figure 4) [13]. SBES can measure only one point per acoustic echo wave emitted. The specifications
of SBES are defined by beam angle and frequency of the transmitted acoustic wave from the transducer.
The sounder generates an acoustic pulse that travels through the water column. It is reflected off the
seabed and received back on board the vessel by the transducer.

                         Figure 4. Acoustic Depth Measurement Principle [13]

   The SBES systems offer relatively low acquisition costs, easy to use, ready availability and wide use,
data processing efficiency, relative ease of understanding and operations, water-column backscatter
availability, and use of multiple frequencies during a single survey [14] [15]. SBES data acquisition is
only acquired directly underneath the transducer (Figure 4). SBES operations generally conduct
systematic grid surveys and sometimes incorporate an adaptive star-like cruise track in selected shoal
regions (Figure 5) [11]. Survey lines are run perpendicular to the coastlines, and the line spacing between
the survey lines is dependent on the scale of the final product and resolution required (Figure 5). The
shorter the distance between the survey lines from one another, the greater the resolution, but it takes
longer. Furthermore, the features and possible hazards that lie between the survey lines will be omitted
from the final product, and the resolution is of far lower quality [16] [17]. Besides, a single beam data
resolution depends on the vessel's speed because the measurement directly under the vessel is obtained.
Therefore, it is rather time-consuming to generate a region's 2D grid using a single-beam echo sounder.
This instrument tends to be more suited to obtaining multiple 1D transects [18].

                                Figure 5. SBES Grid Survey Lines [11]

   Generally, the main objective of a single beam echosounder survey is for seabed mapping
(bathymetry). It can also detect empirically the type of bottom sediment used to predict coral sediments
[16]. The single-beam echo sounder generates a seabed acoustic response to classify seabed sediments.
The acoustic energy redirected to the transducer is called backscatter and affected by the seabed and
sub-seabed. The backscatter strength (BS) quantifies the amount of acoustic intensity scattered back to
the sonar receiver following a complex interaction of the transmitted signal with the seafloor. It results
from an intricate combination of several physical factors: frequency, impedance contrast, roughness, the

                                                     5
Geomatics International Conference 2020                                                    IOP Publishing
IOP Conf. Series: Earth and Environmental Science 731 (2021) 012039    doi:10.1088/1755-1315/731/1/012039

sediment volume, and incidence angle [19]. Due to the various scattering properties of different seafloor
substrates, backscatter can help determine the bottom type [20] [21] and possibly to infer some of its
physical characteristics. The seabed characteristics, the sea surface's physical properties, or sea
subsurface material influence the signal's shape [11]. An acoustic signal intensifies sediment seabed
classification with SBES systems. Some factors will influence the reflected signal, such as hardness,
roughness, and angle of acoustic incidence, which is affected by the seafloor's slope.
   Figure 6 [11][22] shows that seabed sediment responds to SBES Signal. The length and intensity of
the tail of the first echo (E1) and the intensity of the second echo (E2) can often be used to differentiate
soft, hard, and rough habitats. These indices have often been related to seabed roughness and hardness,
respectively. The first echo (E1) and the second echo (E2) intensity can often differentiate soft, hard,
and rough habitats. These indices relate to seabed roughness and hardness, respectively. The first echo
corresponds with grain size, topography, and seabed surface attenuation, such as large grain size or
rough bottom, reflecting a narrow E1 envelope of higher amplitude. The E2 varies when the sound wave
penetrates the seabed surface and is reflected by a substrate layer of different density. The attenuation
of sound increases a higher density medium, such as when sound propagates from water to the seabed.
The resulting backscatter intensity from a seabed made up of rock is significantly greater than that from
a sandy substrate.

                    Figure 6. Roughness dan Hardness Responses of Seabed Sediment [22]

   Another factor of influence reflected signal is the seabed angular response, which can vary within
the acoustical footprint, and higher reflectivity is expected at nadir. Hence, the width of the footprint,
angle of incidence, and the angular response from the seabed enhances the ability to discriminate the
categories of seabed grain size (sand, gravel, and cobble). The optimal angular responses of SBES signal
for classifying seabed made up of sand, gravel, and cobble occur at grazing angles ranging about 7–20°
depending on the source level, frequency, pulse length, and operational range of the system [22]. Figure
7 [23] shows a seabed sediment map derived from a single beam echo sounder.

                                                     6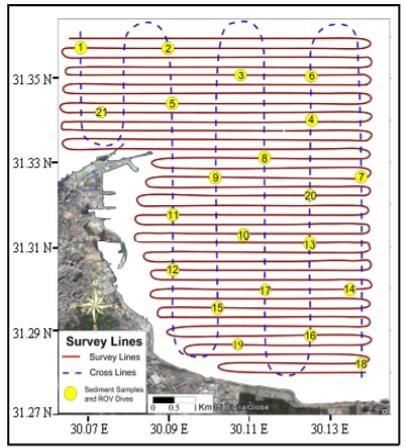
Geomatics International Conference 2020                                                   IOP Publishing
IOP Conf. Series: Earth and Environmental Science 731 (2021) 012039   doi:10.1088/1755-1315/731/1/012039

                         Figure 7. Seabed Sediment Map using Backscatter SBES [23]

2.3.2 Side Scan Sonar
Side-scan sonar (SSS) is one of the most potent types of equipment for underwater observation because
it can efficiently measure a large area and produce a detailed image (high-resolution image) of anything
on the seafloor. This equipment can conduct seabed mappings such as nautical charts, detection, and
identification of underwater objects. It can also detect debris and other obstructions on the seabed that
may be hazardous to shipping or seafloor installations for subsea field development [24] [25] [26] [27].
The SSS is examined as the most relevant acoustic device able to produce seafloor imagery by pulse
emission of acoustic energy. The system amplifies and records the backscatter intensity of the seabed,
generating the sonograph. It may be considered analogous to a continuous aerial photograph [25]. The
SSS is most likely to provide the best high-resolution maps, particularly over vast areas. They provide
information on sediment texture and bedform structure and allow dynamic processes (e.g., sediment
transport) to be deduced [24]. Side-Scan Sonars are widely used in seafloor imagery, should remain
short and also its ease of deployment: in some cases, they have a tow-fish structure, so there is no need
for elaborate mountings on Autonomous Underwater Vehicles (AUV), Remotely Operated Vehicles
(ROV) or ships [26].
    Several factors affect the precision and accuracy of SSS images. For instance, the horizontal extent
of the image is affected by the frequency and grazing angle, determined by the transducer's altitude
above the seabed. Another factor is seabed conditions and altitude above the bed, a range of 300 m can
be obtained at a frequency of 117 kHz and typically 150 m at a frequency of 234 kHz. Accuracy
increases with decrease range. For example, 0.1 m accuracy is typically obtained at a range of 50 m
(100 m swath), while only 0.3 m accuracy is received at 150 m [24] [28]. The disadvantage of side-scan
sonar is its horizontal positioning of the tow-fish side-scan sonar. Although its position has used GNSS
RTK, the position of tow fish that is moving or unstable causes, the resulting position is less accurate
(Figure 8) [29]. Another disadvantage is, the more in-depth the ocean, the longer the cable needs to get
clear and accurate objects in the sea bottom [28]. Side-scan sonar does not usually produce bathymetric
data, so it must be combined with a single beam echo sounder (SBES) to get accurate depth [17].
Disadvantages associated with swath systems are their high costs and the need to have skilled
interpretation. The output often requires considerable post-processing time and expense to obtain
appropriate classifications [24].

                                                     7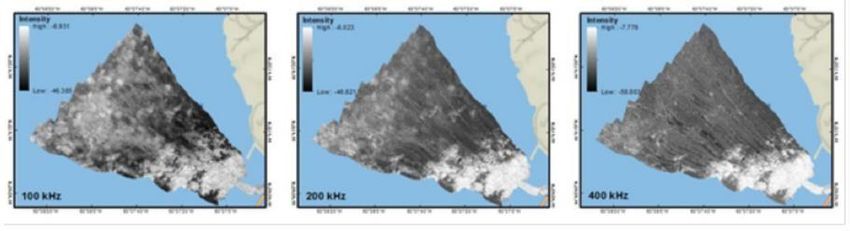
Geomatics International Conference 2020                                                   IOP Publishing
IOP Conf. Series: Earth and Environmental Science 731 (2021) 012039   doi:10.1088/1755-1315/731/1/012039

                                Figure 8. Tow-fish Side Scan Sonar [29]

   The side-scan sonar scanning and combination with a certain amount of sediment sampling are the
primary means of a survey. By analyzing the backscattered return signals of side-scan sonar and
sediment sampling using grab sampler or sediment core, fine particles (clay and silt), coarse particles
(sand soil), bedrock, and distinguish other types of sediment. For example, a seafloor sediment
distribution map can be seen in Figure 9 [30].

             Figure 9. Seabed sediment map of the Outer Thames Estuary REC area [30]

2.3.3 Multibeam Echosounder
Multibeam Echosounder (MBES) is an acoustic instrument that can measure the seabed depth in more
than one location with one beam (ping) [31]. The MBES systems measure the depth in a line extending
outwards from the sonar transducer. The methods acquire data in a swath at right angles to the direction
of the transducer head's motion, and the head moves forward, these profiles sweep out a ribbon-shaped
surface of depth measurement known as a swath (Figure 10) [32] [18]. Therefore the MBES can map
the seabed by a fan of narrow acoustic beams, thus providing 100% coverage of the bottom search to
comply with special order by the International Hydrographic Organization's performance standards, S-
44 edition 5. The MBES produce seabed maps are more detailed than those obtained using SBES, and
the image data similar to a side-scan sonar image. Besides, the MBES dataset is useful for characterizing
the seabed material properties and sometimes can detect small objects not visible in the sounding data
because the MBES' ability to co-register high-density echo time, geometrical features, and intensity over
large seabed swaths, providing depth and intensity data [24].

                                                     8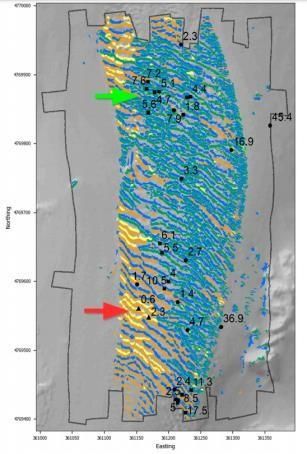
Geomatics International Conference 2020                                                   IOP Publishing
IOP Conf. Series: Earth and Environmental Science 731 (2021) 012039   doi:10.1088/1755-1315/731/1/012039

                                 Figure 10. Sounder sonar system swathe [32]

The cost of survey equipment using MBES is far more expensive than the SBES survey because the
MBES survey equipment is far more complex and complete than SBES. However, conducting much
faster surveys compensate for these expensive costs, saving the ship's reduced operating time. The
spatial resolution of the data produced is also much denser compared to SBES. Another weakness of
this MBES is the large data volume and requires complex calibration (pitch, yaw, roll, and sound speed
profile) [18].
    Initially, the multibeam echo sounder still focuses on the bathymetry mapping to fulfill the
acquisition and accuracy of depth measurements IHO standard [33]. There is three main attraction of
the MBES as the wide-area seabed coverage offered by the swath system. The first is a single trajectory
of the survey platform, providing superior navigational data compared to SBES, which ultimately
reduces the risk to surveyors at sea Figure 11 (a). In addition to the need for bathymetric mapping by
sweeping the entire mapped area (full coverage), MBES can also be used for seafloor sediment mapping
using backscatter (Figure 11 (b)) the acoustic signal it emits. The MBES backscatter is similar to the
backscatter side-scan sonar [34]. It can be used to classify the seabed in the form of hardness and
roughness characteristics and are precious measurements when studying the seabed sea surface's
geology. Besides, acoustic wave returns can also be detected from objects in the water column such as
fish, gas bubbles, sediments, etc. (Figure 11 (c)).

    Figure 11. MBES application (a) bathimetri, (b) backscatter (c) water coloumn (Colbo, 2014)

    Recently, MBES' backscatter intensity from the seafloor has attracted interest due to its ability to
map the water-sediment-interface constituency. MBES can also be used for mapping seabed sediments
by utilizing backscatter acoustic signals that emit. The acoustic wave backflow is an acoustic wave
emitted by a transducer (transmitter-receiver) into the seabed sediments. It produces a portion of the
reflected signal (backscattering) that is taken back by the transducer. The return signal's amplitude
obtains the seabed reflectivity where high reflectivity indicates hard bottom sediments such as sand and
gravel, and low reflectivity indicates soft seabed sediments such as mud and clay. MBES can
characterize seabed sediments using geo-acoustic properties such as grain size, roughness, sound
velocity, and porosity [35]. Indirect backscatter measurements and their comparison with theoretical
models can determine the sediment character [36]. This backscatter is usually higher in rigid substrates,
such as rock, and weaker in soft sediments such as mud [37]. MBES data supported by seabed sediment
sample data taken with grab sampler or gravity core can produce a map of continuous base sediment
distribution and has a better resolution compared to other data currently available (Figure 12) [10].

                                                     9
Geomatics International Conference 2020 IOP Publishing
IOP Conf. Series: Earth and Environmental Science 731 (2021) 012039 doi:10.1088/1755-1315/731/1/012039
Figure 12. Seafloor Sediment Mao Using Backscatter MBES [10]
2.4 Future trend of seabed sediment mapping and the opportunity application in the tropical coastal
waters
Seafloor sediment mapping, as explained in the previous section, can be determined by mechanical
methods such as grab sampler and gravity core, and also acoustic methods such as side-scan sonar (SSS),
single-beam echo sounder (SBES), and multibeam echosounder (MBES). Each of these methods has
advantages and disadvantages that complement each other. More acoustic methods are currently used
with field data validation results from grab samplers and gravity cores analyzed in the laboratory. The
acoustic method used in SSS, SBES, and MBES utilizes a backscatter or reflected wave from the seabed
to the transducer (receiver). [38] use a reflective wave called reflectivity-based estimator for seafloor
segmentation (BRESS). BRESS offers a new approach to quantitative analysis of seafloor sediment
mapping data automatically, free of scale, reliable, and with efficient computing to segment the seabed
(Figure 13).
Figure 13. BRESS method for seafloor sediment segmentation [38].
Often the seabed sediment mapping that depends on environmental variables uses single scale data.
[39] evaluated seafloor sediment mapping's potential using various scales (multiscale). The results of
his study indicate that the data resolution of each terrain variable is not necessarily at the right scale to
explain the grain size distribution of seabed sediments (Figure 14). A broader scale backscatter is the
essential variable for distinguishing gravel from the sand. Based on the scale-dependent variables in this
study, [39] concluded that the consideration of spatial scale is at least as important as selecting variables
in the mapping of seafloor sediments.
10Geomatics International Conference 2020 IOP Publishing
IOP Conf. Series: Earth and Environmental Science 731 (2021) 012039 doi:10.1088/1755-1315/731/1/012039
Figure 14. Seafloor Sediment Map using multiscale Backscatter [39]
Like the processing of signals on remote sensing imagery satellites using electromagnetic waves,
MBES backscatter data processing to obtain classification results with high-resolution images,
researchers generally use Pixel Based (PB) and Object-Based (OB) methods. [40] try to classify high-
resolution MBES data by combining PB and OB. The results show that classification with PB and OB
combinations produces a significantly more accurate base sediment map than PB classification alone or
OB alone (Figure 15).
Figure 15. Seafloor sediment classification PB (left), OB (center) and PB and OB combination (right)
[40]
In 2016, R2Sonic LLC produced a new variant of the MBES R2Sonic 2026, which allows more than
one frequency (100 kHz, 200 kHz, and 400 kHz) to be modified on a ping-by-ping basis. This MBES
product is the first product that can simultaneously (Figure 16) to collect data simultaneously from
several frequencies at once in one data collection from the MBES system [41] [42].
Figure 16. MBES Multi Frequency based on ping by ping [41]
The MBES multi-frequency survey results of each processed frequency can be combined (mosaic)
with each other [41] [42]. Figure 17a shows the different backscatter intensity profiles of different
frequencies at the same location. [41]and [42] evaluated the use of multi-frequency MBES (100 kHz,
200 kHz, and 400 kHz) to produce multispectral backscatter in a single survey measurement (Figure
17b). The basic idea of using multi-frequency is like a remote sensing satellite using multiple
wavelengths (multispectral). The use of multispectral aims to improve seafloor sediment mapping
results using MBES. The advantages of using MBES multispectral backscatter compared to single-
frequency backscatter [43] is to provide more detailed information about seabed sediments, can be used
11Geomatics International Conference 2020 IOP Publishing
IOP Conf. Series: Earth and Environmental Science 731 (2021) 012039 doi:10.1088/1755-1315/731/1/012039
for wider acoustic wave differences, and can be used for optimal frequency selection that depends on
the environment the bottom of the sea.
(a)
(b)
Figure 17. Seafloor Sediment Map (a) Single Frequency (b) Multispectral Backscatter [41]
Ping-based multi-frequency MBES is currently the latest technology that still has many study
opportunities, especially regarding shallow waters in tropical coastal waters such as Surabaya waters.
Different frequencies with relatively simultaneous times (the difference of a few seconds from one
frequency to another) will produce a different response to water depth and bottom sediment. Future
research will examine how far the depth differs from one frequency to another to determine the
sediment's thickness. Finally, MBES multispectral backscatter combined with sub-bottom profiler data
can make 3D seabed sediment map in tropical coastal waters. Hopefully, the results can provide seabed
sediment distribution as an appropriate input for seabed sediment modeling.
3. Conclusion
Mapping of seabed sediment distribution can be done using mechanical methods (grab sampler and
gravity core) and acoustic methods (single beam echo sounder, side-scan sonar, and multibeam echo
sounder). Each method has advantages and disadvantages. Mapping of seabed sediments using
mechanical methods will result in very low resolution. The higher the resolution required, it will take a
long time and cost a lot. The acoustic method has a higher resolution than the mechanical one. The
MBES seabed sediment mapping has a higher resolution than the SBES and SSS. Recently, the
development of multi-frequency (multispectral) MBES technology has resulted in better seabed
sediment mapping results than a single frequency, providing more detailed information. The opportunity
for the multispectral MBES is still quite large, especially the mapping of seabed sediments. One of the
options to be studied is combining MBES and sub-bottom profiler data to make the 3D mapping of
seabed sediments in tropical coastal waters.
References
[1] NOAA, 1997. Nautical Chart User's Manual. U.S. Department of Commerce National Oceanic and
Atmospheric Administration (NOAA) National Ocean Service. United State of America.
[2] Garlan, T., Gabelotaud, I, Lucas, S, Marchès, E., 2018. A World Map of Seabed Sediment Based on
50 Years Knowledge. New York USA Jun 03-04, 2018, 20 (6) Part I.
[3] Awal, R., Sapkota, P., Chitrakar, S., Thapa, B.S., Neopane, H.P., Thapa, B., 2019. A General Review
on Methods of Sediment Sampling and Mineral Content Analysis. IOP Conf. Series: Journal of
Physics: Conf. Series 1266 (2019) 012005.
12Geomatics International Conference 2020 IOP Publishing
IOP Conf. Series: Earth and Environmental Science 731 (2021) 012039 doi:10.1088/1755-1315/731/1/012039
[4] Holden, J., 2008. An Introduction to Physical Geography and the Environment. Se ond edition.
Pearson Education Limited.
[5] Wentworth, C., 1922, A scale of grade and class terms for classic sediments, J. Geol. 30, 377–392.
[6] Hails J.R., 1982. Grab samplers. In: Beaches and Coastal Geology. Encyclopedia of Earth
Science. Springer, Boston, MA.
[7] IAEA, 2003. Collection and Preparation of Bottom Sediment Samples for Analysis of Radionuclides
and Trace Elements. IAEA-TECDOC-1360. Nutritional and Health-Related Environmental
Studies Section International Atomic Energy Agency. Austria
[8] Danson, E., 2005. Geotechnical & Geophysical Investigations For Offshore And Nearshore
Developments International Society For Soil Mechanics And Geotechnical Engineering. Swan
Consultants Ltd
[9] Coggan, R., Populus, J., White, J., Sheehan, K., Fitzpatric, F and Pile S. 2007. Review of standards
and protocols for seabed habitat mapping. MESH
[10] Boulay, S. O.C., 2012. Analysis of Multibeam Sonar Data for Benthic Habitat Characterization of
The Port of Tauranga, New Zealand. Thesis. The University of Waikato
[11] Hamouda A, EL-Gendy N, El-Gharabawy S, Salah M (2015) Acoustic Survey along Heraklieon
and East Canopus Ancient Greek Cities, Abu Quir Bay, Alexandria, Egypt. J Earth Sci Clim
Change 6: 289. doi:10.4172/2157- 7617.1000289
[12] Anderson, J.T., Holliday, D.V., Kloser, R., Reid, D.G., Simard, Y., 2008. Acoustic seabed
classification: current practice and future directions. CES Journal of Marine Science, Volume 65,
Issue 6, September 2008, Pages 1004–1011,
[13] US Army, 2013, Engineering and Design Hydrographic Surveiing Department of The Army. EM
1110-2- [22] Kenny, AJ, Cato, I, Desprez, M, Fader, G, Schuttenhelm, R.T.E., Side, J., (2003).
"An overview of seabed-mapping technologies in the context of marine habitat classification."
ICES Journal of Marine Science 60:411–418.
[14] Foster-Smith, B., Brown, C., Meadows, B., Rees, I. 2001. Procedural Guidelines 1-3 Seabed
mapping using acoustic ground discrimination interpreted with ground truthing. Marine
Monitoring Handbook March 2001. Joint Nature Conservation Committee. 183-197.
[15] Foster-Smith, R., Sotheran, I.S. 2003. Mapping marine benthic biotypes using acoustic ground
discrimination systems. International Journal of Remote Sensing. 24: (13) 2761-2784.
[16] Boyd, S.E., Coggan, R.A., Birchenough, S.N.R., Limpenny, D.S., Eastwood, P.E., Foster-Smith,
R.L., Philpott, S., Meadows, W.J., James, J.W.C., Vanstaen, K., Soussi, S., Rogers, S., 2006. The
role of seabed mapping techniques in environmental monitoring and management. Sci. Ser. Tech
Rep., Cefas Lowestoft, 127: 170pp.
[17] Kearns, T.A., Breman, J., 2010. Bathymetry: The Art and Science of Seafloor Modeling for Modern
Applications. In: Breman, J. (Ed.), Ocean Globe. ESRI Press, Redlands, ISBN 978-1-58948-219-
7. 274.
[18] Neill, S. P., Hashemi, M. R., 2018. In Situ and Remote Methods for Resource Characterization.
Fundamentals of Ocean Renewable Energy, 157–191.
[19] Lurton, X., 2010. An introduction to underwater acoustics—principles and applications, 2 edn.
Springer, Berlin
[20] de Moustier, C., Alexandrou, D., 1991. Angular dependence of 12-kHz seafloor acoustic
backscatter. J Acoust Soc Am 90:522–531
[21] Hughes-Clarke, J.E, Mayer, L.A, Wells, D.E., 1996. Shallow-water imaging multibeam sonars: a
new tool for investigating seafloor processes in the coastal zone and on the continental shelf. Mar
Geophys Res 18:607–629
[22] Anderson, J. T., Holliday, D. V., Kloser, R., Reid, D., Simard, Y., Brown, C. J., et al. (2007).
Acoustic seabed classification of marine physical and biological landscapes: International
Council for the Exploration of the Sea.
[23] Snellen, M., Siemes, K., Simons, D.G., 2011. Model-based sediment classification using single-
beam echosounder signals. J. Acoust. Soc. Am. 129.
13Geomatics International Conference 2020 IOP Publishing
IOP Conf. Series: Earth and Environmental Science 731 (2021) 012039 doi:10.1088/1755-1315/731/1/012039
[24] Kenny, AJ, Cato, I, Desprez, M, Fader, G, Schuttenhelm, R.T.E., Side, J., (2003). "An overview of
seabed-mapping technologies in the context of marine habitat classification." ICES Journal of
Marine Science 60:411–418.
[25] Blondel, P., (2009). The Handbook of Side-scan Sonar. Springer Verlag
[26] Burguera, A., Oliver, G., 2016. HighResolution Underwater Mapping Using Side-Scan Sonar.
PLoS ONE 11(1): e0146396.
[27] Bai, Y., Bai, Q., 2019. Subsea Surveying, Positioning, and Foundation, Subsea Engineering
Handbook (Second Edition), Gulf Professional Publishing. ISBN 9780128126226
[28] Savini, A., 2011. Side-Scan Sonar as a Tool for Seafloor Imagery: Examples from the
Mediterranean Continental Margin, Sonar Systems, N. Z. Kolev, IntechOpen.
[29] Morales, J.A., Delgado, I., 2016. Side-Scan Sonar Imaging of Sediment Bedload. In: Kennish
M.J. (eds) Encyclopedia of Estuaries. Encyclopedia of Earth Sciences Series. Springer,
Dordrecht.
[30] Selby, I., Henden, E., Jones,D.F., Dix, J.K., 2009., Outer Thames Estuary Regional Environmental
Characterisation Marine Aggregate Levy Sustainability Fund (MALSF) 1003 US Army Corps of
Engineers CECW-CE/CECW-OD Washington, DC 20314-1000
[31] SeaBeam., 2000. Multibeam Sonar Theory of Operation. L-3 Communications SeaBeam
Instruments 141 Washington Street East Walpole, MA 02032-1155
[32] Hopkins, A. 2007. Recommended operating guidelines (ROG) for swath bathymetry. MESH.
Mapping European Seabed Habitat.
[33] IHO, 2008. SP-44
[34] Colbo, K., Ross, T., Brown, C., Weber, T. 2014. A review of oceanographic applications of water
column data from multibeam echosounders. Estuarine, Coastal and Shelf Science Volume 145, 20
May 2014, Pages 41-56
[35] Brown, C.J., Blondel, P. 2008. Developments in the Application of Multibeam Sonar Backscatter
for Seafloor Habitat Mapping. Applied Acoustics. Elsevier. Geosciences. MDPI
[36] Fonseca,L., Mayer, L.A., 2007. Remote Estimation of Surficial Seafloor Properties through the
Application Angular Range Analysis to Multibeam Sonar Data. Mar Geophys Res:119–126
[37] Pratomo, D.G., Khomsin, Cahyadi, M.N., Akbar, K and Aprilia, E. 2018. Analysis of Seafloor
Sediment Distribution using Multibeam Backscatter Data. MATEC Web Conf. Volume 177,
2018. The 5th International Seminar on Ocean and Coastal Engineering, Environmental and
Natural Disaster Management (ISOCEEN 2017)
[38] Masetti, G., Mayer, L.A., Ward, L.G., 2018. A Bathymetry- and Reflectivity-Based Approach for
Seafloor Segmentation. Geosciences. MDPI
[39] Misiuk, B., Lecours, V., Bell, T., 2018. A Multiscale Approach to Mapping Seabed Sediments.
PLOS ONE
[40] Ierodiaconou, D., Schimel, A.C.G., Kennedy, D., Monk, J., Gaylard, G., Young, M., Diesing, M.,
Rattray, A., 2018. Combining pixel and object based image analysis of ultra-high resolution
multibeam bathymetry and backscatter for habitat mapping in shallow marine waters. Marine
Geophysical Research 1-18.
[41] Brown, C.J., Beaudoin, J., Brissette, M., Gazzola, V., 2017. Setting the Stage for Multispectral
Acoustic Backscatter Research. WHITE PAPER. R2Sonic.
[42] Brown, C.J., Beaudoin, J., Brissette, M., Gazzola, V. 2019. Multispectral Multibeam Echo Sounder
Backscatter as a Tool for Improved Seafloor Characterization. Geosciences. MDPI
[43] Gaida, T.C., Ali, T.A.T., Snellen, M., Simkooei, A.A., van Dijk, T.A.G.P, Simons, D.G., 2018. A
Multispectral Bayesian Classification Method for Increased Acoustic Discrimination of Seabed
Sediments Using Multi-Frequency Multibeam Backscatter Data.
14You can also read