The National Hurricane Center and Forecasting Hurricanes: 2017 Overview and 2018 Outlook - Peter Folger Specialist in Energy and Natural Resources ...
←
→
Page content transcription
If your browser does not render page correctly, please read the page content below
The National Hurricane Center and
Forecasting Hurricanes:
2017 Overview and 2018 Outlook

Peter Folger
Specialist in Energy and Natural Resources Policy

Updated August 23, 2018

                                                    Congressional Research Service
                                                                          7-5700
                                                                     www.crs.gov
                                                                           R45264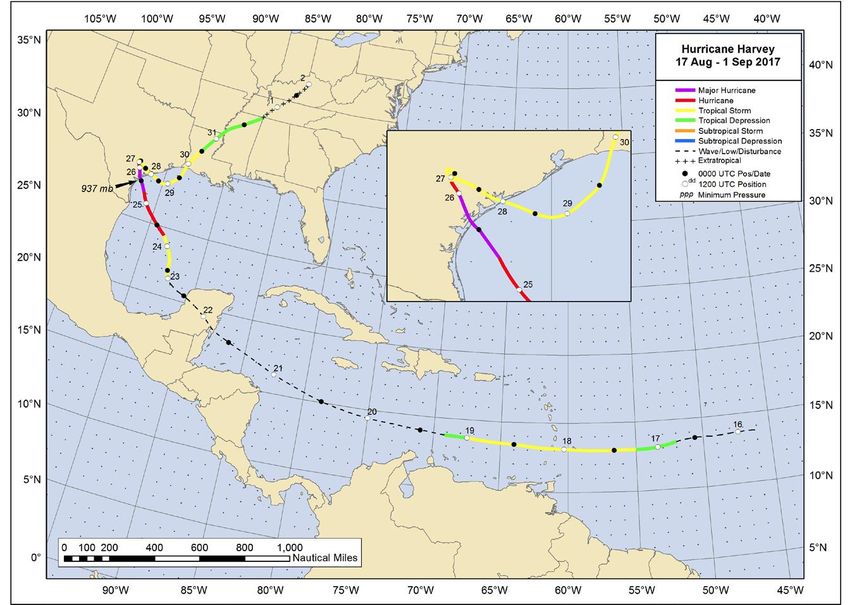
NHC and Forecasting Hurricanes: 2017 Overview and 2018 Outlook

Summary
The National Hurricane Center (NHC), part of the National Oceanic and Atmospheric
Administration’s (NOAA’s) National Weather Service (NWS), is responsible for forecasting
hurricanes in the Atlantic Ocean and the eastern Pacific Ocean. The NHC provides estimates of
the path of a storm (i.e., hurricane track), the intensity, and the size and structure of the storm, as
well as predictions of storm surge, rainfall, and even tornadoes. Depending on the storm’s status,
this information may be used to create a hurricane watch or a hurricane warning and public
advisories, which are issued on an increasingly frequent basis if a storm strengthens and
approaches the U.S. coastline.
Three major hurricanes struck the continental United States, the U.S. Virgin Islands, and Puerto
Rico in 2017, causing severe damage: Harvey, Irma, and Maria. Hurricane Harvey was the first
major hurricane to strike the continental U.S. coast since 2005, achieving category 4 strength
before making landfall along the Texas coast on August 25, 2017. According to the NHC, Harvey
“was the most significant tropical cyclone rainfall event in United States history, both in scope
and peak rainfall amounts, since reliable records began around the 1880s.” Hurricane Irma was
the second major hurricane to strike the continental U.S. coast in 2017, making landfall in the
Florida Keys on September 10. Irma’s large wind field produced significant storm-surge flooding
along the northeastern coast of Florida, even though the storm made landfall in southwestern
Florida. Puerto Rico was still recovering from damage caused by Hurricane Irma when Hurricane
Maria made landfall on September 20. Maria was the deadliest storm of 2017 and is widely
regarded as the worst natural disaster on record to strike Puerto Rico.
For the 2018 hurricane season, the Climate Prediction Center (CPC), within the NWS, predicted
10-16 named storms, 5-9 hurricanes, and 1-4 major hurricanes in its May 24, 2018
announcement. The August 9, 2018, update to the seasonal prediction lowered those estimates to
9-13 named storms, 4-7 hurricanes, and 0-2 major hurricanes. The updated forecast indicated a
less active Atlantic hurricane season in 2018 compared to the May prediction.
In general, forecasts of the 2017 hurricanes’ tracks were better than the previous five-year
average for track forecasts. The ability to forecast hurricane tracks has improved steadily since
the 1960s, increasing the likelihood of more accurately predicting landfall location. Better
instruments aboard weather satellites, such as the GOES (geostationary) series and the polar-
orbiting weather satellites, have contributed to these improvements, together with more
sophisticated hurricane forecast models and vastly improved computing capabilities, among other
factors.
These factors also have improved forecasts of hurricane intensity, but they have done so in
smaller increments per decade compared to improvements in track forecasts (at least until the last
decade). Forecasts of intensity for Hurricanes Harvey, Irma, and Maria proved more difficult than
forecasts of tracks; some errors in intensity forecasts for these hurricanes exceeded the previous
five-year averages for forecast errors.
Indeed, perhaps the biggest challenge for the NHC is how to improve the ability to predict
hurricane intensity. Furthermore, hurricane intensity itself is generally measured as highest
sustained wind speeds, but that measurement does not take into consideration the storm-surge or
precipitation-caused flooding, both of which may be among the most dangerous elements of a
hurricane. Superstorm Sandy, for example, produced a storm surge that inundated the heavily
populated coastline in New Jersey and New York to cause enormous damage.
On April 18, 2017, Congress enacted P.L. 115-25, the Weather Research and Forecasting Act of
2017, which provides direction to NOAA and NWS on a range of weather-related activities,

Congressional Research Service
NHC and Forecasting Hurricanes: 2017 Overview and 2018 Outlook

including hurricanes. The legislation’s broad aim is to improve weather forecasts and warnings,
and Section 104 of Title 1 specifically aims to improve hurricane forecasting. At an April 12,
2018, hearing before the Senate Committee on Commerce, Science, and Transportation, the
acting Administrator for NOAA stated that NOAA would continue to follow guidelines outlined
in P.L. 115-25 to improve the agency’s hurricane predictions. Congress likely will continue to
oversee implementation of P.L. 115-25 and may consider other legislation regarding the federal
effort to improve hurricane forecasting, especially in response to active and destructive hurricane
seasons, such as the one in 2017.

Congressional Research Service
NHC and Forecasting Hurricanes: 2017 Overview and 2018 Outlook

Contents
Forecasting Hurricanes: Role of the National Hurricane Center ..................................................... 1
    How the Process Works ............................................................................................................. 2
    Approaching the Coast .............................................................................................................. 2
    Analyzing the Data.................................................................................................................... 3
        Hurricane Track and Intensity Forecasts: Improvements and Challenges .......................... 4
    Forecasts and Warnings ............................................................................................................. 5
    Storm Surge ............................................................................................................................... 6
    Improvements and Challenges .................................................................................................. 7
2017 Atlantic Hurricane Season Overview ..................................................................................... 8
    Hurricane Harvey ...................................................................................................................... 8
        Forecasts ........................................................................................................................... 10
    Hurricane Irma ........................................................................................................................ 12
        Forecasts ........................................................................................................................... 15
    Hurricane Maria ...................................................................................................................... 16
        Forecasts ........................................................................................................................... 19
2018 Atlantic Hurricane Season Outlook ...................................................................................... 20
Issues for Congress and the Weather Act ...................................................................................... 21

Figures
Figure 1. NHC Official Average Track Errors Comparison ............................................................ 4
Figure 2. NHC Official Average Intensity Errors Comparison ....................................................... 5
Figure 3. Storm Surge and Storm Tide ............................................................................................ 7
Figure 4. Hurricane Harvey’s Track ................................................................................................ 9
Figure 5. Rainfall Forecasts for Hurricane Harvey ....................................................................... 12
Figure 6. Hurricane Irma’s Track .................................................................................................. 14
Figure 7. Hurricane Irma’s Wind Field ......................................................................................... 15
Figure 8. Hurricane Maria’s Track ................................................................................................ 18

Tables
Table 1. 2017 Atlantic Hurricane Season: Comparison Between Seasonal Outlook and
  Actual Storms ............................................................................................................................... 8
Table 2. National Hurricane Center (NHC) Official Track Forecast Errors for Hurricane
  Harvey Compared to the 2012-2016 Average ............................................................................ 10
Table 3. NHC Official Intensity Forecast Errors for Hurricane Harvey Compared to the
  2012-2016 Average...................................................................................................................... 11
Table 4. NHC Official Track Forecast Errors for Hurricane Irma Compared to the 2012-
  2016 Average .............................................................................................................................. 16
Table 5. NHC Official Intensity Forecast Errors for Hurricane Irma Compared to the
  2012-2016 Average..................................................................................................................... 16

Congressional Research Service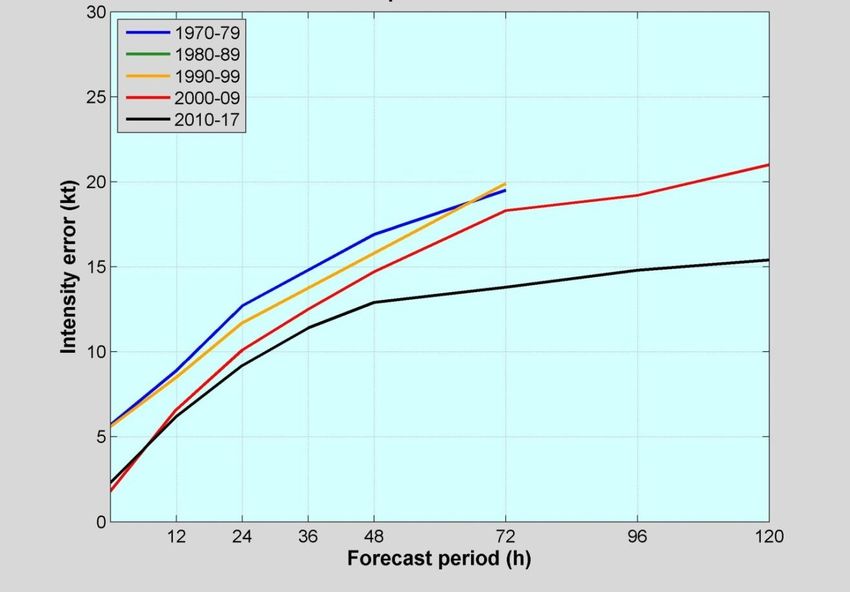
NHC and Forecasting Hurricanes: 2017 Overview and 2018 Outlook

Table 6. NHC Official Track Forecast Errors for Hurricane Maria Compared to the 2012-
  2016 Average .............................................................................................................................. 19
Table 7. NHC Official Intensity Forecast Errors for Hurricane Maria Compared to the
  2012-2016 Average..................................................................................................................... 20
Table 8. Seasonal Means and Ranges for Named Storms ............................................................. 21

Contacts
Author Contact Information .......................................................................................................... 22

Congressional Research Service
NHC and Forecasting Hurricanes: 2017 Overview and 2018 Outlook

    n 2017, three hurricanes—Harvey, Irma, and Maria—caused extensive damage to several

I   states within the continental United States and to the U.S. Virgin Islands (USVI) and Puerto
    Rico. The three storms were part of an active 2017 Atlantic hurricane season (June 1-
November 30) that produced 17 named storms, of which 10 reached hurricane strength.1 Six of
the 10 hurricanes achieved sustained wind speeds of at least 111 miles per hour (mph) and were
classified as major hurricanes (categories 3, 4, or 5 on the Saffir-Simpson Hurricane Wind
Scale).2 Hurricanes Harvey and Irma were the first storms with winds at major hurricane strength
to make landfall in the continental United States since 2005. Hurricane Maria also had major
hurricane strength winds when it struck Puerto Rico.
The potential for widespread destruction to parts of the U.S. coastline underscores the value of
timely hurricane forecasts as a means for providing early and accurate warnings to affected
communities. This report first provides a synopsis of the role of the National Hurricane Center
(NHC), part of the National Oceanic and Atmospheric Administration’s (NOAA’s) National
Weather Service (NWS), in forecasting hurricanes, and it discusses some of the advances and
remaining challenges in hurricane forecasting. The report then provides an overview of the 2017
hurricane season, with a focus on the three destructive hurricanes named above, and includes a
brief summary of the hurricane outlook for 2018.
Hurricane forecasting has been improving for decades and is one of a number of weather-related
ongoing issues of interest to Congress. A number of weather- and hurricane-related bills were
introduced over the past several Congresses, and on April 18, 2017, Congress enacted P.L. 115-
25, the Weather Research and Forecasting Act of 2017, which provides direction to NOAA and
NWS on a range of weather-related activities, including hurricanes. The broad aim of the
legislation is to improve weather forecasts and warnings, and Section 104 of Title 1 of P.L. 115-
25 specifically aims to improve hurricane forecasting. At the April 12, 2018, hearing, the acting
Administrator for NOAA stated that NOAA would continue to follow guidelines outlined in P.L.
115-25 to improve the agency’s hurricane predictions.3
Congress likely will continue to conduct oversight and consider legislation regarding the federal
effort to improve hurricane forecasting, especially in response to active and destructive hurricane
seasons, such as the one 2017.

Forecasting Hurricanes: Role of the National
Hurricane Center
The National Hurricane Center (NHC), part of the National Oceanic and Atmospheric
Administration’s (NOAA’s) National Weather Service (NWS), is responsible for forecasting

1 Storms are named when they reach tropical storm status and have sustained winds above 39 miles per hour.
2 National Oceanic and Atmospheric Administration (NOAA), National Hurricane Center (NHC), “Saffir-Simpson
Hurricane Wind Scale,” at https://www.nhc.noaa.gov/aboutsshws.php. Category 1: 74-95 miles per hour (mph);
Category 2: 96-110 mph; Category 3: 111-129 mph; Category 4: 130-156 mph; Category 5: 157 mph or higher.
3 Written testimony of Rear Admiral Tim Gallaudet, Assistant Secretary of Commerce for Oceans and Atmosphere and

Acting Under Secretary of Commerce for Oceans and Atmosphere, NOAA, in U.S. Congress, Senate Committee on
Commerce, Science, and Transportation, Are We Ready for the Next Hurricane Season?, Status of Preparation and
Response Capabilities for 2018, 115th Cong., 2nd sess., April 12, 2018.

Congressional Research Service            R45264 · VERSION 4 · UPDATED                                         1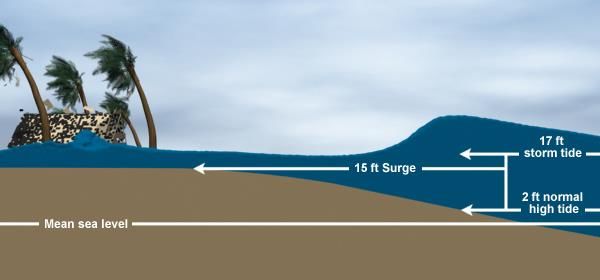
NHC and Forecasting Hurricanes: 2017 Overview and 2018 Outlook

tropical cyclones,4 including hurricanes in the Atlantic Ocean and the eastern Pacific Ocean.5 The
NHC provides estimates of the path or track of a tropical cyclone, the intensity, and the size and
structure of the storm, as well as predictions of storm surge, rainfall, and even tornadoes.6
Depending on the status of the tropical cyclone, this information may be used to create a
hurricane watch or a hurricane warning and public advisories, which are issued on an increasingly
frequent basis if a storm strengthens and approaches the U.S. coastline.7

How the Process Works
A hurricane forecast involves many components and uses a broad array of resources and
capabilities within NOAA and the NWS, all of which must be coordinated and interpreted by the
NHC.8 The process begins with observations: satellites, aircraft, ships, buoys, radar, and other
sources provide data used to create storm-track and intensity predictions. Most Atlantic
hurricanes, for example, begin to form just west of the African continent over the ocean.9 NOAA
weather satellites primarily provide the remote-sensing observations during the early stages of
tropical storm development in the eastern Atlantic. NOAA’s Geostationary Operational
Environmental Satellites (GOES) are stationed over the same location spanning North America
(two satellites make up the active GOES constellation, often referred to as GOES East and GOES
West) and provide continuous data as the storms form and intensify during their journey across
the Atlantic from Africa to North America.10

Approaching the Coast
If an Atlantic hurricane is judged to pose a threat to the U.S. coastline, NOAA hurricane aircraft
and U.S. Air Force aircraft (often referred to as Hurricane Hunters11) fly directly into the storm

4 A tropical cyclone is defined as a warm-core nonfrontal synoptic-scale (i.e., horizontal length of about 620 miles or
more) cyclone, originating over tropical or subtropical waters, with organized deep convection and a closed surface
wind circulation about a well-defined center. Cyclones rotate counter-clockwise in the Northern Hemisphere and
clockwise in the Southern Hemisphere.
5 NOAA, NHC, “About the National Hurricane Center,” at https://www.nhc.noaa.gov/aboutintro.shtml.

6 University of Rhode Island Graduate School of Oceanography, Hurricanes: Science and Society, “National Hurricane

Center Forecast Process,” at http://www.hurricanescience.org/science/forecast/forecasting/forecastprocess/. Hereinafter
University of Rhode Island, “National Hurricane Center Forecast Process.”
7 A hurricane watch is an announcement that hurricane conditions are possible within a specified coastal area, usually

issued 48 hours in advance of the onset of tropical storm force winds. A hurricane warning is issued when hurricane
conditions—sustained winds 74 mph or greater—are expected somewhere within the specified coastal area. University
of Rhode Island, “National Hurricane Center Forecast Process.”
8 The entire federal hurricane forecast effort is broader than NOAA and its sub-agencies; however, the NHC is a focal

point and this report focuses on its role. The National Hurricane Operations Plan outlines various agency
responsibilities across the federal government. See https://www.ofcm.gov/publications/nhop/nhop2.htm.
9 This report focuses on Atlantic basin hurricanes as those storms typically inflict the greatest damage to the United

States. For more information about why hurricanes threaten the U.S. east coast and not the U.S. west coast, see “Why
do Hurricanes Hit the East Coast of the U.S. but Never the West Coast?”, Scientific American, at
https://www.scientificamerican.com/article/why-do-hurricanes-hit-the-east-coast-of-the-u-s-but-never-the-west-coast/.
10 University of Rhode Island, “National Hurricane Center Forecast Process.”

11 NOAA Hurricane Hunters are specially equipped aircraft that collect data during hurricanes. The NOAA fleet

includes two Lockheed WP-3d Orion four-engine turboprop aircraft and one Gulfstream IV-SP jet aircraft. The WP-3D
aircraft fly directly into hurricanes during the storms and collect in-situ data on winds and atmospheric pressures,
among other measurements. The Gulfstream jet flies at higher altitudes and collects critical information on the
“steering” winds that affect the hurricane track, among other data. See NOAA, Office of Marine and Aviation
Operations, “NOAA Hurricane Hunters,” at https://www.omao.noaa.gov/learn/aircraft-operations/about/hurricane-

Congressional Research Service              R45264 · VERSION 4 · UPDATED                                              2
NHC and Forecasting Hurricanes: 2017 Overview and 2018 Outlook

and above the storm to collect real-time data. It is the responsibility of the Chief, Aerial
Reconnaissance Coordination, All Hurricanes (CARCAH),12 unit to coordinate all tropical
cyclone operation reconnaissance in accordance with the National Hurricane Operations Plan
(NHOP).13 Data collected from the Hurricane Hunters and other aircraft (e.g., the NASA Global
Hawk)14 are checked at CARCAH and provided to NHC forecasters. If the storm gets closer,
approximately 280 miles from the coast, land-based radars begin to provide the NHC with
precipitation and wind-velocity data. Additional ground-based measurements are provided by the
Automated Surface Observation Systems instruments when the storm is close to shore or makes
landfall.15

Analyzing the Data
The NHC gathers all the observational data as a tropical cyclone approaches the U.S. coastline
and uses the data to generate a series of hurricane forecast computer model simulations.16 The
principal purpose of hurricane forecast model simulations typically is to predict the hurricane
track (the hurricane path) and intensity (the hurricane wind speeds) over a period of three to five
days.17 Essentially, the model uses the observational data to understand the state of the
atmosphere and then uses mathematical equations to produce forecasts.
Not all hurricane forecast models are the same; they may differ in how they process information,
such as when observations are fed into the model, which equations are used, how the solutions to
the equations are used to make forecasts, and other factors. These differences explain why NHC
hurricane forecasts may differ from those of other countries or institutions that also produce
hurricane forecasts (e.g., the European Center for Medium-Range Forecasts produces Atlantic
hurricane forecasts,18 as do some research institutions within the United States, such as the
National Center for Atmospheric Research).19

hunters. The 53rd Weather Reconnaissance Squadron, a component of the 403 rd Wing of the U.S. Air Force located at
Keesler Air Force Base, Biloxi, MS, flies 10 WC-130J Hercules aircraft into hurricanes during weather reconnaissance
missions. See http://www.403wg.afrc.af.mil/About/Fact-Sheets/Display/Article/192529/53rd-weather-reconnaissance-
squadron-hurricane-hunters/.
12 CARCAH is a subunit of the 53 rd Weather Reconnaissance Squadron, U.S. Air Force (also referred to as the

Hurricane Hunters).
13 Office of the Federal Coordinator for Meteorology, National Hurricane Operations Plan, at https://www.ofcm.gov/

publications/nhop/nhop2.htm.
14 NASA, Armstrong Flight Research Center, “Global Hawk,” at https://www.nasa.gov/centers/armstrong/aircraft/

GlobalHawk/index.html.
15 University of Rhode Island Graduate School of Oceanography, Hurricanes: Science and Society, “Automated

Surface Observation Systems (ASOS),” at http://www.hurricanescience.org/science/observation/landbased/
automatedsurfaceobssystems/.
16 University of Rhode Island Graduate School of Oceanography, Hurricanes: Science and Society, “Hurricane Forecast

Models,” at http://www.hurricanescience.org/science/forecast/models/. Hereinafter University of Rhode Island,
“Hurricane Forecast Models.”
17 Hurricane intensity generally is measured as highest sustained wind speeds. However, that measurement does not

take into consideration the storm-surge or precipitation-caused flooding, both of which may be among the most
dangerous elements of a hurricane.
18 The European Centre for Medium-Range Weather Forecasts (ECMWF) is an independent intergovernmental

organization supported by 34 countries. It produces global numerical weather forecasts using weather models,
including the EMXI model referenced in the text. See ECMWF, “Advancing Global NWP Through International
Collaboration,” at https://www.ecmwf.int/.
19 University of Rhode Island, “Hurricane Forecast Models.”

Congressional Research Service             R45264 · VERSION 4 · UPDATED                                           3
NHC and Forecasting Hurricanes: 2017 Overview and 2018 Outlook
Hurricane Track and Intensity Forecasts: Improvements and Challenges
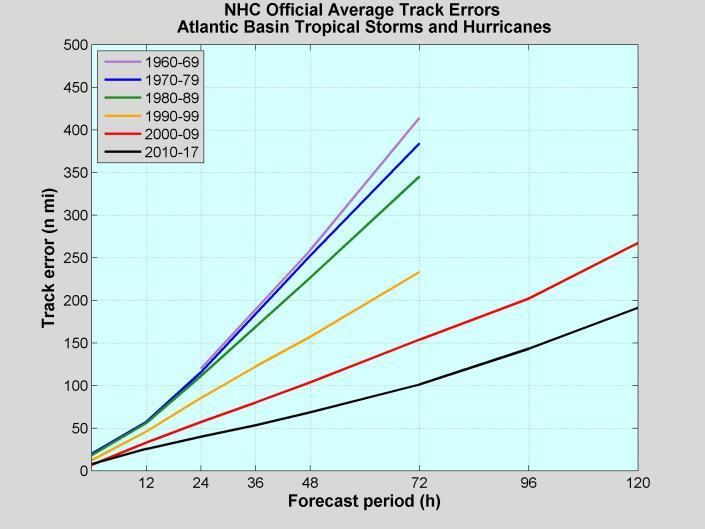
Hurricane forecasts generally are divided into two categories: hurricane track (the path of the
hurricane) and hurricane intensity (the sustained wind speed). The ability to forecast hurricane
tracks has improved steadily since the 1960s (Figure 1), increasing the likelihood of more
accurately predicting landfall location. Figure 1 shows that the track errors in the current decade
are less than half of what they were in the 1990s. Also, through the 1990s, the forecasts extended
out for only three days; today, forecasts typically extend out for five days.20 That increased
accuracy and extended timeframe provides useful information to local, state, and federal
emergency managers faced with decisions about evacuating coastlines and the need to stage
emergency equipment and supplies. Better instruments aboard weather satellites, such as the
GOES series and the polar-orbiting weather satellites, have contributed to those improvements, as
have more sophisticated hurricane forecast models and vastly improved computing capabilities.
Figure 1. NHC Official Average Track Errors Comparison
(by decade for Atlantic Basin tropical storms and hurricanes)
Source: CRS from John Cangialosi, “The State of Hurricane Forecasting,” Inside the Eye: Official Blog of the
National Hurricane Center, March 9, 2018, at https://noaanhc.wordpress.com/2018/03/09/the-state-of-hurricane-
forecasting/.
Notes: Forecast errors indicate the difference between the forecast track and the actual track in nautical miles;
(h) is hours.
20
In other words, five-day forecasts today are as good as three-day forecasts were 25 years ago, in terms of their skill at
matching forecasts with actual events.
Congressional Research Service R45264 · VERSION 4 · UPDATED 4NHC and Forecasting Hurricanes: 2017 Overview and 2018 Outlook
Until the last decade, hurricane intensity forecasts had improved in smaller increments than
hurricane track forecasts (see Figure 2). Intensity forecast errors from 2010 to 2017, the black
line in Figure 2, are about 15 knots (17 miles per hour), between 72 and 120 hours (3-5 days).
That is the largest incremental improvement since the 1970s; however, that margin of error
corresponds roughly to a difference of one hurricane category on the Saffir-Simpson Hurricane
Wind Scale. The NHC reports that it often encourages those who could be affected by a tropical
cyclone to prepare for a storm one category stronger than the forecast.21
Figure 2. NHC Official Average Intensity Errors Comparison
(by decade for Atlantic Basin tropical storms and hurricanes)
Source: CRS from John Cangialosi, “The State of Hurricane Forecasting,” Inside the Eye: Official Blog of the
National Hurricane Center, March 9, 2018, at https://noaanhc.wordpress.com/2018/03/09/the-state-of-hurricane-
forecasting/.
Notes: Intensity errors expressed as wind speed measured in knots. Forecast period shown in hours. The NHC
issues official forecasts every 6 hours, and each forecast has projections valid 12, 24, 36, 48, 72, 96, and 120
hours (h) after the forecast’s initial time.
Forecasts and Warnings
Using the results from hurricane forecast models, different components within and outside of the
NHC contribute to the hurricane forecast process. These components include the Hurricane
Specialist Unit (HSU), the Tropical Analysis and Forecast Branch (TAFB), and the Hurricane
21NHC, Inside the Eye, the State of Hurricane Forecasting, March 9, 2018, https://noaanhc.wordpress.com/2018/03/09/
the-state-of-hurricane-forecasting/.
Congressional Research Service R45264 · VERSION 4 · UPDATED 5NHC and Forecasting Hurricanes: 2017 Overview and 2018 Outlook Liaison Team (HLT).22 Of these, the HSU produces the final, official public forecast products, issued every six hours after a storm forms and more frequently if a hurricane watch or a hurricane warning is issued.23 The HSU also provides briefings on tropical storms to emergency managers and to the public, and it cooperates with meteorological services in other countries (e.g., Mexico, as well as Central American and Caribbean countries). The TAFB supports the HSU by providing tropical cyclone position and intensity estimates, conducting media interviews, and assisting in tropical cyclone operations.24 The HLT is sponsored through the Federal Emergency Management Agency (FEMA) and is comprised of federal, state, and local emergency managers, FEMA personnel, and NWS forecasters and hydrologists. On or before the beginning of hurricane season, the NHC director requests that FEMA activate the HLT, which remains active throughout hurricane season. If a tropical cyclone in the Atlantic or eastern Pacific basin threatens the United States or its territories, then the NHC can request that NWS meteorologists or hydrologists be assigned to the HLT until the storm threat has passed.25 The HLT serves as a liaison between the NHC forecasters and local emergency managers facing a threat of tropical cyclones. One of the HLT’s main functions is to communicate the threat level to federal, state, and local officials. Neither the HLT nor the NHC assumes any responsibility for issuing evacuations, however; those decisions are the responsibility of state or local officials.26 The NWS, as delegated by the Secretary of Commerce, has statutory authority for weather forecasting and for issuing storm warnings (15 U.S.C. §313). Forecasts and warnings generally are coordinated between the NWS national centers and the local forecast offices. When the NHC issues its forecast, local NWS Weather Forecast Offices use the information for their own forecasts, which take into consideration local conditions and help disseminate the forecast through its established local networks.27 Storm Surge In addition to the hurricane forecast models that predict intensity, winds, and precipitation, other forecast models are designed specifically to forecast storm surge. Storm surge is defined as an abnormal rise in sea level accompanying a hurricane or other intense storm. It generally refers to the difference between the measured level of the sea surface during the storm compared to what the sea level would have been without a storm. (See Figure 3.) Storm surge, combined with high precipitation from a hurricane, can create dangerous flood conditions for coastal communities during tropical cyclones and other intense storms. (Superstorm Sandy, for example, produced a storm surge that inundated the heavily populated coastline in New Jersey and New York to cause enormous damage, despite the storm itself being a relatively weak hurricane immediately prior to landfall.) The combination of a storm surge and high tide produces what is referred to as a storm 22 The TAFB and HSU are within the NHC; the HLT is within FEMA. 23 For more on hurricane watches and hurricane warnings, see footnote 7. 24 University of Rhode Island, “National Hurricane Center Forecast Process.” 25 NOAA, NHC, “About the National Hurricane Center,” at https://www.nhc.noaa.gov/aboutintro.shtml. 26 For more information about the Hurricane Liaison Team, see NOAA, National Weather Service, “National Hurricane Center Hurricane Liaison Team,” National Weather Service Instruction 10-603, September 21, 2016, at http://www.nws.noaa.gov/directives/sym/pd01006003curr.pdf. 27 For general information on how severe weather warnings are communicated to the public, see Forecasting and Warning: The Role of the National Weather Service, in CRS Report R40097, Severe Thunderstorms and Tornadoes in the United States, by Peter Folger. Congressional Research Service R45264 · VERSION 4 · UPDATED 6
NHC and Forecasting Hurricanes: 2017 Overview and 2018 Outlook

tide (Figure 3). A large high tide coinciding with a large storm surge can produce a large storm
tide and may cause extreme flooding in coastal areas.28
The Storm Surge Unit, part of the NHC, models and predicts storm-surge vulnerability over the
U.S. Atlantic and Gulf Coasts, Hawaii, Puerto Rico, and the U.S. Virgin Islands (USVI).29 The
Storm Surge Unit typically commences its operations when a hurricane warning is issued and, if
the hurricane threatens to make landfall, the unit continues 24 hours per day until the storm-surge
threat subsides.

                                 Figure 3. Storm Surge and Storm Tide

       Source: National Hurricane Center at https://www.nhc.noaa.gov/surge/. (Modified by CRS.)
       Notes: The 17 foot storm tide (top arrow) indicates the sum of the 2-foot normal astronomical high tide and
       the 15-foot storm surge.

Improvements and Challenges
Perhaps the biggest challenge for the NHC is how to improve the ability to predict hurricane
intensity—basically, how strong a hurricane will become and when and where it will reach its
maximum intensity (its highest sustained wind speeds). However, that measurement does not take
into consideration the storm-surge or precipitation-caused flooding, both of which may be among
the most dangerous elements of a hurricane.
Flooding resulting from high rainfall events during hurricanes could be responsible for the
majority of fatalities caused by a storm. Some studies show, however, that the amount of rainfall
produced by a storm may not necessarily be related to the intensity—the sustained wind speed—
of the hurricane. Record levels of precipitation and subsequent flooding during Harvey, for
example, continued even after the storm made landfall and was downgraded from a hurricane to a
tropical storm. Improving the ability to accurately forecast the timing, amount, and location of
high rainfall periods would advance the value of hurricane forecasting significantly.

28   NOAA, NHC, Storm Surge Overview, at https://www.nhc.noaa.gov/surge/.
29   NOAA, NHC, Storm Surge Unit, at https://www.nhc.noaa.gov/surge/ssu.php.

Congressional Research Service               R45264 · VERSION 4 · UPDATED                                            7
NHC and Forecasting Hurricanes: 2017 Overview and 2018 Outlook
2017 Atlantic Hurricane Season Overview
NOAA releases its outlook for hurricane season prior to June 1 of each year and typically
provides an update as conditions evolve for the Atlantic basin. Table 1 shows that the number and
strength of actual hurricanes slightly exceeded the upper range of NOAA’s seasonal outlook for
an active hurricane season in 2017.
Table 1. 2017 Atlantic Hurricane Season: Comparison Between Seasonal Outlook
and Actual Storms
NOAA Seasonal Outlook NOAA Seasonal Outlook
(May 2017) (August 2017) Actual
Named Storms: 11-17 Named Storms: 14-19 Named Storms: 17
Hurricanes: 5-9 Hurricanes: 5-9 Hurricanes: 10
Major Hurricanes: 2-4 Major Hurricanes: 2-5 Major Hurricanes: 6
Source: National Oceanic and Atmospheric Administration (NOAA), “Extremely Active 2017 Atlantic
Hurricane Season Finally Ends,” November 30, 2017, at http://www.noaa.gov/media-release/extremely-active-
2017-atlantic-hurricane-season-finally-ends.
Notes: A hurricane is a storm with sustained wind speeds of at least 74 miles per hour. A major hurricane is a
storm with sustained wind speeds of at least 111 miles per hour (Category 3). Category 3, 4, and 5 hurricanes
are deemed major hurricanes because of their potential for significant damage and loss of life. The NOAA
Seasonal Outlook numbers were first released on May 25, 2017, then revised on August 9, 2017.
Three major hurricanes affected the continental United States, the USVI, and Puerto Rico in
2017, causing severe damage: Harvey (August 17-September 1), Irma (August 30-September 12),
and Maria (September 17-September 30).30 In general, forecasts of these hurricanes’ tracks were
better than the previous five-year average for track forecasts. However, forecasts of intensity were
less accurate; some forecast errors for these hurricanes exceeded the previous five-year average
for forecast errors. Track and intensity forecasts for each of the three major hurricanes are
discussed below.
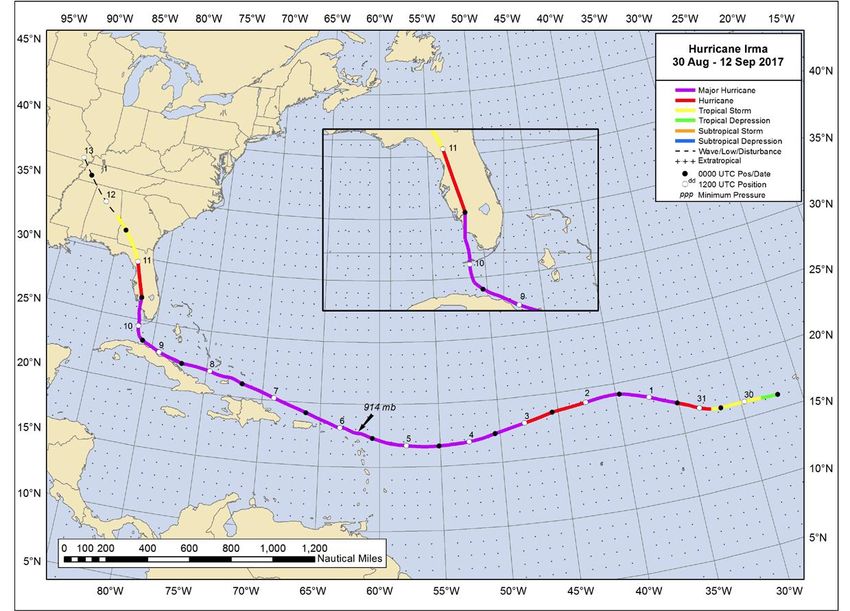
Hurricane Harvey
Hurricane Harvey was the first major hurricane to strike the continental United States since 2005,
achieving category 4 strength before making landfall along the Texas coast on August 25, 2017,
about 6 miles east of Rockport, Texas.31 According to the NHC, Harvey “was the most significant
tropical cyclone rainfall event in United States history, both in scope and peak rainfall amounts,
since reliable records began around the 1880s.”32 The highest storm total rainfall reported was
more than 60 inches near Nederland, TX, which exceeded the previous record of 52 inches in
Hawaii during Hurricane Hiki in 1950.33
30 The dates associated with each hurricane reflect the time from initial formation until storm dissipation. Email from
Matthew Borgia, Congressional Liaison for Weather, NOAA, March 15, 2018.
31 The last major hurricane to make landfall in the continental United States was Hurricane Wilma in 2005, which made
landfall in Florida on October 25, 2005, as a category 3 hurricane.
32 Eric S. Blake and David A. Zelinsky, National Hurricane Center Tropical Cyclone Report: Hurricane Harvey,
NOAA, AL092017, January 23, 2018, p. 6. Hereinafter Blake and Zelinsky, Hurricane Harvey, 2018.
33 Blake and Zelinsky, Hurricane Harvey, 2018, p. 6.
Congressional Research Service R45264 · VERSION 4 · UPDATED 8NHC and Forecasting Hurricanes: 2017 Overview and 2018 Outlook
Hurricane Harvey also was remarkable for the areal extent of the intense flooding it caused. Large
sections of southeastern Texas received 3 feet or more of rainfall during Harvey, and the NHC
postulated that “it is unlikely the United States has ever seen such a sizable area of excessive
tropical cyclone rainfall totals as it did from Harvey.”34
Hurricane Harvey was a slow-moving storm once it made landfall in Texas, which explains why
it produced such extreme rainfall. The cyclone was trending to the northwest as it made landfall
but stopped its northwestern motion and made a slow loop from August 26 into August 27, then
drifted southeastward for a few days before moving offshore again. However, the front did not
move far between August 27 and August 28, allowing warm and humid air from the Gulf of
Mexico to feed the storm, resulting in heavy rainfall over land even though the storm had
diminished to tropical storm status. Figure 4 shows Harvey’s track from its genesis as a tropical
depression in the Atlantic Ocean through its dissipation on September 1 over the Tennessee
Valley.
Figure 4. Hurricane Harvey’s Track
(August 17, 2017, through September 1, 2017)
Source: Eric S. Blake and David A. Zelinsky, National Hurricane Center Tropical Cyclone Report: Hurricane Harvey,
NOAA, AL092017, January 23, 2018, Figure 2. (Hereinafter Blake and Zelinsky, Hurricane Harvey, 2018.)
Notes: Inset indicates that Harvey made landfall as a major hurricane, and then reversed course and slowly
drifted southeastward over southeastern Texas and offshore for several days before heading northeastward over
34 Blake and Zelinsky, Hurricane Harvey, 2018, p. 7.
Congressional Research Service R45264 · VERSION 4 · UPDATED 9NHC and Forecasting Hurricanes: 2017 Overview and 2018 Outlook
land again. Numbers along the hurricane track indicate dates (e.g., 17 equals August 17, 2017). The small arrow
indicating 937 mb (millibars) indicates the lowest pressure recorded for the storm along its track.
The record rainfall amounts created widespread flooding in Texas, and freshwater flooding was
responsible for 65 of the 68 “direct” deaths in Texas attributed to the hurricane.35 The fatality
statistics make Harvey the deadliest U.S. hurricane in terms of direct deaths since Superstorm
Sandy in 2012.36 NOAA estimated that damage from Hurricane Harvey was approximately $125
billion, with more than 300,000 structures and up to 500,000 cars flooded in southeastern Texas.37
Forecasts
As Figure 4 shows, Harvey formed as a tropical depression east of the Caribbean islands on
August 17, 2017, diminished in strength as it moved west and crossed the Yucatan Peninsula, and
then re-formed as a tropical storm in the Gulf of Mexico. According to the NHC, “the re-
formation of Harvey was well-forecast by NHC ... and the remnants of Harvey in the Caribbean
were given a high (>60%) chance of genesis in the 2-day outlook 42 h[ours] before re-formation
occurred—an excellent forecast by current standards.”38
Hurricane forecasts generally are divided into two categories: hurricane track and hurricane
intensity. The NHC forecast for Harvey’s track was better than average, meaning the forecast
errors were lower than the average official forecast errors for hurricanes during the previous five-
year period (Table 2). For each forecast period shown in Table 2, the official track forecast errors
(expressed in nautical miles from the actual path of the hurricane) for Hurricane Harvey were
lower than the five-year average forecasts made by the NHC during 2012-2016.
Table 2. National Hurricane Center (NHC) Official Track Forecast Errors for
Hurricane Harvey Compared to the 2012-2016 Average
(in nautical miles)
Forecast Forecast Perioda
12 hours 24 hours 36 hours 48 hours 72 hours 96 hours 120 hours
NHC 18.8 28.8 38.9 49.7 81.2 124.5 168.7
Official
2012-2016 24.9 39.6 54.0 71.3 105.8 155.4 208.9
Average
Source: Congressional Research Service (CRS), from Blake and Zelinsky, Hurricane Harvey, 2018, Table 6a.
Notes: Forecast errors indicate the difference between the forecast track and the actual track in nautical miles.
a. The NHC issues official forecasts every 6 hours, and each forecast has projections valid 12, 24, 36, 48, 72,
96, and 120 hours after the forecast’s initial time.
35 According to the NHC, deaths occurring as a direct result of the forces of a tropical cyclone are referred to as direct
deaths and would include deaths caused by drowning in storm surge, rough seas, rip currents, freshwater floods,
lightning, and wind-related events (such as collapsed structures). Deaths occurring from heart attacks, house fires,
electrocution from downed power lines, car accidents, and other factors are considered indirect deaths. Harvey caused
about 35 indirect deaths. Blake and Zelinsky, Hurricane Harvey, 2018, p. 8.
36 For hurricanes making landfall in the continental United States.
37 Blake and Zelinsky, Hurricane Harvey, 2018, p. 9. NOAA reports that the damage estimate is a range between $90
billion and $160 billion (90% confidence interval), with $125 billion as the central estimate.
38 Blake and Zelinsky, Hurricane Harvey, 2018, p. 12.
Congressional Research Service R45264 · VERSION 4 · UPDATED 10NHC and Forecasting Hurricanes: 2017 Overview and 2018 Outlook
The accuracy of the official NHC forecast for Harvey’s intensity was mixed, compared to the
previous five-year average forecasts (Table 3). The previous five-year average intensity forecasts
(expressed in knots of wind speed) were better than the Harvey forecasts for the first 48 hours,39
but the Harvey intensity forecasts were better than the five-year average after 48 hours and out to
120 hours (five days, Table 3). The NHC indicated that the dichotomy in intensity forecast errors
likely was due to the cyclone weakening faster than expected over land between the 36- and 48-
hour forecast intervals. In contrast, the NHC noted that it correctly forecast that Harvey would
stay a weak cyclone at the long-range forecasts.40 Additionally, the NHC reported that “initially,
the rapid intensification (RI) of Harvey after its re-formation was not well-anticipated, but most
of the guidance had Harvey near hurricane intensity before landfall in Texas.... A NHC Special
Advisory issued at 1800 UTC 24 August, 33 h[ours] before landfall, forecast RI and verified
within 5 kt of the intensity near landfall.”41
Table 3. NHC Official Intensity Forecast Errors for Hurricane Harvey Compared to
the 2012-2016 Average
(in nautical miles per hour, or knots)
Forecast Forecast Perioda
12 hours 24 hours 36 hours 48 hours 72 hours 96 hours 120 hours
NHC 5.8 8.9 12.0 15.0 6.5 3.5 6.3
Official
2012-2016 5.5 8.2 10.5 12.0 13.4 14.0 14.5
Average
Source: CRS, from Blake and Zelinsky, Hurricane Harvey, 2018, Table 7a.
Notes: Forecast errors indicate the difference between the forecast intensity and the actual intensity in nautical
miles per hour, or knots.
a. The NHC issues official forecasts every 6 hours, and each forecast has projections valid 12, 24, 36, 48, 72,
96, and 120 hours after the forecast’s initial time.
Rainfall forecasts for Hurricane Harvey and the storm’s actual rainfall were the highest on record.
The Weather Prediction Center (WPC) within the National Weather Service is responsible for
issuing precipitation forecasts. After Hurricane Harvey re-formed in the Gulf of Mexico, the
initial WPC forecast was for 20 inches of precipitation in southeast Texas. The forecasts increased
to 40 inches in the hours before Harvey made landfall and then increased again to 50 inches the
day prior to Harvey’s center exiting Texas.42 Figure 5 shows the progression of rainfall forecasts
over time.
39 A knot (kt) is 1 nautical mile per hour, equivalent to approximately 1.15 statute miles per hour.
40 Blake and Zelinsky, Hurricane Harvey, 2018, p. 13.
41 Blake and Zelinsky, Hurricane Harvey, 2018, p. 13. UTC refers to Coordinated Universal Time (formerly
Greenwich Mean Time) and is the primary time standard by which the world coordinates its clocks and time. 1800
UTC on August 24, 2017, would have corresponded to noon in Houston.
42 Blake and Zelinsky, Hurricane Harvey, 2018, p. 14.
Congressional Research Service R45264 · VERSION 4 · UPDATED 11NHC and Forecasting Hurricanes: 2017 Overview and 2018 Outlook
Figure 5. Rainfall Forecasts for Hurricane Harvey
(August 17, 2017, through September 1, 2017; for southeast Texas)
Source: Blake and Zelinsky, Hurricane Harvey, 2018, Figure 22. (Modified by CRS.)
Notes: Heaviest rainfall predictions and actual rainfall occurred in southeast Texas after Harvey was
downgraded to tropical storm status. Bottom axis shows date and time of forecast (each tick mark indicates
three hours).
Hurricane Irma
Hurricane Irma was the second major hurricane to strike the continental U.S. coast in 2017,
making landfall in the Florida Keys near Cudjoe Key at category 4 strength on September 10 and
striking southwest Florida near Marco Island later that day as a category 3 hurricane (Figure 6).
After making landfall in Florida, the storm weakened but maintained hurricane strength as it
moved north-northwestward just east of Naples and Ft. Myers, FL, on September 11, before
becoming a tropical storm about 20 nautical miles west of Gainesville that same day. Before
striking the U.S. mainland, Irma reached category 5 hurricane force and made landfall on the
Caribbean islands of Barbuda, St. Martin, and Virgin Gorda of the British Virgin Islands on
September 6.43 Irma dissipated on September 12 as it moved across Alabama.
Hurricane Irma did not strike Puerto Rico or the USVI, but the tropical storm strength high winds
located further out from the eye, rainfall, and storm surge created significant destruction,
particularly on the islands of St. Thomas and St. John.44 Widespread damage was reported on
both islands, including collapsed fire and police stations and damaged hospitals.45 St. Croix was
not as severely affected as the other two USVI, but even so nearly 70% of the structures on St.
43 John P. Cangialosi, Andrew S. Latto, and Robbie Berg, National Hurricane Center Tropical Cyclone Report:
Hurricane Irma, NOAA, AL112017, March 9, 2018, pp. 1-4. Hereinafter Cangialosi, Latto, and Berg, Hurricane Irma,
2018.
44 Storm surge is defined as an abnormal rise in sea level accompanying a hurricane or other intense storm.
45 Cangialosi, Latto, and Berg, Hurricane Irma, 2018, p. 14.
Congressional Research Service R45264 · VERSION 4 · UPDATED 12NHC and Forecasting Hurricanes: 2017 Overview and 2018 Outlook Croix were damaged.46 Three direct deaths in the USVI occurred as a result of Irma, and the storm was responsible for three indirect deaths in Puerto Rico, widespread power outages, and minor damage to homes and businesses. Other Caribbean islands where Irma made landfall took the full brunt of its category 5-strength winds, rain, and storm surge and suffered near-complete destruction.47 Hurricane Irma formed in the Atlantic as a tropical depression and reached hurricane strength quickly compared to Hurricane Harvey. Irma reached major hurricane force two days after storm genesis and maintained hurricane or major hurricane force for nearly 11 days, diminishing to tropical storm strength only after reaching northern Florida (Figure 6). According to the NHC, Irma’s rapid intensification—marked by a wind speed increase of 70 knots within 48 hours—is rare for Atlantic tropical cyclones, occurring only about 1 in 30 times (about 3.3% of the time).48 Irma also maintained sustained category 5 intensity for 60 hours, the second-longest period on record.49 Irma’s major hurricane force and repeated landfalls (seven landfalls in total) were responsible for widespread destruction. 46 Cangialosi, Latto, and Berg, Hurricane Irma, 2018, p. 14. 47 Cangialosi, Latto, and Berg, Hurricane Irma, 2018, pp. 13-14. For example, nearly 95% of all structures on Barbuda were destroyed, and the island was completely evacuated for the first time in nearly 300 years in the wake of Irma and in anticipation of Hurricane Jose. Hurricane Jose, September 5-25, 2017, also developed into a major hurricane but did not make landfall in the United States. 48 Cangialosi, Latto, and Berg, Hurricane Irma, 2018, p. 2. 49 Cangialosi, Latto, and Berg, Hurricane Irma, 2018, p. 2. Only the 1932 Cuba Hurricane of Santa Cruz del Sur exceeded Irma’s duration at category 5 strength. Congressional Research Service R45264 · VERSION 4 · UPDATED 13
NHC and Forecasting Hurricanes: 2017 Overview and 2018 Outlook
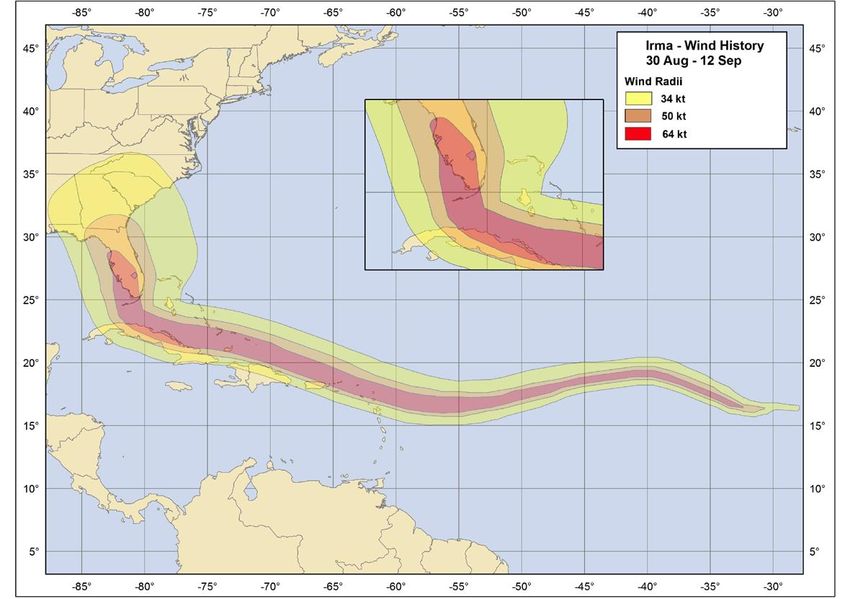
Figure 6. Hurricane Irma’s Track
(August 30, 2017, through September 12, 2017)
Source: John P. Cangialosi, Andrew S. Latto, and Robbie Berg, National Hurricane Center Tropical Cyclone Report:
Hurricane Irma, NOAA, AL112017, March 9, 2018, Figure 1. Hereinafter Cangialosi, Latto, and Berg, Hurricane
Irma, 2018.
Notes: Numbers along the hurricane track indicate dates (e.g., 10 equals September 10, 2017).
Figure 7 shows the swath of destructive winds along Irma’s path, indicating that the radius of
high winds enlarged as the storm moved west into the Caribbean, the Straits of Florida, and the
southeastern United States. Irma’s large wind field produced significant storm-surge flooding
along the northeastern coast of Florida, even though the storm made landfall in southwestern
Florida. The significant flooding along the banks of the St. Johns River near Jacksonville, FL, for
example, resulted from the combination of storm-surge and rainfall runoff into the river, along
with easterly winds ahead of Irma pushing seawater upstream, causing the water to rise initially.50
The broad wind field and associated rainfall and storm surge created conditions that led to seven
direct deaths in the southeastern United States because of Irma: four in Florida, two in Georgia,
and one in South Carolina.51
50 Cangialosi, Latto, and Berg, Hurricane Irma, 2018, pp. 10-11.
51 Cangialosi, Latto, and Berg, Hurricane Irma, 2018, p. 15.
Congressional Research Service R45264 · VERSION 4 · UPDATED 14NHC and Forecasting Hurricanes: 2017 Overview and 2018 Outlook
Figure 7. Hurricane Irma’s Wind Field
(August 30, 2017, through September 12, 2017; wind speed in knots)
Source: Cangialosi, Latto, and Berg, Hurricane Irma, 2018, Figure 4.
Notes: The wide wind field shown over the Florida peninsula indicates why Irma caused flooding in
northeastern Florida even though it made landfall in southwestern Florida. Wind speed is in knots.
Forecasts
The NHC noted that Irma became a cyclone earlier than predicted, but the official track forecast
errors were generally 30%-40% lower than the average official forecast errors for the previous
five-year period (Table 4). The only other forecast model that consistently predicted Irma’s track
better than the NHC model was the European Centre for Medium-Range Weather Forecasts
model (EMXI).52
52 Cangialosi, Latto, and Berg, Hurricane Irma, 2018, p. 18.
Congressional Research Service R45264 · VERSION 4 · UPDATED 15NHC and Forecasting Hurricanes: 2017 Overview and 2018 Outlook
Table 4. NHC Official Track Forecast Errors for Hurricane Irma Compared to the
2012-2016 Average
(in nautical miles)
Forecast Forecast Perioda
12 hours 24 hours 36 hours 48 hours 72 hours 96 hours 120 hours
NHC 14.8 25.5 37.6 50.5 73.9 101.8 135.0
Official
2012-2016 24.9 39.6 54.0 71.3 105.8 155.4 208.9
Average
Source: CRS, from Cangialosi, Latto, and Berg, Hurricane Irma, 2018, Table 5a.
Notes: Forecast errors indicate the difference between the forecast track and the actual track in nautical miles.
a. The NHC issues official forecasts every 6 hours, and each forecast has projections valid 12, 24, 36, 48, 72,
96, and 120 hours after the forecast’s initial time.
The NHC official intensity forecasts for Irma had errors larger than the forecast errors for the
previous five-year period (Table 5). The NHC noted that Irma’s intensity was more difficult to
forecast than the intensity of a typical tropical cyclone due to Irma’s quick formation and
interaction with Cuba.53
Table 5. NHC Official Intensity Forecast Errors for Hurricane Irma Compared to the
2012-2016 Average
(in nautical miles per hour, or knots)
Forecast Forecast Perioda
12 hours 24 hours 36 hours 48 hours 72 hours 96 hours 120 hours
NHC 9.0 12.4 15.8 17.4 18.7 24.9 29.7
Official
2012-2016 5.5 8.2 10.5 12.0 13.4 14.0 14.5
Average
Source: CRS, from Cangialosi, Latto, and Berg, Hurricane Irma, 2018, Table 6a.
Notes: Forecast errors indicate the difference between the forecast intensity and the actual intensity in nautical
miles per hour, knots.
a. The NHC issues official forecasts every 6 hours, and each forecast has projections valid 12, 24, 36, 48, 72,
96, and 120 hours after the forecast’s initial time.
Hurricane Maria
Hurricane Maria was the second category 5 hurricane to form in 2017. It was the deadliest storm
of 2017 and is widely regarded as the worst natural disaster to strike Puerto Rico on record. Maria
became a tropical storm on September 16, 2017, became a hurricane on September 17, and
reached category 5 intensity on September 18.54 The storm developed maximum wind speeds of
53 Cangialosi, Latto, and Berg, Hurricane Irma, 2018, p. 18. The ECMWF also reported that it struggled with correctly
predicting the intensity of both Hurricane Harvey and Hurricane Irma. See ECMWF, “Predictions of Tropical Cyclones
Harvey and Irma,” at https://www.ecmwf.int/en/newsletter/153/news/predictions-tropical-cyclones-harvey-and-irma.
54 Richard J. Pasch, Andrew B. Penny, and Robbie Berg, National Hurricane Center Tropical Cyclone Report:
Hurricane Maria, NOAA, AL152017), April 5, 2018, p. 2. Hereinafter Pasch, Penny, and Berg, Hurricane Maria,
Congressional Research Service R45264 · VERSION 4 · UPDATED 16NHC and Forecasting Hurricanes: 2017 Overview and 2018 Outlook 175 mph over the eastern Caribbean on September 19, but weakened slightly to category 4 after making landfall on the island of Dominica. It then struck the southeast coast of Puerto Rico on September 20 with winds just below the threshold of a category 5 hurricane.55 That same day, the storm passed close by the USVI, particularly the island of St. Croix, damaging 80%-90% of the power and transmission systems in the USVI.56 The eye of the hurricane traversed Puerto Rico roughly diagonally from southeast to northwest for several hours and moved offshore into the Atlantic Ocean later on September 20. After crossing Puerto Rico, Maria headed north toward the eastern United States but remained offshore, passing about 130 nautical miles east of Cape Hatteras, NC, on September 27. Maria never made landfall in the continental United States before dissipating in the Atlantic Ocean on September 30.57 Figure 8 shows the hurricane track from genesis on September 16, 2017, through dissipation on September 30, 2017.58 2018. 55 Pasch, Penny, and Berg, Hurricane Maria, 2018, p. 2. 56 For more information on damage to the U.S. Virgin Islands’ power and water systems and recovery efforts, see CRS Report R45105, Potential Options for Electric Power Resiliency in the U.S. Virgin Islands, by Corrie E. Clark, Richard J. Campbell, and D. Andrew Austin. 57 Pasch, Penny, and Berg, Hurricane Maria, 2018, p. 3. 58 Pasch, Penny, and Berg, Hurricane Maria, 2018, p. 33. Congressional Research Service R45264 · VERSION 4 · UPDATED 17
NHC and Forecasting Hurricanes: 2017 Overview and 2018 Outlook

                                    Figure 8. Hurricane Maria’s Track
                              (September 16, 2017, through September 30, 2017)

     Source: Richard J. Pasch, Andrew B. Penny, and Robbie Berg, National Hurricane Center Tropical Cyclone Report:
     Hurricane Maria, NOAA, AL152017), April 5, 2018, Figure 1. Hereinafter Pasch, Penny, and Berg, Hurricane
     Maria, 2018.
     Notes: Numbers along the hurricane track indicate dates (e.g., 18 equals September 18, 2017).

Puerto Rico was still recovering from damage caused by Hurricane Irma two weeks earlier when
Maria made landfall. Hurricane Maria incapacitated the central electric power system on Puerto
Rico, leaving the entire island without power and destroying much of the power grid.59
Direct and indirect death totals in Puerto Rico have been the subject of controversy, according to
some journalists and news reports, with higher unofficial numbers contrasting with the lower
numbers reported by the government of Puerto Rico.60 The official death toll in Puerto Rico is 65;
however, hundreds of indirect deaths may be attributed to Maria, pending results of a Puerto

59 For more information about damage to the Puerto Rican power system, see CRS Report R45023, Repair or Rebuild:
Options for Electric Power in Puerto Rico, by Richard J. Campbell, Corrie E. Clark, and D. Andrew Austin.
60 See, for example, Eliza Barclay and Alexia Fernandez Campbell, “Data Shows Hurricane Deaths in Puerto Rico

Could Be Over 1,000,” Vox, December 8, 2017, at https://www.vox.com/policy-and-politics/2017/11/29/16623926/
puerto-rico-death-toll-hurricane-maria-count.

Congressional Research Service              R45264 · VERSION 4 · UPDATED                                              18
You can also read