2021 summer & tropical weather outlook report - Understand the potential impact on your business - DTN
←
→
Page content transcription
If your browser does not render page correctly, please read the page content below

2021 summer & tropical
weather outlook report
 Understand the potential impact on your business

©2021 DTN, LLC, all rights reserved. “DTN” and the degree symbol logo are trademarks of DTN, LLC.

Table of contents
 3   Summer forecast summary

 4   Tropical season summary

 6   Detailed 2021 summer forecast

 9   Preliminary 2021 fall forecast

10   Industry thoughts on severe weather

12   Offshore discussion

17   Transportation discussion

21   Aviation discussion

24   Utilities discussion

28   Public safety, sports, & events discussion
Summer forecast summary
The hurricane season officially began on June 1, and summer is nearly here. Currently, we expect
a few weather trends for the upcoming season. Most notably, conditions appear favorable for
another active hurricane season in the Atlantic, particularly for the northeastern United States
and Florida, and less so for the western Gulf of Mexico. While active, the season should feature
fewer storms than 2020, along with reduced landfall risks.

Warmer Gulf and Atlantic water temperatures per CFS model   Lower windshear – Gulf of Mexico and southern Atlantic

Most of the United States can expect above-normal temperatures this summer. In particular,
across the Southwest and the Northeast during June. We anticipate widespread, above-
normal temperatures across the Central Plains and western states, with drought conditions
intensifying during the season. The eastern United States will experience less-warm anomalies
and more rainfall.
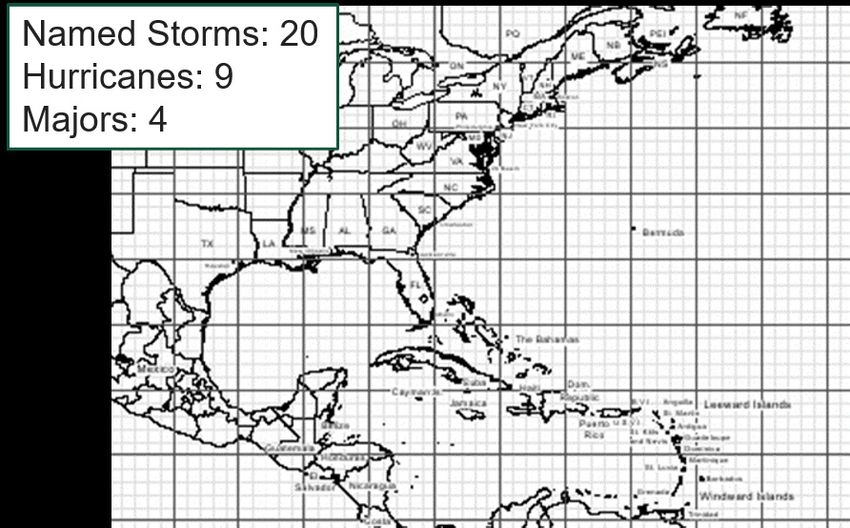
4

Tropical season summary
Before jumping into a detailed 2021 tropical forecast, it’s worth noting some historical
trends that lay the groundwork for what we expect this year. Overall, the United States has
experienced fewer hurricane landfalls in the past decade than in the last 150 years. In fact, no
major hurricanes made U.S. landfall between October 2005 and August 2017 — a record span
— but four major hurricanes have made landfall since.

History has shown that a storm of sufficient intensity, located in exactly the wrong place, can
create significant disruptions. Hurricanes Sandy and Harvey are great examples. If or when
landfalls and intensities catch up with historical distributions, the costs will be much greater
due to the growth in exposure, vulnerability, and wealth. Landfalls where populations and
infrastructure are dense increase threats for loss of life and widespread property damage.

Keeping that history in mind, we have
already seen named storms in the
Pacific and Atlantic and anticipate
another long, active season that will
run late into fall. In addition to the
above-average activity, one of the
most notable observations for the
season is that there will be more
storms heading up the East Coast,
with fewer risks for the western Gulf
of Mexico.
5

We expect El Niño-Southern Oscillation (ENSO) neutral conditions through most of
the summer and fall. This is favorable for more Atlantic storms than normal, but not
a record-setting year like 2020. Warm water temperatures will likely be in place again
throughout the hurricane season, and storm totals will be higher than the recent 1991 to
2020 average of 14 named storms and seven hurricanes. This season, storm totals will
likely be in the 20-storm range — solidly above average, though quite a bit lower than
2020’s 30 named storms.

Of notable importance is where those storms will go, which connects us back to the
historical information shared earlier. Current indications suggest that a weak eastern
U.S. trough could be a feature of this summer, as it was for several summers before the
last couple of years. For most of last year’s hurricane season, a ridge was in place along
the East Coast, which directed storms into the Gulf, often towards Louisiana. This year’s
pattern should limit the number of storms heading into the western Gulf and could send
more up the East Coast. While the general pattern may be less favorable for Gulf storms
this year, there will likely be some occasional periods when conditions are favorable for
storms to track into the Gulf. A major Gulf storm is still possible this year, but there
should be fewer storms overall than in other portions of the Atlantic basin.
6
DetailedDTN 2021
2021 Summer
summer Outlook
forecast Summer Outlook (June-September 2021)
During summer 2021, we expect
U.S. Outlook The DTN summer 2021 outlook map.
Highlights - Warmer
above-normal temperatures across - Becoming increasingly
summer ahead
• Neutral ENSO 2 hot and drier - Increased
most of the United States, with the
is expected this - Drought expands and
dryness late
summer
summer worsens this summer
warmest temperatures •occurring
Most anomalous
- Greater wildfire risks
in the West
1
- Slightly milder
heat will be in the - Above normal 4
across the interior west through the temperatures
summer
- Variable rainfall
West and North - Increased rainfall pattern
3
Central Plains. If there will be extended
Central U.S. later in summer
- Somewhat
- Severe storm risks elevated
• Active tropical - Modestly above normal temperatures
episodes of heat this summer,
season this is but
is likely, - Drought builds
peak early
5
tropical risks
- Coastal areas see less heat
U.S. landfall risks
where to find them. Lesser warmth
are reduced - Modestly warm summer
6 - Above average rainfall
is anticipated across the• Growing
easterndrought in - Slightly elevated tropical risks
the West and parts
United States, although somewhat
of the Plains
higher anomalies are possible across New England. The eastern region, in no coincidence, shows the
greatest chances for above-normal rainfall. Heavier rainfall increases soil moisture, which tends to
1 North Central Temperature Precipitation
act as a drag on temperatures, but it also increases humidity levels. A tendency toward dry weather
• Overall warmer summer ahead • Somewhat higher risk for storms in June
• Warmer than summer 2020 • Drier trend takes over later in summer
is expected across the north-central United States• Hotter
through the west, and
during July/August expanding
• Drought builds throughdrought
the summer
conditions are anticipated in these areas. Locations typically prone to wildfires should be on alert
2 Northwest Temperature Precipitation
this summer as conditions will become favorable for above-normal
• Slower start to summer heat activity. Cooler
• Drier than waters
normal summer off
coming up the
• Interior heat builds late in summer • Drought expands and worsens
West Coast may protect the immediate coastal areas fromalong
• More moderate thetheworst
coast heat.
• Growing wildfire risks
3 Southwest Temperature Precipitation
There is more uncertainty
• Another hot summer expected
than usual
• Below normal precipitation continues
• Persistent warmth is indicated • Monsoon season looks drier than usual
regarding the •progress
• Stretches of significant heat of ENSO
Worsening drought/early start tothis
wildfire season
summer, and it’s something we’ll continue
4 Northeast Temperature Precipitation
to monitor throughout
• Slightly milder summer • Variable rainfallthe season. Some
pattern
• Only brief hot stretches are likely • Late summer dryness west of the Appalachians
models show the
• Muggy conditions pick up ENSO
• Slightly elevated trending warmer
tropical risks later in the summer
than expected, so it is possible temperatures
5 Southeast Temperature Precipitation
could trend cooler
• Modestly above normal overall• Above with a somewhat
normal rainfall for many areas more
• Higher than normal humidity • Reduced rainfall for most in June
likely increase •in
• Reduced signals for extended heat rainfall
Near trends
to slightly above normalacross
tropical risksthe
eastern part of the country.
6 South Central Temperature Precipitation
• Above normal temperatures likely • High Plains drought worsens
• Heat most likely in the High Plains • Spring storms linger into June
• Slightly warmer version of 2020 • Repeat of busy 2020 tropical landfalls not likely
Detailed 2021 Summer Forecast 1 – ENSO
Jeff Johnson, Certified Consulting Meteorologist
Nate Hamblin, Long Range Team Lead Meteorologist
Stephen Strum, Vice President of Extended Forecast Services
Eric Jenks, Energy Meteorologist
/DTNWeather @DTNweather
© 2021 DTN, LLC, all rights reserved. “DTN” and the degree symbol logo are trademarks of DTN, LLC.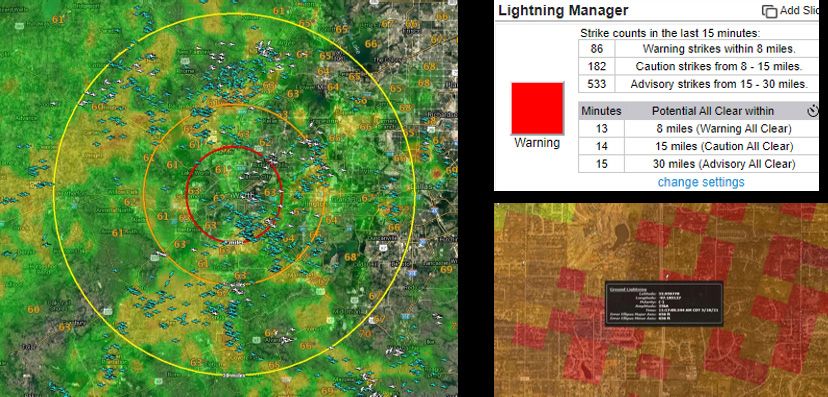
7

Summer temperatures
This summer’s overriding theme is
warmer than normal temperatures
for most of the country, especially
the West. The East could be more
moderate but with increased humidity
due to above-average rainfall. Above-
normal temperatures are expected
across the Southwest and Northeast
during June. Cool risks remain across     June 2021 seasonal temperatures map.

the north-central region for the middle
of the month.

We expect widespread, above-normal
temperatures across the Central Plains
and West, with drought conditions
intensifying for many during the
summer as a whole. Lesser warm
anomalies are anticipated across the
East with more rainfall.

                                          July 2021 seasonal temperatures map.

                                          August 2021 seasonal temperatures map.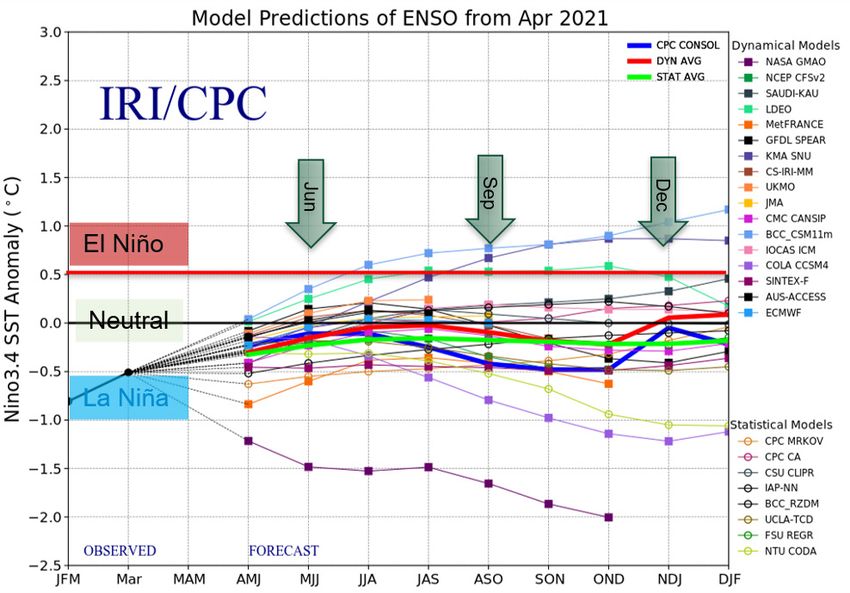
8

Summer precipitation
While there will be increased tropical
storm activity in portions of the country,
drier conditions are predicted across
the West into the Central Plains by mid
to late summer. While the southeast
may see hurricanes and slightly wetter
patterns, the western half will experience
drier than normal soil moisture
conditions, as will the Great Lakes and      June 2021 seasonal precipitation temperatures map.

the Northeast. Given that, it’s unlikely
there will be an improvement in drought
conditions across the western and the
north-central United States this summer.
In terms of severe weather, it’s been
quieter than average so far, although
more average activity should resume in
early June, so we’re not out of the woods.

                                             July 2021 seasonal precipitation temperatures map.

                                             August 2021 seasonal precipitation temperatures map.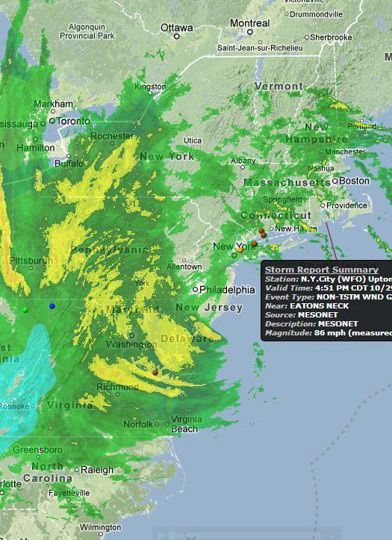
9

Preliminary 2021 fall forecast

If we look towards autumn, there is a fair amount of uncertainty due to differing model
forecasts regarding ENSO and a higher-than-normal spread with everything from El Niño
to La Niña. With that in mind, early indications are we’ll continue to see above-normal
temperatures across a good portion of the United States. The warmth will be most
notable across the West but will also be in place across the Plains and the northern tier.
Given the 10-year trend toward warmer conditions just about everywhere in September,
warmth is more favored that month. By October and November, the models show better
chances for cool risks in the southeast.

If the forecast trends toward El Niño, this will increase late-season cooling risks across
the southeast. Current analog forecasts show cool risks across the southeastern third of
the country, especially during the second half of the season. The model composite also
shows the coolest readings relative to normal across the southeast, but not nearly to the
same degree.

As mentioned in the hurricane summary, the East Coast has a higher risk of landfalling
tropical systems this year, which would add to the wet risks already in place. Dry weather
conditions are likely to continue across the western and north-central regions through the
fall, keeping drought impacts high and wildfire risks higher than normal.
10

Industry thoughts on
severe weather
During our seasonal outlook webinars over the past few months, we asked our attendees
if they felt severe weather has become more extreme, stayed the same, or is less
extreme. Across all industries, 144z respondents participated. Here are their thoughts.

Question 1: How has severe weather developed in the past years?
The majority of respondents (58%) felt that severe weather has become more extreme;
36% have not experienced a significant change. Only 6% replied that severe weather has
become less extreme.

There were differences by sector, especially in sports and safety. Compared to the
overall population of respondents, that group was nearly even on weather trending more
extreme (43%) and staying the same (46%). In comparison to offshore (83%) and utilities
(63%), however, sports and safety experience the impacts of weather to a lesser extent.

This summer, we expect respondents experiencing more extreme weather will see another
more active hurricane season in the Atlantic, particularly for the northeast United States
and Florida. Those in the Central Plains and western part of the country will experience
widespread, above-normal temperatures with drought conditions intensifying during the
summer, increasing wildfire risks.

                             Severe Weather Trend
 60%

             58%
 50%

 40%

 30%
                                     36%

 20%

 10%

                                                            4%
  0%
          More
            Moreextreme
                 extreme       Stayed
                                  Stay ed the   same
                                          the same     Less
                                                          Lessextreme
                                                               extreme
11
Question 2: In which areas has weather impacted your business over the past years?
Here, respondents selected all that
Severe Weather Business Impact
applied from multiple answers.
60%
Across all sectors, the single largest
50%
impact, by far, was employee 51%
health and safety, chosen by 51% of 40%
respondents. Customer satisfaction 3 0%
31% 31%
29%
and profitability were tied for the 20% 24%
22%
second with 31%, followed closely
10%
by regulatory requirements (29%).
0%
The least-impacted was company Employees
andsafety
health
Employee health
safety
Customer
and Customer sat isfaction
satisfaction
Profitability
Profitabil ity Regulatory
Regulatory
requirements
Other
Other Company
Company investments
investments
requirements
investments, with 22% of the
responses. And 24% of the respondents
experience other types of business impact.
Question 3: What capabilities does your business have in place addressing the
impact of severe weather?
Once again, respondents chose all
Decision
Severe Making
Weather Capabilities
Business Impact
that applied from multiple answers. 60%
60%
Most have an external weather 50%
50% 54%
decision-making capability in place,
40%
4 0% 45%
like a weather platform (54%),
3 0% 36%
weather data/API (45%), or weather 30%
consultancy (36%). Many have
20%
20%
22%
in-house capabilities, like weather 10%
10% 14% 14%
11%
stations (22%), a meteorologist 0%
Employee health and Customer sat isfaction Profitabil ity Regulatory Other Company investments
0%
(14%), or data science (11%); 14% Weather
safety
Weather
platform
Weaterdata
platform Weather data
API
/
/ API Weather
Weather
consultancy
consultancy
Inhouse
Inhouse requirements
weather
weather
stations
Inhouse
Inhouse
meteorologist
meteorologist
Other
Other Inhouse
Inhouse
data
data
science
science
stations
have other capabilities in place. As
we have seen, sports and safety experiences the impacts of weather to a lesser degree, reflected in
their use of weather-related tools — a weather platform (24%), weather consultancy (24%), weather
data/API (26%), and in-house weather stations (16%).12 Offshore discussion Over the last six years We’ve seen an interesting situation where tropical storms begin in late April or May. Continuing with that trend, Tropical Storm Ana formed in the central Atlantic on May 22. While this system was weak and short-lived, it doesn’t mean businesses can relax. An above-average storm season is once again predicted, with a higher risk of tropical storms impacting the Eastern Seaboard. Despite this, the atmosphere is not quite as favorable for storm development as last year; however, climate model guidance still favors lower-than-average wind shear. Warm water temperatures will likely be in place again throughout the hurricane season, so storm totals should come in higher than even the recent 1995-2020 average. This season, totals will likely be in the 20-storm range, solidly above average, though quite a bit lower than 2020’s 30 named storms. Of greater importance is where the storms will go. Early indications suggest that a weak eastern U.S. trough could be a feature of this summer’s pattern, as it was for several summers before the last couple of years. A ridge was in place along the East Coast during most of last year’s hurricane season, which directed storms into the Gulf, often towards Louisiana. This year’s pattern should limit the number of storms heading into the western Gulf and could send more from the eastern Gulf up the East Coast. While the general pattern may be less favorable for western Gulf storms this year, there will likely be some occasional periods when conditions are favorable for storms to track into the Gulf. A major Gulf storm is still possible this year, but there should be fewer storms in the western Gulf overall than in other portions of the Atlantic basin. The best defense for another busy tropical storm season is a strong offense. Being prepared with a comprehensive, step-by-step, staged solution will help drive confident, informed decision- making that supports risk mitigation.
13

   Offshore discussion
Tropical storm-focused forecasts
The first solution for storm monitoring in our tropical
weather suite is our long-range report — an extended,
two-week outlook, updated twice a week. Next is the
seven-day outlook, updated twice a day. They provide
general awareness of current conditions and what could
potentially head towards vulnerable crews and assets.

Once there is the potential for a storm to form and
reach a minimum, pre-determined threshold, our team
issues a significant tropical disturbance advisory. These
are typically issued before National Hurricane Center
advisories since our thresholds are focused on business-
specific, decision-making needs — in addition to general
safety guidance. Once the storm is named, active storm advisories are issued, including a seven-
day forecast track and site-specific guidance for a business’ specific needs, whether for offshore or
coastal locations. These reports, essential for Gulf offshore platform operations, may be especially
helpful for East Coast ports and terminals this season to support planning and decision-making.
14

   Offshore discussion

A real-life example
Here’s an example of how a comprehensive weather
tool worked during an actual event: 2020’s Hurricane
Delta. As a quick overview, Hurricane Delta was
officially classified as a tropical depression on
October 4 and dissipated nine days later. It made
landfall twice in Puerto Morelos, Yucatan, and Creole,
Louisiana, causing more than $4 billion in damage.
The storm reached peak winds of 140 mph, and its
lowest pressure was 953 mb.

Keep in mind the October 4 classification date. On September 28, our forecast team
first identified activity indicating enhanced probability for storm formation in the
Caribbean in an extended outlook report. A few days later, the team started issuing
special guidance on this potential low in our daily tropical planner. This occurred
about five days before the official storm formation. Then, we issued specific
briefings on its tropical wave development and potential.

On October 3, there was a clear indication that this tropical wave had the
potential to form into a cyclone. Our team issued a significant tropical
disturbance advisory — 26 hours before the National Hurricane Center issued its
first potential tropical cyclone advisory. This provided our valued customers an
additional day to plan for the impending storm.

Our reports provided a full five-day storm track forecast, including the initial
spaghetti plots from the various models, giving valuable insight into forecast
track uncertainty. Once the storm was officially classified, the bulletin was
upgraded to an active storm advisory, breaking down the storm’s motion,
category, and other details.
15

       Offshore discussion

                                     Even more important is the commentary our team provides each
                                     customer. It shares specific insights into what the forecast means
                                     for the customer’s circumstances and operational considerations,
                                                                            onshore or off. Storm
                                                                            impacts are broken into
                                                                            marine weather or onshore,
                                                                            with a general forecast
                                                                            discussion, including track,
                                                                            intensity, and other details.

                                                                            Once the significant tropical
                                                                            disturbance advisories
Tropical decisions guidance issued
                                                                            begin, initial tracks and site-
every 12 hours

   specific decision guidance are issued. We offer three different reports, including the T-time report
   used for offshore assets. It breaks down the decision time remaining for both a forecast track
   and also a direct path. In addition to a single location report, multi-location reports are available.
   Whether an operation has 10 or 100 locations, everything can be provided in one report for easy
   reference during operational meetings.

   The second type of report is the tropical threat report,
   which focuses more on wind and storm surge for a
   coastal, onshore, or inland location. It breaks down a
   10-day wind forecast, a forecast track, and a direct
   track path, providing calculations for estimated times
   of arrival for certain wind speed thresholds based on
   the tracks. The report also includes storm surge impact
   information. Like the T-time report, a multiple-location
   option is available.
16
Offshore discussion
Finally, there’s a risk and response
report. For organizations with
staged emergency response
procedures, the forecast shows
storm specifics as they apply to
an individual plan. Triggers are
available for forecast wind and
gusts, worst case wind, and the
probability exceedance of wind
thresholds, which is
helpful for businesses with
stringent procedures.
Accurate weather insights and analysis can help reduce uncertainties and risks for
personnel and assets while also improving operational efficiencies. Learn more by
downloading our white paper.
Get actionable weather insights
For more information or to request a demo of
one of our offshore solutions, please visit
www.dtn.com/weather/marine-offshore/17 Transportation discussion This summer, transportation managers must remain aware of significant weather risks to effectively schedule crews and road maintenance work and prepare for potential emergency responses. There are three key weather threats this summer that may threaten infrastructure integrity and public safety. The predicted above-average hurricane season poses particular challenges for non- traditional storm areas and the potential impact on population-dense centers. However, the hurricanes themselves aren’t the only threat to roads and bridges. The extreme rainfall that often accompanies slow-moving tropical storms can cause flash flooding in the eastern United States, having a significant impact on public safety and supply chain operations. Conversely, the third weather threat is the hot, dry weather predicted for the central and western portions of the country. These conditions could lead to emergency road closures and infrastructure repair, particularly with concern to wildfire management. An elevated risk of tropical weather Major U.S. population centers are at greater risk this season as the hurricane forecast focuses on the Eastern Seaboard. Transportation teams up and down the coast must be aware of the potential for elevated tropical storm activity. While there is still some threat in the Gulf, the focus will likely be on Florida and the East Coast. Preparing for before, during, and post-storm actives will be paramount this season. In particular, post-storm activity relies on efficient, effective crew scheduling and reallocation to open roads and partner with utilities and other crews assigned to help restore infrastructure as quickly and safely as possible — particularly in high-density areas. Tropical storms create a different scenario than thunderstorms, as there is typically more time to plan and coordinate as the storm develops and moves up the coast. Having the right resources in place can support crew scheduling and reallocation
18

   Transportation discussion

to quickly manage road closures due to debris,
coordinate with other agencies when needed,
and prepare for potential flash floods. Access to
meteorological consultations can ensure more
efficient, targeted efforts. A meteorologist can
provide real-time information and offer counsel on
expected storm impacts, which can be invaluable
when making decisions.

Those consultations and more are available
with WeatherSentry® Transportation Edition. It
integrates National Hurricane Center projected
storm paths and can identify transportation-related
impacts, both along the coast and inland. Flooding,
wind, and severe weather potential can be identified and integrated into one platform for team use.

The daily planner tool is also helpful for multiday events, like tropical storms. A daily planner can
be customized and used by multiple people in an organization. It is pushed out, providing daily
overviews and hourly details through multiple display capabilities. With a daily planner, everyone
knows what will happen weather-wise, now and in the short term, supporting the most efficient
resource planning.
19

   Transportation discussion

Wetter than normal
It’s important to recognize secondary, severe storm potential as tropical storms weaken
and move inland. In addition to the heavy rain and wind, these storms can create quick-
forming, spin-up tornadoes. With these events causing potentially wetter situations across
the eastern United States, conditions may be ideal for flash flooding and road closures
due to water and debris. Post-tropical storm weather events can threaten transportation
infrastructure and the ability to move people and goods. Local-radar data helps identify
specifically where and when severe weather may be moving in. Hyperlocal weather
information and alerts can help specific crews know if they need to move, or if a project
needs to be paused as weather moves through. Real-time weather data allows crews to
prepare for flash flooding and severe storms, as well as support utility crews with road
closures and clean-up efforts.

A platform like ours can help monitor for severe
rainfall events. Completely integrated into the
system, our data shows exactly where threats will
occur and can help project managers keep crews
safe and projects moving along as efficiently as
possible.

Hot and dry weather
The hot and dry weather expected in the West
and Central Plains creates the perfect setup for
fires. Transportation agencies play a significant
role in wildfire management and must be
prepared to support firefighting efforts,
whether it’s managing road closures, repairing
roads and bridges, or assisting other groups
who are trying to move resources and keep
people safe.
20

  Transportation discussion

Having access to real-time information and weather data can help crews understand where there
are heightened risks for fire-related damage. WeatherSentry offers accurate information about
relative humidity and wind speed, two conditions that contribute to fire weather. The platform
integrates with other available data regarding fire weather to help increase understanding of wind
speed and direction.

   Hurricane Sally causes devastating road damage in 2020
   Hurricanes can be difficult for transportation teams to navigate as there are many
   risks, both during and after the storm. Last year, Hurricane Sally was the second of two
   hurricanes to hit the Gulf Coast in a three-week period. Sally moved slower, producing
   higher-than-average rainfall. Very powerful and destructive, the hurricane wreaked havoc
   with roadways and bridges.

   Sally created challenges for Florida DOT and city and county agencies with its widespread
   flooding, closing roads across the Panhandle. There were so many closures that officials
   ran out of barricades and worked hard to get the word out about avoiding area roadways.
   Even though Sally diminished to a tropical storm as it slowly moved inland, it produced
   strong winds and rain that resulted in flooding. Most notably, it caused a construction
   crane to crash into the new Three Mile Bridge over Pensacola Bay, collapsing a section of
   the bridge.

  Get actionable weather insights
  For more information or to request a demo of one of our
  transportation solutions, please visit www.dtn.com/weather/
  transportation/city-and-county-roadways/
21

Aviation discussion
As flight operations climb back to pre-COVID levels, it is increasingly important to
manage efficiencies and ensure smooth operations, both in the air and on the ramp. This
summer, there will be three key weather events where actionable insights can help drive
decisions that will contribute to safer, more efficient operations.

As in most summers, thunderstorms and severe weather can impact timeliness and
safety. Such events can quickly bring lightning, hail, strong winds, heavy rain, or any
combination of these conditions. This summer, thunderstorm activity is expected to be
heightened across parts of the Southeast and Mid-Atlantic. In the Central and Southern
Plains, where conditions are expected to be very warm and dry, personal safety is a
concern, as is increased turbulence potential.

Thunderstorm activity
When we think about the impact of thunderstorms on some of the busiest aviation
hubs, contingency planning around ramp closures and other actions is critical to
protecting employees and passengers, equipment, facilities, and aircraft. Access to
accurate, real-time weather insights can help drive informed decisions.

With the potential for a more active thunderstorm season across much of the country,
it is critical to have a tool that can accurately track a storm’s momentum and strength.
This allows an operations team to monitor the distance from a thunderstorm cell to
any identified location, so it’s clear what time it will impact critical assets — supporting
proactive decisions and actions. Real-time lightning data and watches and warnings for
tornadoes, hail, and high winds are essential. Implementing protocols for these events
contributes to operational efficiencies — allowing staff to flexibility adapt in real time.
For example, a customized hail warning message can notify staff to immediately move
aircraft indoors.
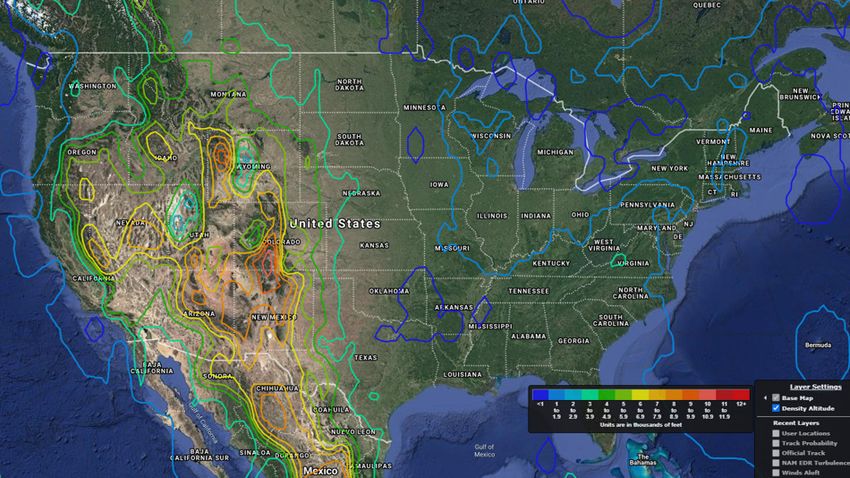
22

   Aviation discussion

Increased turbulence
The predicted thunderstorm
activity will lead to increased
convectively-induced turbulence.
Although we typically think of
clear air-related turbulence
in colder months, flying over
summertime thunderstorms
presents a similar risk. This
seasonal turbulence develops
close to thunderstorms, and is
related to gravity waves breaking
above the storm, impacting aircraft range, fuel burn, and performance time. When turbulence
impacts operations, safety concerns also exist for passengers and crew along with an increased
need for aircraft maintenance. Finding a resource that offers turbulence forecasts, particularly
with hourly updates, is imperative for safe, efficient operations. The Rapid Update Turbulence
Forecast helps mitigate convectively-induced turbulence risks. It provides real-time, calculated
turbulence intelligence for thunderstorm-induced turbulence conditions.

   Learn more about convectively-induced turbulence in our white paper on reducing risks and
   improving the bottom line.

Heat impact on operations
With excessive heat expected across the United States this summer, airplane performance
could be a concern, especially during take-off; ramp crew safety is also a potential issue.
The predicted extreme heat won’t be limited to just one part of the country, as most areas
will see above-average temperatures. The Northeast will also experience higher humidity
with its wetter conditions.
23

   Aviation discussion

One way to combat heat-
related aircraft performance
issues is knowing the density
altitude for any given location.
AviationSentry® offers specific
tools that present a snapshot
of real-time density altitude,
providing insights into potential
performance implications and
allowing valuable time for
risk mitigation.

WeatherSentry Airport Operations edition includes a feature that may not be well known for
aviation use — Wet Bulb Globe Temperature (WBGT). Used by hundreds of athletic teams and
event planners across the country, WBGT measures heat stress in direct sunlight by estimating
the effect of temperature, humidity, wind speed, and solar radiation on the human body. With its
location-specific information, ramp worker safety can be ensured during this summer’s expected
above-average temperatures.

   Excessive heat has multiple points of impact for air travel
   Excessive heat can threaten health and safety, contribute to droughts, and fuel fire
   weather. In 2017, excessive heat impacted the aviation industry. Worker safety is always
   paramount, particularly for ramp workers who are exposed to prolonged heat and sun.
   In June 2017, airlines had to pay special attention; some set up cooling stations for
   employees at airports. It was critical at Phoenix International Airport, where the daytime
   air temperatures reached 120 degrees that summer. Extreme heat also impacted flight
   operations, grounding more than 40 flights in Phoenix during the same period as smaller
   jets couldn’t generate enough lift to take off in the extreme temperatures. Its ripple effect
   impacted flight schedules across the country.

   Get actionable weather insights
   For more information or to request a demo of one of our
   aviation solutions, please visit www.dtn.com/weather/airlines/
24

Utilities discussion
According to the U.S. Department of Energy, severe weather has caused nearly 60% of all
major power outages over the last 20 years. Knowing that, with any potential severe weather
threats, utilities must improve their understanding of outage predictions ahead of significant
weather events so they can plan mutual assistance to help minimize related outages.

While day-to-day power supply maintenance operations usually only require a handful
of crews, the weather typically remains the largest variable for utilities. This summer’s
weather outlook presents a unique set of weather challenges that require consideration
and action. The forecast predicts an above-average tropical storm season with an elevated
risk for the East Coast. The West Coast will see another season of fire weather with warm
temperatures and drought fueling wildfire risks. Finally, an active thunderstorm season is
anticipated across the eastern United States, with easterly and southerly wind flows —
coupled with warm Atlantic temperatures that fuel thunderstorms.

Hurricane landfall events
With an above-average tropical storm season on deck, utilities need to continue growing
power outage management efficiencies. Successful outage planning is complicated. It
requires accurately forecasting weather events, anticipating likely types of incident tasks,
declaring incident command events through specific forecast criteria, and mobilizing resources
to fulfill estimated restoration times. All of this must be completed while maintaining a high
level of customer satisfaction and appeasing the public utility commissions. By improving
the understanding of potential outages ahead of major weather events, those insights can
support critical planning around the use of mutual assistance groups.
25
Utilities discussion
Machine learning is a growing technology that helps
predict outages and supports informed crew deployment
decisions. A machine learning program combines electric
utility, outage management system weather, and above-
ground infrastructure asset data. When combined
with current weather forecasts, it also supports high-
fidelity outage prediction. There are also tropical storm
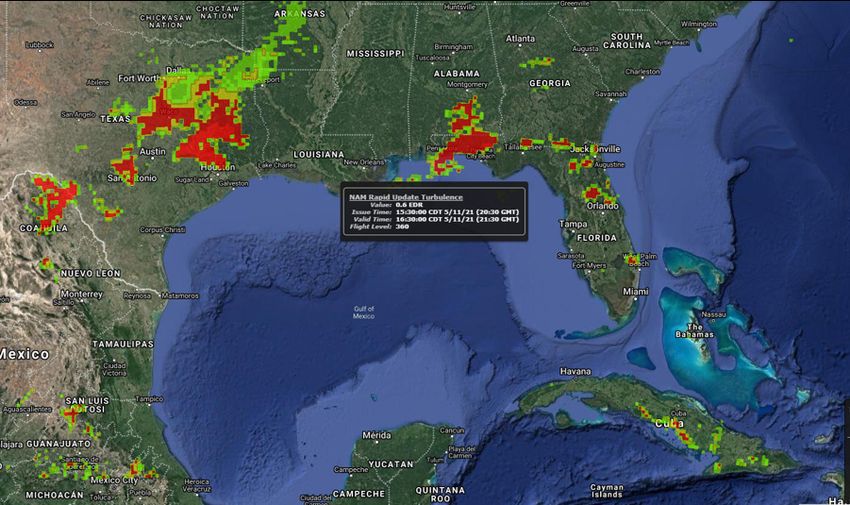
monitoring tools in WeatherSentry® Utility Edition.
The biggest need is to accurately forecast the track,
intensity, and time of arrival to coordinate emergency
preparedness efforts. Our tropical storm threat reports
can be customized across any service region with
estimated times of arrival, wind thresholds, and other
data that supports preparation plans.
Western region fire weather
Wildfire risks can’t be ignored this season, especially in California. There are growing concerns for
electric utilities across the western United States to build wildfire risk mitigation plans. [insert: fire
weather risk] Those plans should include accurate weather insights and objective risk criteria for
operational wildfire mitigation plan escalation. Access to skilled meteorologists who have fire-
weather expertise is also vital for informed decision-making.26 Utilities discussion Our Energy Event Index, an add-on to WeatherySentry, provides a daily wildfire risk score matrix, which acts as a red flag warning for designated service areas. The right weather resource allows utilities to define an operating region and related weather phenomena and thresholds for each. Accurate, hyper-local forecasts can help create connections to potential operational impacts. Custom operational thresholds can help staff visualize weather and wildfire risk in a specific service region. Thunderstorm risks With thunderstorm risk, it’s about better understanding the timing and coverage area of impending storms. Operations teams should be able to track lightning activity and determine its type and threat potential. Access to data for hail, flash flooding, and more, plus automated alerts and all-clear notifications can also help. WeatherSentry Utility Edition monitors conditions, like lightning, for specific locations across a service area. Further, proactive alerts can be created to support safe, efficient operational decisions. The solution’s dashboard offers many layers of weather intelligence, including lightning, hail, and wind data. The RadarScope single-site radar offers real-time data and insights into when and where rainfall is happening and then overlays global precision real-time lightning data for alerting, recording, and archiving purposes. Specific to your overhead assets, it enables efficient post-storm lightning inspection reports so you can prioritize repairs and crew utilization. Improve planning and operations to offset weather-related business and operational risks through greater awareness of weather hazards. Learn more by downloading the white paper.
27

Utilities discussion

Noteworthy, early-season tropical events impacting East
Coast utilities
In July 1996, Hurricane Bertha made landfall along North Carolina’s Atlantic coast. The
storm brought an 8 to 10-foot surge and tracked along the Eastern Seaboard, bringing
significant rainfall and wind gusts of up to 63 mph to Maryland and New Jersey. Power
outages left more than 250,000 customers without power in the Carolinas, Virginia,
Maryland, and Delaware. The utilities brought in repair crews from as far away as Georgia
and Florida to quickly bring customers back online.

The first storm of 2013, Tropical Storm Andrea, made landfall along the Gulf Coast of
Florida and was the only tropical storm to directly impact the contiguous United States
that season. It brought extreme flooding of up to 7.7 inches to Williamsburg, Virginia, and
6.6 inches to Gales Ferry, Connecticut. Utilities from Florida to Massachusetts managed
scattered power outages over the extensive area.

Get actionable weather insights
For more information or to request a demo of one of our utility
solutions, please visit www.dtn.com/weather/utilities/
28

Public safety & sports discussion
With COVID restrictions easing, more and more people are organizing, attending, and
participating in outdoor events — and there are high expectations that they are well-run,
safe, and orderly. From COVID safety protocols to weather contingency plans, preparation is
essential, and the forecast must be considered. Notably, the ENSO neutral pattern presents an
elevated risk of tropical storms in the Atlantic, especially for the Mid-Atlantic and Northeast
with the favorable storm track. Staff at events held in these areas must be aware of potential
tropical storm activity. Wetter than normal conditions across the Eastern United States
and increased storms will require extra precautions, as heavy rainfall events could impact
public safety and outdoor event logistics. In the Northern Plains and the West, warm and dry
conditions will pose heat safety concerns.

Tropical weather considerations
With the heightened potential for tropical storms along the Eastern Seaboard and its dense
population centers, event organizers must consider the potential impacts, including flooding
and severe weather. In addition, saturated soil conditions can impact set-up activities, facilities,
and parking, as well as public safety. Since access to accurate weather forecasts is imperative,
a trusted weather tool may be the most critical resource for public safety leaders and event
organizers. Detailed forecasts, local radar data, lightning alerts, National Weather Service
watches and warnings, and professional meteorological consultations are crucial to confident,
timely decision-making, especially when safety is on the line. WeatherSentry® also integrates
tropical weather data, so event organizers don’t need to search for that information from other
sources. Users can access the official storm track, wind potential, tropical rainfall, wave height,
and storm surge. Even more detailed tropical storm advisory support available. A tropical daily
planner resource can be established for specific storms and issues a twice-daily planner for
comprehensive storm insights, related warning advisories, and decision guidance.
29

   Public safety & sports discussion

Hot weather
Most of the country is expected to have above-
normal temperatures this summer, and with
the elevated heat, safety risks and concerns
also rise. Heat plays a role in weather-related
fatalities each year and is the leading cause
of weather-related deaths among U.S high
school athletes. Having accurate information
and observations to monitor extreme heat and

humidity is imperative this season.
WeatherSentry offers forecast
conditions, current conditions,
and custom, location-based alerts
for temperatures, the heat index,
and Wet Bulb Globe Temperature
(WBGT). WBGT measures heat
stress in direct sunlight. It differs
from the heat index, which
also looks at temperature and

humidity — but in the shade. While not as commonly referenced as the heat index, WBGT is
vital for addressing how prolonged heat exposure pushes the human body beyond its limits.
When extreme heat combines with high humidity, it can become lethal.

Severe weather
Severe weather can challenge the best-laid event plans. High winds can uproot trees, hail
can break windows and cause other damage, lightning strikes can be deadly, and dangerous
tornadoes can develop with little or no advance warning. Real-time alerts are essential for
monitoring fast-changing severe weather conditions. With lightning, hail, and severe storms
expected throughout much of the United States this summer, one of the best ways to keep
30

  Public safety & sports discussion

                                        people safe is real-time alerts and on-site, multi-directional sirens
                                        with beacons. Real-time alerts to approaching weather support
                                        those who need to seek shelter fast. This information can help guide
                                        timely decisions that improve safety and resource management.

                                           If you are responsible for people playing, practicing,
                                           working, or enjoying the outdoors when inclement
                                           weather strikes, you must be fully aware of potential
The OnGuard siren system with beacon.
                                           hazards and have an evacuation plan ready. Download
                                           our e-book for important information on weather
                                           monitoring and alert systems.

     The 2015 heatwave
     An early-season heatwave consumed the United States during June 2015, impacting
     events throughout the country. Notably, the Pacific Northwest and West Coast
     experienced near-record temperatures, with 16 different states seeing above-average
     temperatures. Many cities set new, all-time June temperature records — even Boise, Idaho,
     hit temperatures near 110 degrees Fahrenheit (F).

     Seattle saw its hottest summer on record, with an average high of 80.2 degrees F,
     impacting events all summer long. In Oregon’s Willamette Valley and the Portland
     metropolitan area, at least four deaths were blamed on the heat, according to NOAA.

    Get actionable weather insights
    For more information or to request a demo of one of our public safety
    visit www.dtn.com/weather/public-safety/, and for sports please
    visit www.dtn.com/weather/sports-recreation/
www.dtn.com ©2021 DTN, LLC, all rights reserved. “DTN” and the degree symbol logo are trademarks of DTN, LLC
You can also read