Investigation of thermal changes in the thyroid gland region of individuals with hypothyroidism and fibromyalgia by analyzing the temperature of ...
←
→
Page content transcription
If your browser does not render page correctly, please read the page content below
www.nature.com/scientificreports
OPEN Investigation of thermal changes
in the thyroid gland region
of individuals with hypothyroidism
and fibromyalgia by analyzing
the temperature of brown adipose
tissue
Ana Paula Christakis Costa1*, Joaquim Miguel Maia2, Marcos Leal Brioschi3 &
José Eduardo de Melo Mafra Machado4
This exploratory retrospective study aims to investigate the thermal changes in the thyroid gland
region of patients with hypothyroidism and fibromyalgia by analyzing the temperature of the brown
adipose tissue (BAT). A total of 166 individuals from 1000 thermographic electronic medical records
were classified into four groups: Group HP + FM-50 individuals with hypothyroidism and fibromyalgia;
Group FM-56 individuals with fibromyalgia only; Group HP-30 individuals with hypothyroidism only,
and Group Control-30 healthy individuals. The thermal images from the electronic medical records
were acquired by a FLIR T650SC infrared camera (used for thermometry) and the temperature data
for each group were statistically analyzed. Group HP + FM showed r = 0, meaning that the average
temperatures of the thyroid and BAT are independent of each other. Groups FM, HP and Control
showed r = 1, meaning that the average temperatures of the thyroid and BAT were directly related.
Our findings showed that the average temperatures of the thyroid and BAT regions are similar. Also,
there was no correlation between thyroid gland temperature and the presence of hypothyroidism or
fibromyalgia using thermometry.
Medical infrared thermography (MIT) is a noninvasive and nonradioactive analysis method capable of analyz-
ing physiological functions related to the control of skin temperature, an important organ for controlling body
temperature1,2. This thermography´s technique allows the evaluation of physiological changes2,3, with applica-
tions in the field of medicine to identify neurological, rheumatological and dermatological disorders, vascular
diseases, urologic, and gynecological and orthopedic pathologies3–7, and this method can provide support for
sports medicine3.
Fibromyalgia (FM) is a rheumatologic disorder, of undefined cause, but its development is associated with
the central nervous system’s regulation of pain8,9, neurosensory, neuroendocrine and neurotransmitter-related
redisposition10,11. FM is characterized by musculoskeletal pain in diffuse to chronic
disorders, as well as a genetic p
intensity and is associated with symptoms such as fatigue, sleep disturbances, palpebral venous congestion, morn-
ing stiffness, diffuse paresthesia, subjective sensation of edema, cognitive disorders, depression and anxiety10,12,13.
When a thermography examination is performed in a patient with FM, the patient presents a characteristic image
pattern of the mantle sign that means a wide and diffuse hyper-radiation on the cervicothoracic region, low level
1
Graduate School of Electrical Engineering and Applied Computer Sciences (CPGEI), Federal University of
Technology - Paraná (UTFPR), Avenida Sete de Setembro, 3165, Rebouças, Curitiba, Paraná 80230‑901,
Brazil. 2Electronic Engineering Department and Graduate School of Electrical Engineering and Applied Computer
Sciences (DAELN ‑ CPGEI), Federal University of Technology - Paraná (UTFPR), Curitiba, Brazil. 3Neurology
Department of Clinic Hospital of São Paulo, University School of Medicine, Brazilian Association of Medical
Thermology, São Paulo, SP, Brazil. 4Brazilian Association of Medical Thermology, São Paulo, SP, Brazil. *email:
anachristakis@gmail.com
Scientific Reports | (2021) 11:6526 | https://doi.org/10.1038/s41598-021-85974-0 1
Vol.:(0123456789)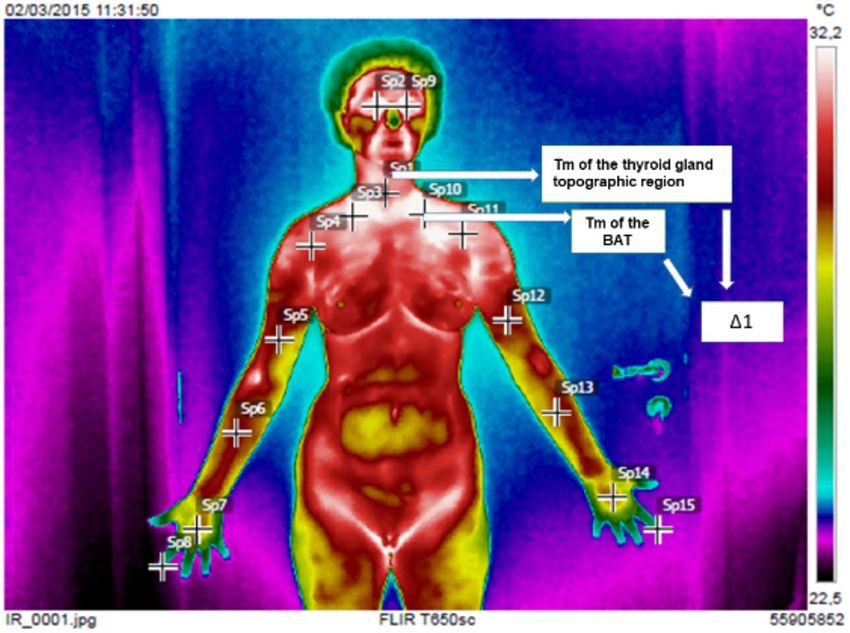
www.nature.com/scientificreports/
cooling of the extremities due to the Raynaud p henomenon11,14,15, and hyperperiocular radiation, resulting from
palpebral venous congestion due to non-repairing sleep and fatigue (daytime tiredness)11,13,16,17.
MIT can quantify the non-shivering thermogenesis (NST) of brown adipose tissue (BAT)16. BAT is an endo-
crine adipose tissue with attributes to dissipate energy as heat in response to changes in temperature and diet18.
It is an important regulator of energy balance and metabolism in homeothermic animals and it is metabolically
less active in adults than in newborns, because its main function is thermogenesis, which is the ability to burn
calories to generate h eat7,15,18. BAT can be located deep within the neck and trunk, near the great vessels, in the
supraclavicular, supra-axial, paraspinal, and perirenal regions, in sympathetic ganglia and striations of the skeletal
muscles and, finally, just below the skin7,15,18. Resting BAT activity and FM incidence are higher in women15,19–21,
with lower adaptive thermogenesis in this g roup7.
BAT plays an integral role in adaptive thermogenesis due to its ability to rapidly generate significant amounts
of heat from fatty acids and glucose, allowing the dissociation of ATP production from the mitochondrial breath-
ing. As heat is lost from the body, this represents the liquid loss of energy and has the potential to contribute
to body weight22–27. The interaction between BAT activation and the thyroid is complex. The thyroid, as an
important regulator of energy expenditure, can modulate the heat generation capacity of BAT, thus, the thyroid
hormone reduced concentrations can therefore affect BAT activity directly or centrally reduce sympathetic
nervous system (SNS) a ctivation22.
BAT’s thermogenic activity is increased by the same conditions that aggravate FM symptoms due to the
distribution of brown adipose enervation and surrounding tissues7,28,29. In addition, when there is a decrease
in body temperature, there is also a decrease in metabolic and body temperature r ates15,30,31, because BAT dis-
tribution is related to tender points (TP), it is thought that it may become sensitized and cause pain in the TP
region15,16,29,30. Stress and cold stimulate thermogenesis and aggravate FM symptoms, therefore, patients feel
cold intolerance. Warming temporarily suspends thermogenesis and pain, and heat suspends thermogenesis
and relieves FM s ymptoms5,16,30.
Hypothyroidism (HP) is a disorder that occurs when the thyroid gland does not produce enough thyroid
hormone to meet the body’s needs to regulate metabolism, that is, the way the body uses e nergy32,33; and affects
almost every organ in the body. The most prevalent form is caused by a failure of the gland itself, but also, hypo-
thyroidism may occur due to hypothalamic or pituitary disease33,34. Hypothyroidism (HP) may exhibit nonspe-
cific symptoms similar to FM, such as fatigue, sleep disorders, intestinal changes, weight gain and body aches33.
Compared to a 1–5% incidence of hypothyroidism in the general population, there is a reported incidence of
10–14% in patients with F M35,36.
Thus, an incidence of hypothyroidism in FM shows a positive correlation between the TSH level and pain
distribution, that is, it increases the possibility that FM pain distribution is associated with hypothyroidism37,38.
And there is still evidence that most cases of FM are associated with difficulties in the production or use of the
thyroid, although they have documented the similar appearance of FM and H P39,40. It is believed that there is a
greater prevalence of thyroid problems in FM patients, but it is difficult to confirm if treatment of these conditions
will also improve FM symptoms. Under the condition of no pathology/disorder, the thyroid gland has the same
temperature as the adjacent soft tissues. However, in the presence of a hypermetabolism of the nodules or the
whole gland, it will be highlighted in the thermogram. In both cases it will be possible to assess the temperature
of the region using standard measurement points in the thermographic i mages11.
Based on the above arguments, the following research question was raised: is the noninvasive MIT technique
effective in assessing thyroid gland temperature in HP and FM patients?
It is known that the symptoms of FM are similar to those of HP. Thus, in certain situations patients are mis-
diagnosed since FM diagnosis is essentially clinical and HP is laboratory based. An investigation of FM, HP and
a control group (healthy individuals) can help determine whether there is a connection between the thyroid
gland metabolism level in these groups. This investigation can help determine if, within the selected database,
there is a thermographic correlation in individuals with or without HP. Therefore, the objective of this work
was to investigate the thermal changes in the thyroid gland and the BAT regions of patients with HP and FM to
evaluate if there was a correlation between these regions’ temperatures in patients with these diseases compared
to a control group (without HP and FM).
Materials and methods
This study was approved by the Research Ethics Committee (CEP) of the Federal University of Technology
– Paraná (UTFPR) via Plataforma Brasil, protocol number 1.054.356, according to the Brazilian Ministry of
Health rules that follow all International Ethical Guidelines for Biomedical Research Involving Human Subjects,
produced by the Council for International Organizations of Medical Sciences (CIOMS).
As the research have been conducted using a database, without any interview with patients, the need for
informed consent was waived by the Ethics Committee of the Federal University of Technology- Parana (UTFPR).
The research work was carried out from January 2017 to December 2019 and, relating to the objectives, the
study design was exploratory retrospective and the approach was quantitative transversal. The data acquisition
process was based on access to a database of a thermography clinic, where the records of patients diagnosed with
fibromyalgia, hypothyroidism and without both diseases were selected. The electronic records of 166 individuals
from a total of 1000 records were selected using the following inclusion criteria:
• Individuals attended the clinic from 2014 to 2016;
• The data was collected retrospectively;
• Records contained anteroposterior (AP) upper orthostatic and AP cervical extension images;
• Complete thermographic reports;
Scientific Reports | (2021) 11:6526 | https://doi.org/10.1038/s41598-021-85974-0 2
Vol:.(1234567890)www.nature.com/scientificreports/
Camera parameters Values
Resolution 640 × 480 pixels
Thermal Sensitivity (at 30 °C) < 20 mk @ 30 °C
Field of view 25° × 19°/0.25 mm
Image frequency 30 Hz
Spectral range 7.5 to 14 μm
Spatial resolution 0.68 mrad
Focus Continuous, one chot or manual
Temperature range − 40 °C to + 150 °C; + 100 °C to + 650 °C; + 300 °C to 2000 °C
Measurement accuracy ± 1 °C or ± 1% of reading
Temperature accuracy ± 2 °C
Temperature resolution 0.1 °C
Emissivity 0.98
Reflection temperature 20 °C
Atmospheric temperature 23 °C
Relative humidity 50%
Distance from camera to the subject 1m
Table 1. Technical specifications of the FLIR T650SC infrared camera used to acquire the patients’ thermal
images.
• Male and female individuals;
• Over 18 years old;
• The patients follow the standardized exam preparation recommendations of the Brazilian Society of Ther-
mology—ABRATERM and, according to the rules of the thermography clinic, patients should be fasting for
at least 2 h before the exams;
• All patients remained for 15 min in the laboratory for acclimatization before the exams;
• The body mass index (BMI) was not considered in the survey because the data was not available in the data-
base fields;
• Groups with FM and HP, FM only, HP only and healthy individuals;
• Laboratory reports for HP diagnosis. All patients had their serum TSH levels controlled;
• Radiological examination reports;
• Demographics of the patient´s profile;
• FM diagnosed according to the criteria of the American College of Rheumatology (ACR)13,38, and HP diag-
nosed by laboratory examination; and
• Preliminary questionnaire for FM criteria that assists the medical professionals in the diagnosis
(ACR/2010)13,40. The results obtained within this questionnaire for the generalized index of pain (WPI), and
scale of gravity of symptoms (SS) should remain between WPI ≥ 7/19 + SS ≥ 5 or WPI 3–6 + SS ≥ 9.
The individuals’ records were selected from the database and classified into four groups:
• Group HP + FM: patients with FM and HP, 50 patients, 48.4 ± 13.6 years old, 48 females and 2 males,
WPI = 11.6 and SS = 9.4;
• Group FM: patients with FM only, 56 patients, 44.8 ± 8.7 years old, 48 females and 8 males, WPI = 10.4 and
SS = 8.8;
• Group HP: patients with HP only, 30 patients, 24 females and 6 males, 53.0 ± 14.0 years old, WPI = 3.5 and
SS = 3.5.
• Group Control: control group, with 30 healthy individuals, 44.5 ± 11.0 years old, 18 females and 12 males,
WPI = 3.8 and SS = 5.3.
The database thermal images were acquired retrospectively using the FLIR T650SC infrared Camera (Flir
Systems Inc. Nashua, NH, USA) with the technical specifications shown in Table 1. The AP thermography’s
images with cervical extension and the AP upper orthostatic images were obtained with individuals positioned
at 1 m from the camera in an orthostatic position. The images were processed on a computer using the FLIR
Report program (FLIR Tools, version 4.1.140661001) and the temperature data were obtained and analyzed. The
block diagram of the setup used to acquire the thermal images is shown in Fig. 1.
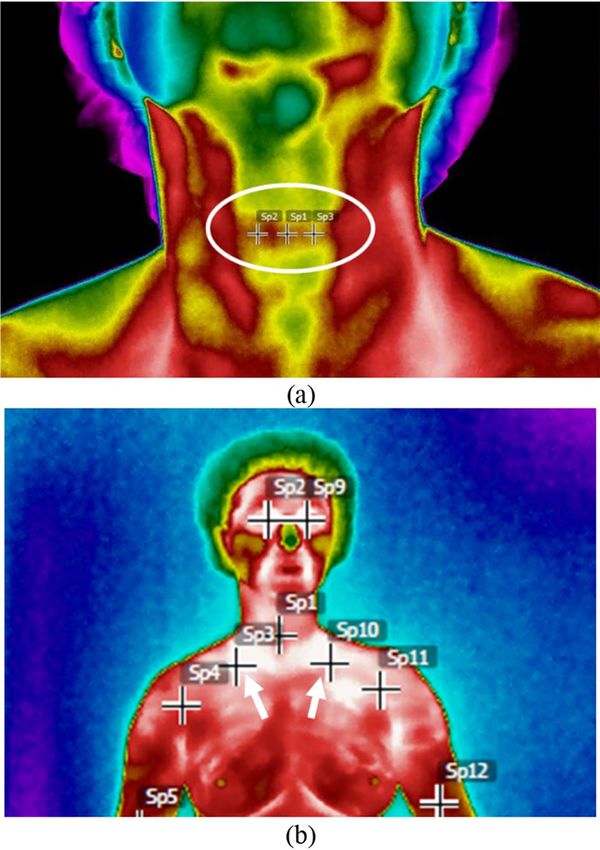
The AP thermography’s images with cervical extension were analyzed using the average temperatures of
three thermal points (Fig. 2a) selected by the researchers. For the AP upper orthostatic images, the thermal
points located bilaterally (SP3 and SP10) in the medial supraclavicular region were used, that is, in the BAT
region (Fig. 2b).
With the temperatures obtained for each individual, the data were organized into a table with the following
specifications: data were organized with a numerical identification for each individual, with an associating age,
gender, and FM diagnosis according to the criteria of the ACR/2010 and Preliminary Questionnaire for FM
Scientific Reports | (2021) 11:6526 | https://doi.org/10.1038/s41598-021-85974-0 3
Vol.:(0123456789)www.nature.com/scientificreports/
Camera FLIR Analysis of the
Individual Computer
T650SC temperatures
Figure 1. Setup of a thermal data measurement system.
Figure 2. Points to measure the temperature in the (a) thyroid region and (b) in the brown adipose tissue
(BAT) region (SP3 and SP10).
Criteria15; a diagnosis for HP (based on clinical laboratory tests and anamnesis analysis), and temperatures of
the thyroid gland and BAT regions.
Temperatures obtained for each group were statistically analyzed with the Microcal Origin 6.0 software
(OriginLab Corporation, Northampton, Massachusetts, USA), which obtained the average age and standard
deviation of the groups, the average temperature (Tm) and standard deviation for each group (thyroid and BAT),
comparisons between the groups, and the average temperature difference (Δ1) between each region studied
(Fig. 3). The software also applied a variance test (ANOVA) to evaluate if the average temperatures of the two
regions were equal or different. Student’s t-test was used to compare the average temperature differences between
the groups.
The Action Stat application was used to obtain the Principal Component Analysis (PCA). Individuals were
grouped according to their variances, that is, according to their behavior within the population, represented by
the variation of their set of characteristics (Thyroid and BAT temperatures). The analysis allowed for a reduction
in the number of variables to provide a view of the data set, and thereby helped to identify the most important
variables in the space of the main components.
The last statistical analysis was used to obtain the Pearson’s linear correlation coefficient or "Pearson’s r" to
assess the degree of correlation and the direction of this correlation. Thus, if the correlation the variables is equal
to 1, it is a positive correlation, meaning the variables are directly proportional to each other. If the correlation
is negative (r = − 1), the variables are indirectly proportional to each other. Finally, if r = 0, the two variables are
not linearly dependent.
Ethics approval. This study was approved by the Research Ethics Committee (CEP) of the Federal Univer-
sity of Technology – Paraná (UTFPR) via Plataforma Brasil, protocol number 1.054.356, according to the Brazil-
Scientific Reports | (2021) 11:6526 | https://doi.org/10.1038/s41598-021-85974-0 4
Vol:.(1234567890)www.nature.com/scientificreports/
Figure 3. Points used to calculate the average temperature difference (Δ1) between the Tm of thyroid region
and BAT.
35 p = 0.38
f = 1.01
Average temperature of the thyroid (°C)
34
33
32
31
30
29
28
Group HP+FM Group FM Group HP Group Control
Groups
Figure 4. Average temperatures of the thyroid gland region for Group HP + FM, Group FM, Group HP and
Group Control.
ian Ministry of Health rules that follow all International Ethical Guidelines for Biomedical Research Involving
Human Subjects, produced by the Council for International Organizations of Medical Sciences (CIOMS).
Consent to participate. As the research was carried out in a database, without conducting an interview
with patients, the need for informed consent was waived by the Ethics Committee of the Federal University of
Technology of Paraná (UTFPR).
Results
From the 166 individuals selected for this research, 106 were diagnosed with FM according to the ACR
criteria13,40, 80 patients were diagnosed with HP, and 30 showed no evidence of the pathology.
The temperature difference found in the thyroid gland region of the individuals in Group HP + FM
was + 1.1 °C. The average temperatures (Tm) of the three selected points in the thyroid gland were 31.7 ± 1.6 °C
for Group HP + FM, 31.6 ± 1.2 °C for Group FM, 32.3 ± 1.5 °C for Group HP and 31.9 ± 1.5 °C for Group Control
(see Fig. 4). The obtained differences Δ1 were: 0.1 °C between groups FM + HP and FM, 0.6 °C between groups
FM + HP and HP, 0.2 °C between groups FM + HP and Control, 0.7 °C between groups FM and HP, 0.3 °C
between groups FM and Control, and 0.4 °C between groups HP and Control.
The variance analysis showed that the samples are not significantly different from each other, with an occur-
rence probability (p) of 0.38 and a frequency of occurrence (f) of 1.01.
The average temperature of the two points (SP3 and SP10) in the BAT region was 31.7 ± 1.5 °C for Group
HP + FM, 31.5 ± 1.2 °C for Group FM, 31.4 ± 1.0 °C for Group HP and 31.5 ± 1.5 °C for Group Control (see Fig. 4).
The Δ1 was 0.2 °C between groups FM + HP and FM, 0.3 °C between groups FM + HP and HP, 0.2 °C between
groups FM + HP and Control, 0.1 °C between groups FM and HP, 0.0 °C between groups FM and Control, and
0.1 °C between groups HP and Control (see Fig. 5). The analysis of variance showed that the samples are not
significantly different from each other, with p = 0.51 and f = 0.76.
Scientific Reports | (2021) 11:6526 | https://doi.org/10.1038/s41598-021-85974-0 5
Vol.:(0123456789)www.nature.com/scientificreports/
35
p = 0.51
f = 0.76
34
Average temperature of the BAT (°C)
33
32
31
30
29
28
Group HP+FM Group FM Group HP Group Control
Groups
Figure 5. Average BAT temperatures for Group HP + FM, Group FM, Group HP and Group Control.
Comparing the average temperatures of the thyroid gland region with the average temperatures of the BAT,
the Pearson’s correlation coefficient "r" was 0 (zero) for the overall analysis, where all groups were compared
with each other. The Pearson’s coefficients were: r = 0 for Group HP + FM, r = 1 for Group FM, r = 1 for Group
HP, and r = 1 for Group Control. The correlation equal to 1 means that the variables have a positive correlation
and are directly proportional.
The ANOVA test, when applied to test for a comparison between the average temperatures of the thyroid and
BAT, showed that the mean temperatures are not significantly different, and the t-test showed that the samples are
not significantly different. The obtained results were f = 1.4 and p = 0.24 for Group HP + FM, p = 0.35 and f = 0.55
for Group FM, f = 3.0 and p = 0.08 for Group HP, and f = 0.40 and p = 0.71 for Group Control.
The principal component analysis (PCA) for the average temperatures of the thyroid gland region and BAT
for Group HP + FM showed that the first principal component (PC1) explains 89.7% of the total variation, where
average temperatures were grouped according to their variance (0.89). PC2 explained 10.3%, with a variance
of 0.10. The PC1 for Group FM explains 92.5% of the total variation, with a variance of 0.92, and PC2 explains
7.5% with variance of 0.07. The PC1 for Group HP explains 55.3% of the total variation of the samples with a
variance of 0.74, and PC2 explains 44.6% with a variance 0.69. The PC1 for Group Control explains 96.7% of the
total variation of the samples with a variance of 0.96, and PC2 explains 3.3% with variances of 0.03.
Analyzing the four groups, the first principal component (PC1) explains 42.96% of the total variation and,
according to the eigenvectors, the weights variations of Group HP + FM are negatively high for this component.
That is, the higher the average temperatures of the thyroid gland region and BAT were, the lower the score of the
first component was. For Group FM, Group HP and Group Control, according to the eigenvectors, the weights
variations are positive. Therefore, with an increase in temperature, the score of the first component will also
increase (Fig. 6).
Discussion
The temperature difference found in the thyroid region of patients with FM and HP (Group 1) by thermography
was + 1.1 °C with r = 0, so the temperature variation does not impact in average temperatures of this group and
the variables had no correlation. That is, for this study group, thyroid metabolism variation and BAT temperature
variation are independent of each other, independent of the patient´s diagnosis for HP and FM. However, it was
found by other authors that average temperature values higher than 0.26 °C from normal human temperature
(36.5 °C to 37.0 °C) already show alterations in thyroid gland m etabolism41. It should be noted that in the study,
the authors evaluated only the temperature variation of the thyroid gland, without correlating another variable
as considered in this paper such as HP and FM.
The average temperatures of the three regions of the thyroid gland were similar to each other, as the analysis
of variance and Δ1 between groups ranged from 0.1 to 0.7 °C. According to some results reported in the literature
for the trunk region, temperature variations of 0.17 ± 0.042 °C showed abnormalities38, which do not agree with
the results of other research conducted in the same anatomical region that found temperature variations of 0.5 °C
to 1 °C41. The patients had homogeneous characteristics, besides, TSH serum levels controlled.
HP is among the thyroid dysfunctions that have nonspecific symptoms similar to symptoms of F M33,42. In the
literature it can be found that HP dysfunction presents alterations in the hypophysis-hypothalamic axis where FM
patients have less thyrotropin (TSH)33,43–50. Therefore, in FM patients, pain is being investigated related to changes
in the hypothalamic-hypophysis-adrenal axis, and it is still unknown if both cases of HP and FM hyperactivity
are present in these axes. It is not known whether this hyperactivity is genetically based or whether it is a result
of stress throughout life, or in a specific situation.
BAT is also a target of thyroid hormones, where they present a large number of 3, 5, 3′-triiodothyronine
(T3) receptors that are 70% occupied at room temperature and approximately 100% occupied during cold
exposure45,51. In fact, BAT has its own T3-generating mechanism, due to the local activity of the enzyme deiodi-
nase type II, D2. The activity of this enzyme and T3 concentration increases 3 to 50 times during the sympathetic
activation of BAT, resulting in an increase in the local impact of T3, without affecting the plasma concentration
Scientific Reports | (2021) 11:6526 | https://doi.org/10.1038/s41598-021-85974-0 6
Vol:.(1234567890)www.nature.com/scientificreports/
Figure 6. PCA analysis for Group HP + FM, Group FM, Group HP and Group Control.
of T3. Thus, sympathetic activation of BAT results in local hyperthyroidism and increased heat p roduction45,51.
In contrast, this study analyzed hypothyroidism patients, who presented low metabolic indices, cold intolerance,
muscle weakness, fatigue, bradycardia, myxedema, depression and cognitive deficits. It was observed that the
average temperatures of BAT showed only a difference of 0.2 °C from Group HP + FM (31.7 °C) to Group FM
(31.5 °C), and 0.3 °C from Group HP + FM (31.7 °C) to Group HP (31.4 °C), 0.2 °C between groups FM + HP
(31.7 °C) and Control (31.5 °C), 0.1 °C between groups FM (31.5 °C) and HP (31.4 °C), 0.0 °C between groups
FM (31.5 °C) and Control (31.5 °C), and 0.1 °C between groups HP (31.4 °C) and Control (31.5 °C). Thermal
imagens have been established as a valid alternative for diagnosis for BAT activity and F M5,22. In this research,
small differences in temperatures were found between the groups, as the thermography equipment measures the
body’s infrared energy, demonstrating the thermal distribution of the skin surface by a high-resolution image.
In this way, the temperature can be measured from the energy emitted by the skin surface in a totally safe way,
that is, without any c ontraindications11.
Nevertheless, according to the results, there were no significant differences in the temperatures of BAT
between the three groups, and r = 1, reinforcing that the average temperatures of the thyroid region and BAT are
interdependent. That is, when there is a variation in the metabolic rate of the thyroid, there will be a variation in
the rate of BAT activity. Therefore, elucidating this result requires knowing the impacts of thyroid hormones in
human biology, in which acceleration of energy metabolism and ATP turnover are related as a result of energy
transformation to heat production52. In these terms, thyroid hormones as mediators of homeotherm are present
in homeothermic animals, and are capable of stimulating heat production. In humans with HP there is hypo-
thermia and cold intolerance, lose part of their homeothermy and the ability to adapt to the environment45,52.
In the literature there are indications that other diseases should be excluded before starting FM treatment,
because there are similarities of symptoms33 to other diseases such as HP, hyperparathyroidism (parathyroid
adenoma) and autoimmune thyroiditis due to autoimmune disease46,53,54. Therefore, it was necessary to know
the patient’s profile from the selected records to classify groups and to discard other diseases that could impact
Scientific Reports | (2021) 11:6526 | https://doi.org/10.1038/s41598-021-85974-0 7
Vol.:(0123456789)www.nature.com/scientificreports/
the results. Thus, the following symptoms were observed in the questionnaire for preliminary FM criteria:
chronic pain in the body, showing hyper-radiant r egions54–57, depression, tiredness, non-repairing sleep, signs
of periocular congestion, constipation, diarrhea, headache and the correlation of chronic generalized pain such
as myalgias, arthritis, arthrosis and r heumatism33,45,49. All patients maintained controlled treatment for thyroid
dysfunction, especially for HP.
According to the parameters of the questionnaire for preliminary FM criteria, a patient with FM is diagnosed
as such if he or she presents a composition of factors such as the combination between a generalized index of
pain (WPI) ≥ 7/19 + a scale of gravity of symptoms (SS ≥ 5) and/or WPI between 3 and 6 + SS ≥ 9, besides clinical
exams38,53,54,58,59.
However, patients selected for this study had, in Group HP + FM, a mean WPI = 11.6 and a mean SS = 9.4, that
in combination confirmed the disease. Group FM had a mean WPI = 10.4 and a mean SS = 8.8, also confirming
FM but with normal HP laboratory results. Group HP had a mean WPI = 3.5 and a mean SS = 3.5, the patients
included in this group showed no FM, and Group Control presented a mean WPI = 3.8 and a mean SS = 5.3;
confirming normality for FM according to ACR38.
In this research, it was observed that FM patients presented mantle signals that could be indicated of neu-
rovegetative disorders, besides periocular congestion (nonrestorative sleep), vasospasms in the extremities and
other signs30,52.
Results of the thermography diagnostic examination, although not a definitive diagnosis, suggest that mantle
phenomena together with peripheral vasoconstriction can support clinical diagnosis and play important roles in
the follow-up of FM patients as markers of neurovegetative dysfunction present in the d isease54.
This study followed the outlined objective using a database containing thermographic images and, to carry
out the research, there was no contact with the patients. The database with the medical records did not include
some data, such as the BMI and serum TSH levels. Future works can be done by analyzing other variables, such
as temperatures of other parts of the body, other pathologies, as well as analyzing the impact of BMI.
Conclusions
Analyzing the results in this work, it was possible to conclude that the average temperatures of the three thyroid
points (p = 0.38, f = 1.01) and the two BAT points (p = 0.51, f = 0.76) for the surveyed groups were not different,
with a Pearson’s correlation coefficient (r) equal to zero, signifying that thyroid metabolism variation and BAT
temperature variation are independent of each other, independent of the patient´s diagnosis for HP and FM. A
similar result was confirmed when applying the Pearson correlation coefficient between the data obtained from
the thyroid gland and the BAT regions. The group composed by patients with HP and FM, showed r = 0, meaning
also that the thyroid and BAT temperatures are not correlated. Therefore, a variation in the metabolic activity of
the thyroid gland does not imply BAT activity.
As for the group composed of individuals with FM and without HP, the group for individuals with HP, and
the control group (healthy subjects), it was found r = 1, meaning that the average temperatures of the thyroid and
BAT are directly related, where a variation in the metabolic activity of the thyroid gland exhibits an interaction
with the variation in the metabolic rate of BAT.
Thus, it was possible to conclude that this thermometry technique can be used for measuring the temperatures
of the thyroid gland and BAT regions in order to evaluate their changes. This study has shown that that mean
thyroid and BAT temperatures are similar and there was no correlation between thyroid temperature and the
presence of hypothyroidism or fibromyalgia using thermometry.
Data availability
Not applicable.
Code availability
Not applicable.
Received: 7 September 2020; Accepted: 9 March 2021
References
1. Merla, A., Mattei, P. A., Di Donato, L. & Romani, G. L. Thermal imaging of cutaneous temperature modifications in runners during
graded exercises. Ann. Biomed. Eng. 38(1), 158–163 (2010).
2. Mohammadi, F. & Rastgar, M. Analytical and experimental solution for heat source located under skin modeling chest tumor
detection in male subjects by infrared thermography. J. Med. Biol. Eng. 38, 316–324 (2018).
3. Ring, E. F. & Ammer, K. Infrared thermal imaging in medicina. Physiol. Meas. 33(3), 33–46 (2012).
4. Hildebrandt, C., Raschner, C. & Ammer, K. N. An overview of recent application of medical infrared thermoghaphy in sports
medicine in Austria. Sens. Basel 10(5), 4700–4715 (2010).
5. Lee, P., Ho, K. K. & Greenfield, J. R. Hot fat in a cool man: infrared thermography and brown adipose tissue. Diabetes Obes. Metab.
13(1), 92–93 (2011).
6. Chojnowski, M. Infrared thermal imaging in connective tissue diseases. Reumatologia 55(1), 38–43 (2017).
7. Jeschonneck, M., Grohmann, G., Hein, G. & Sprott, H. Abnormal microcirculation and temperature in skin above tender points
in patients with fibromyalgia. Rheumatology 39(8), 917–921 (2000).
8. Costa, J. M. F., Ranzolin, A., Costa, C. A., Marques, C. D. L. & Duarte, A. L. B. P. Frequência elevada de hiperparatireoidismo ass-
intomático em pacientes com fibromialgia: associação ao acaso ou erro diagnóstico?. Rev. Bras. Reumatol. 56(5), 391–397 (2016).
9. Yavne, Y., Amital, D., Watad, A., Tiosano, S. & Amital, H. A systematic review of precipitating physical and psychological traumatic
events on the development of fibromyalgia. Semin. Arthitis Rheum. 48(1), 121–133 (2018).
10. NHS [homepage in internet]. Fibromyalgia: Symptoms (acessed 21 november 2020); https://www.nhs.uk/conditions/fibromyalg
ia/symptoms/.
Scientific Reports | (2021) 11:6526 | https://doi.org/10.1038/s41598-021-85974-0 8
Vol:.(1234567890)www.nature.com/scientificreports/
11. Brioschi, M. L. Infrared Thermographic Score for Complemetary Diagnosis of Fibromyalgia. Post-doctoral thesis, Faculty of
Medicine, University of São Paulo (2008).
12. Heymann, R. E. et al. Consenso brasileiro do tratamento da fibromialgia. Rev. Bras. Reumatol. 50(11), 56–66 (2010).
13. Wolfe, F. et al. The American College of Rheumatology preliminary diagnostic criteria for fibromyalgia and measurement of
symptom severity. Arthritis Care Res. 62(5), 600–610 (2010).
14. Heimbecher, C. T. & Ulbricht, L. Termografia aplicada ao fenômeno de Raynaud: artigo de revisão bibliométrica. Pan Am. J. Med.
Thermol. 4, 15–23 (2018).
15. Brioschi, M. L., Yeng, L. T., Araujo, J. O., Pezzucchi, M. Z. & Teixeira, M. J. Modulação da dor na síndrome fibromiálgica um
distúrbio termorregulador. Pan Am. J. Med. Thermol. 1(2), 71–80 (2015).
16. Costa, A. P. C., Maia, J. M., Brioschi, M. L. & Machado, J. E. M. M. Correlation of BAT activity with the metabolic activity in the
thyroid of patients with fibromyalgia. In Proc. SPIE 10137, Medical Imaging 2017: Biomedical Applications in Molecular, Structural,
and Functional Imaging 181 (2017).
17. Niedermeyer, E., Jankel, W. R. & Uematsu, S. Falling asleep: observations and thoughts. Am. J. EEG Technol. 26(3), 165–175 (1986).
18. Brasil, S. et al. A systematic review on the role of infrared thermography in the Brown adipose tissue assessment. Rev. Endocr.
Metab. Disord. 21, 37–44 (2020).
19. Cypess, A. M. et al. Identification and importance of brown adipose tissue in adult humans. N. Engl. J. Med. 360, 1509–1517 (2009).
20. Drubach, L. A. et al. Pediatric brown adipose tissue: detection, epidemiology, and differences from adults. J. Pediatr. 159, 939–944
(2011).
21. Nath, C. et al. A study on concomitant occurrence of subclinical hypothyroidism and reduced growth hormone secretion on
fibromyalgia. J. Evid. Med. Healthc. 2(25), 3735–3741 (2015).
22. Law, J. M. et al. Brown adipose tissue response to cold stimulation is reduced in girls with autoimmune hypothyroidism. J. Endocr.
Soc. 3(12), 2411–2426 (2019).
23. Nedergaard, J. et al. UCP1: the only protein able to mediate adaptive non-shivering thermogenesis and metabolic inefficiency.
Biochim. Biophys. Acta 1504(1), 82–106 (2001).
24. Cannon, B. & Nedergaard, J. Brown adipose tissue: function and physiological significance. Physiol. Rev. 84(1), 277–359 (2004).
25. Meyer, C. W. et al. Adaptive thermogenesis and thermal conductance in wild-type and UCP1-KO mice. Am. J. Physiol. Regul.
Integr. Comput. Physiol. 299(5), R1396–R1406 (2010).
26. Klingenberg, M. & Huang, S. G. Structure and function of the uncoupling protein from brown adipose tissue. Biochim. Biophys.
Acta 1415(2), 271–296 (1999).
27. Bengtsson, T., Cannon, B. & Nedergaard, J. Differential adrenergic regulation of the gene expression of the b-adrenoceptor subtypes
b1, b2 and b3 in brown adipocytes. Biochem. J. 347(Pt 3), 643–651 (2000).
28. Biasi, G., Fioravanti, A., Franci, A. & Marcolongo, R. The role computerized telethermography in the diagnosis of fibromyalgia
syndrome. Minerva Med. 85(9), 451–454 (1994).
29. Ammer, K., Engelbert, B. & Kern, E. Reproducibility of the hot spot count in patients with fibromyalgia, an intra- and inter-observer
comparison. Thermol. Int. 19(2), 47–51 (2001).
30. Larson, A. A., Pardo, J. V. & Pasley, J. D. Review of overlap between thermoregulation and pain modulation in fibromyalgia. Clin.
J. Pain 30(6), 544–555 (2013).
31. Elert, J., Kendall, S. A., Larsson, B., Månsson, B. & Gerdle, B. Chronic pain and difficulty in relaxing postural muscles in patients
with fibromyalgia and chronic whiplash associated disorders. J. Rheumatol. 28(6), 1361–1368 (2001).
32. Lucas, A. M., Puig, M. & Reverter, J. L. Enfermidades de la glándula tireoides (Elsevier, 2012).
33. Naji, R. I., Turki, K. M. & Al-Osami, M. H. Frequency of hypothyroidism in patients with fibromyalgia syndrome. J. Fac. Med.
Baghdad 55(1), 56–59 (2013).
34. Nogueira, C. R., Kimura, E. T., Carvalho, G. A., Sgarbi, J. A., Ward, L. S., Maciel, L. M. Z., Dias da Silva, M. R., Stein, A. T., Wag-
ner, H. L., Hetem, L. A. B. & Andrada, N. C. Hipotireoidismo: diagnóstico. Diretrizes Clínicas na Saúde Suplementar. Associação
Médica Brasileira e Agência Nacional de Saúde Suplementar 3 (2011).
35. Lowe, J. C. Thyroid status of 38 fibromyalgic patients: implications for the etiology of Fibromyalgia. Clin. Bull. Myofascial Ther.
2(1), 47–64 (1997).
36. Lowe, J. C., Reichman, A., Honeyman, G. S. & Yellin, J. Thyroid status of fibromyalgia patients. Clin. Bull. Myofascial Ther. 3(1),
69–70 (1998).
37. Lowe, J. C., Yellin, J. & Honeyman-Lowe, G. S. Female fibromyalgia patients: lower resting metabollic rates than matched healthy
controls. Med. Sci. Monit. 12(7), CR282–CR289 (2006).
38. Bazzichi, L. et al. Association between thyroid autoimunite and fibromyalgia disease severity. Clin. Rheumatol. 26(12), 2115–2120
(2007).
39. Geenen, R., Jacobs, J. W. G. & Bijlsma, J. W. J. Evaluation and management of endocrine dysfunction in fibromyalgia. Rheum. Dis.
Clin. N. Am. 28, 389–404 (2002).
40. Wolfe, F. et al. The American College of Rheumatology 1990 criteria for the classification of fibromyalgia. Report of the multicenter
criteria committee. Arthritis Rheum. 33(2), 160–172 (1990).
41. Lima, R. P. S., Brioschi, M. L., Teixeira, M. J. & Neves, E. B. Análise termográfica de corpo inteiro: indicações para investigação de
dores crônicas e diagnóstico complementar de disfunções secundárias. Pan Am. J. Med. Thermol. 2, 70–77 (2015).
42. Dibenedetto, M., Yoshida, M., Sharp, M. & Jones, B. Foot evaluation by infrared imaging. Mil. Med. 167(5), 384–392 (2002).
43. Ehrlich, G. E. Pain is real; Fibromyalgia isn´t. J. Rheumatol. 30(8), 1666–1667 (2003).
44. Neeck, G. & Riedel, W. Thyroid function in patients with fibromyalgia syndrome. J. Rheumatol. 19(7), 1120–1122 (1992).
45. Honeyman, G. S. Metabolic therapy for hypothyroid and euthyroid fibromyalgia: 2 case reports. Clin. Bull. Myofascial Ther. 2(4),
19–49 (1997).
46. Garrison, R. L. & Breeding, P. C. A metabolic basis for fibromyalgia and its relates disorder: the possible role of resistence to thyroid
hormone. Med. Hypotheses 61(2), 182–189 (2003).
47. Crofford, L. J. & Demitrack, M. A. Evidence that abnormalities of central neurohormonal systems are key the undestanding
fibromyalgia and chronic fatigue syndrome. Rheum. Dis. Clin N. Am. 22(2), 267–284 (1996).
48. Buskila, D. Fibromyalgia, chronic fatigue syndrome, and myofascial pain syndrome. Curr. Opin. Rheumatol. 13(2), 117–127 (2001).
49. Arnold, L. M. et al. Family study of fibromyalgia. Arthitis Rheum. 50(3), 944–952 (2004).
50. Rodriguez-Espinosa, J. et al. Disfunctión tireoidea em mujeres com sospecha de fibromialgia. Reumatol. Clin. 2(2), 70–77 (2006).
51. Lower, L. C. T3-Induced recovery from fibromyalgia by a hypothyroid patient resistant to T 4 and desiccated thyroid. Thyroid Sci.
5(6), 1–7 (2010).
52. Zingaretti, M. C. et al. The presence of UCP1 demonstrates that metabolically active adipose tissue in the neck of adult humans
truly represents brown adipose tissue. FASEB J. 23(9), 3113–3120 (2009).
53. Lorena, S. B. et al. Evaluation of pain and quality of life of fibromyalgia patients. Rev. Dor. 17(1), 8–11 (2016).
54. Heymann, R. E. et al. Novas diretrizes para o diagnóstico da Fibromialgia. Rev. Bras. Reumatol. 57(2), 467–476 (2017).
55. Brioschi, M. L. Methodology for Standardization of Analysis in the Field of Temperatures in Human Infrared Image. Doctoral
thesis, Federal University of Paraná (2011).
56. Brioschi, M. L. Infrared image in the study diagnosis of fibromyalgia (University of São Paulo, 2007).
57. Brioschi, M. L. et al. Documentação da síndrome dolorosa miofascial por imagem infravermelha. Acta Fisiatr. 14(1), 41–48 (2007).
Scientific Reports | (2021) 11:6526 | https://doi.org/10.1038/s41598-021-85974-0 9
Vol.:(0123456789)www.nature.com/scientificreports/
58. Wolfe, F. et al. Fibromyalgia criteria and severity scales for clinical and epidemiological studies: a modification of the ACR pre-
liminary diagnostic criteria for fibromyalgia. J. Rheumatol. 38(6), 1113–1122 (2011).
59. Kumbhare, D. et al. A survey of physicians´ knowledge and adherence to the diagnostic criteria for fibromyalgia. Pain Med. 19(6),
1254–1264 (2017).
Author contributions
The authors A.P.C.C. and J.M.M. wrote the text of the main manuscript, in addition to performing image treat-
ment and statistical analysis. The authors M.L.B. and J.E.M.M. provided the images from the database. All authors
reviewed the manuscript.
Funding
This work was only possible thanks to the financial support received from Coordination for the Improvement
of Higher Education Personnel (CAPES, No. 001), the Brazilian National Council for Scientific and Technologi-
cal Development (CNPq, No. 306508/2015-0), the Brazilian Study and Project Funding Agency (FINEP, No.
2613/2009), Fundação Araucária (No. 05/2011-10404) and the Brazilian Ministry of Health (No. 2210/2008).
Competing interests
The authors declare no competing interests.
Additional information
Correspondence and requests for materials should be addressed to A.P.C.C.
Reprints and permissions information is available at www.nature.com/reprints.
Publisher’s note Springer Nature remains neutral with regard to jurisdictional claims in published maps and
institutional affiliations.
Open Access This article is licensed under a Creative Commons Attribution 4.0 International
License, which permits use, sharing, adaptation, distribution and reproduction in any medium or
format, as long as you give appropriate credit to the original author(s) and the source, provide a link to the
Creative Commons licence, and indicate if changes were made. The images or other third party material in this
article are included in the article’s Creative Commons licence, unless indicated otherwise in a credit line to the
material. If material is not included in the article’s Creative Commons licence and your intended use is not
permitted by statutory regulation or exceeds the permitted use, you will need to obtain permission directly from
the copyright holder. To view a copy of this licence, visit http://creativecommons.org/licenses/by/4.0/.
© The Author(s) 2021
Scientific Reports | (2021) 11:6526 | https://doi.org/10.1038/s41598-021-85974-0 10
Vol:.(1234567890)You can also read