Asiatic Cheetah's (Acinonyx jubatus venaticus Griffith, 1821) (Felidae: Carnivora) habitat suitability modeling in Iran - Journal of Wildlife and ...
←
→
Page content transcription
If your browser does not render page correctly, please read the page content below
Volume 5 (1): 15-31 (2021) (http://www.wildlife-biodiversity.com/)                                                  Research Article

Asiatic Cheetah's (Acinonyx jubatus venaticus Griffith, 1821)
(Felidae: Carnivora) habitat suitability modeling in Iran

Bahman Shams-Esfandabad1, Bagher Nezami2,3*, Negar Najafi Siavashan4, Zeinab
Asadi5, Javad Ramezani3,6
1
  Assistant Professor, Department of Environment, Arak Branch, Islamic Azad University, Arak,
Iran
2
  Associate Professor, Department of Natural Environment and Biodiversity, College of
Environment, Karaj, Iran
3
  Research Group of Biodiversity and Biosafety, Research Center for Environment and Sustainable
Development (RCESD), Department of Environment, Tehran, Iran
4
  M.A. of Land Use Planning, Environmental Science Department, Gorgan University of
Agricultural Sciences and Natural resources, Gorgan, Iran
5
  Department of Environment and Energy, Science and Research Branch, Islamic Azad University,
Tehran, Iran
6
  Assistant Professor, Department of Marine & Freshwater Sciences, College of Environment, Karaj,
Iran
*Email: nezamibagher@gmail.com

Received: 4 June 2020 / Revised: 24 July 2020 / Accepted: 2 August 2020 / Published online: 02 August 2020. Ministry of Sciences,
Research, and Technology, Arak University, Iran.
How to cite: Shams-Esfandabad, B., Nezami, B., Najafi Siavashan, N., Asadi, Z. & Ramezani, J. (2021). Asiatic Cheetah's (Acinonyx jubatus
venaticus Griffith, 1821) (Felidae: Carnivora) habitat suitability modeling in Iran, 5(1), 15-31. https://doi.org/ 10.22120/jwb.2020.128638.1151

Abstract
Critically endangered Asiatic Cheetah faces a dramatic decrease in its abundance and distribution
in recent decades, entailing the necessity for more severe conservation activities for the species in
its last remaining habitats in Iran. Proper management of the target species is highly dependent on
knowledge about its distribution and habitat requirements. The Maximum Entropy modeling
approach was applied to achieve the species habitat suitability models using data collected from
2001 to 2018. We found that the most contiguous patch predicted as a suitable one has been reported
from the country's central parts, which constitute around one-third of the country's predicted suitable
habitats. However, only 36.3% of these habitats were shown to be located inside the borders of the
country's protected area network. Naybandan Wildlife Refuge and Touran Biosphere Reserve
incorporate 9661.7 (12.6%) and 8291 (10.8%) km2 of suitable habitats, respectively where can be
16| Journal of Wildlife and Biodiversity 5 (1): 15-31 (2021)

regarded as the most critical areas in the species conservation programs. Least Cost Path analysis
suggested two corridors with 262.5 and 192.5 km length connecting northern and southern suitable
patches. Designing new protected areas or local community conserved areas and extending current
borders of the protected areas are necessary to connect northern and southern habitats and increase
the species viability.

Keywords: Distribution, habitat suitability, Least-Cost path analysis, Maximum Entropy

Introduction
Nowadays, the critically endangered Asiatic cheetah Acinonyx jubatus venaticus (Durant et al.,
2015), only exists in the fragmented habitats with small numbers in the arid environment central
plateau of Iran (Nowell & Jackson, 1996; Ahmadi et al., 2017). Historical distribution of Asiatic
Cheetah consists of India, Afghanistan, Turkmenistan, and Iran to the Arabian Peninsula and Syria
(Ellerman & Morrison-Scott, 1966; Nowell & Jackson, 1996; Karami, 1992). During the last 50
years, eastern Iran is the last refuge for a few Asiatic Cheetah survivors (Moqanaki & Cushman,
2017). Over the previous two decades, the highest number of Cheetahs were killed by sheepdogs,
free-ranging dogs, vehicle collisions, and poached by local livestock owners (Farhadinia et al., 2017;
Nezami, 2018b). Asiatic cheetah needs a vast home range while being a secretive species with low
population density makes monitoring and population estimation very challenging (Ahmadi et al.,
2017; Durant et al., 2017). Moreover, most cheetah's distributional range extends out of protected
areas where it comes up with new threats. The target species' frequency is estimated to be lower
than 40 (Nezami, 2018a), with at least one-third of which might be an effective population (Saraie,
2008). Although the Asiatic Cheetah's population has been nearly constant in Iran during the last
decades (Hunter et al., 2007), it has remarkably reduced in recent years (Farhadinia et al., 2017).
More than double-fold increase in the human population over the last forty years (Farhadinia et al.,
2017; Moqanaki & Cushman, 2017; Mohammadi et al., 2018), habitat destruction and
fragmentation, especially by development and mining (Farhadinia et al., 2017), a decline in
population size of preferred preys (Rezaei et al., 2016; Zahedian & Nezami, 2019) and lack of
connection among subpopulations (Ahmadi et al., 2017; Moqanaki & Cushman, 2017), are currently
the most important causes of threat for the Asiatic Cheetah (Farhadinia et al., 2017; Nezami, 2018a).
Asiatic cheetah has special habitat requirements, and its range has been affected by both
environmental and anthropogenic variables (Ahmadi et al., 2017; Cheraghi et al., 2017).
According to the biology and movement of particular species, wildlife management may involve
widely varying spatial scales (Bailey, 1984). Recognition of the influencing factors in the species
habitat use plays an essential role in modeling the species distribution. Relying on such known
variables, it will be possible to distinguish among the habitats in terms of suitability planning more
sophisticated management activities (Franklin, 2009). The knowledge of habitat characteristics,
which is necessary for the conservation of a target species, gives essential information to managers
who deal with alternatives such as reintroduction, translocation, and designing new protected areas
(Araujo & Williams, 2000; Rotenberry et al., 2006; Stamps & Swaisgood, 2007). Habitat suitability
modeling approaches are among those of standard methods to achieve this knowledge. Habitat
suitability modeling approaches use spatial data to predict the likelihood of an occurrence based on
areas of suitable habitat for a species within a specific geographic area (Guisan & Zimmerman,
2000). The output of these models, the habitat suitability maps, has several applications in
17| Journal of Wildlife and Biodiversity 5 (1): 15-31 (2021)

conservation programs like conservation prioritizing, delineation of the protected area's borders, the
creation of habitat corridors, and the evaluation of invasive species distribution. The results of these
models can help the researchers predict the distribution of species by identifying the contribution of
environmental variables to the species habitat suitability.
In this research Asiatic Cheetah's habitat suitability map was provided for the whole country using
the Maximum Entropy (MaxEnt) approach. This research aimed to: Predict the species distribution
range, identify the most influential environmental variables on the 'species' habitat suitability, and
prepare potential habitats map for the whole country, map the habitat corridors potential location,
evaluate the efficiency of the protected areas to satisfy the species habitat requirements.

Material and methods
Study area
This study has been covered all over the Iranian plateau, located in south-western Asia and
surrounded by Alborz and Zagros mountainous ridges from the north and west to the southwest,
respectively. Climate is mostly arid and semi-arid. The central part that is limited by the mountains
ridges and international borders of Afghanistan and Sistan-Baluchistan is referred to as Iran's central
plateau, where Asiatic Cheetah occurs at low density. There are some protected areas in the central
plateau to conserve the last remaining habitats established by the Iran Department of Environment
(DoE). The borders of the conserved area's borders covered approximately the 'species' habitat
requirement, but there are no habitat corridors among the patches.
The primary habitat of the Cheetah in Iran, Dasht Kavir and Central Iranian Plateau, with an area of
almost 5,840,423 hectares, is roughly one-third of all the regions under the DoE's management
where includes parts of Kerman, Yazd, North Khorasan, South Khorasan, Khorasan Razavi, Esfehan
and Semnan provinces. Currently, this vast area of plains and steppe has become the 'Cheetahs' last
stronghold. The main cheetah habitats in Iran can be divided into three northern, southern parts, and
Kavir National Park. The north part constituted from Touran Biosphere Reserve and Miandasht
Wildlife Refuge, and the south part from Nayebandan W.R., Dare Anjir W.R., Kalmand-Bahadoran
Protected Area, Bafgh P.A., Darband-e-Ravar W.R., and Siahkooh N.P. (Moqanaki & Cushman,
2017; Durant et al., 2017) (Table 1). A general overview of inhabitants within high-priority Cheetah
habitats (including habitats in where Cheetahs have been reported over the past few years and known
to breed there, shows that there are around 3,000 villages in these habitats with more than 550,000
inhabitants (Nezami, 2018a).

Data acquisition and analysis
For sampling and predicting the spatial distribution of the species, these steps have been followed
(Franklin, 2009): at first, we collected species presence data by field surveys and game guards'
observations. The conceptual model for determining living and non-living factors that control the
species' distribution at different temporal and spatial scales was Designed. In the final step,
environmental variables' maps that represent factors that determine habitat suitability or correlate
with it, using a method of relating the presence data with environmental variables, were prepared.
18| Journal of Wildlife and Biodiversity 5 (1): 15-31 (2021)

                                  Table 1. Cheetah present points in the habitats
                                                  Present points        After removing
             The Area                                                                    With 1 km buffer
                                                     number               reputation
 Darban-e-Ravar Wildlife Refuge                         9                      6                5
 Touran Biosphere Reserve                              231                    106               92
 Nayebandan W. R.                                      325                    160              119
 Miyandasht W. R.                                      22                      9                8
 Kavir National Park                                   42                      16               14
 Kalmand Protected Area                                40                      20               20
 Siyahkook N. P.                                       29                      14               11
 Dare Anjir W. R.                                      200                     33               32
 Bafgh P. A.                                           211                     70               56
 Sum                                                  1109                    434              357

Preparing the habitat suitability map
Collecting data about Asiatic 'Cheetah's presence in Iran: From 2001 to 2018 Conservation of
Asiatic Cheetah Project has been registered 1109 points of cheetah's presence worldwide by
installing camera trap and direct observation by game guards. Defining a management plan to
protect the species with such a critical situation requires the use of reliable, accurate, and correct
information about the presence of the species and the appropriate analysis method (Rabinowitz &
Zeller, 2010). For reducing the Spatial correlation, only one point was chosen between collections
of points in a pixel with a one-kilometer dimension. The reason for choosing this size of the pixels
was the resolution of maps using in habitat suitability modeling; otherwise, cheetah's presence was
analyzed more than once for one point with the same habitat conditions, and this caused pseudo-
replication. Thus, the final number of Cheetah presence points used in MaxEnt modeling was
reduced to 357 points (Fig. 3; Table 1).
Selecting environmental and bioclimatic variables: Based on previous knowledge on the species
behavior, nine topographic and human-induced variables that impact the species distribution were
selected. According to the broad scale of this research (throughout the country), knowing the role
of climatic variables in the selection of habitat by cheetahs is very important. For this reason, 19
bioclimatic variables were used. Maps were produced from monthly temperature and precipitation
data that are usually used in modeling ecological niches. These variables indicate annual changes,
seasonality, and limiting or severe environmental factors (Table 2). These data have interpolated to
1 km² spatial resolution for different points on the planet. In this research, the necessary bio-climatic
maps were acquired from the WorldClim database (Karger et al., 2017).
Variables correlation evaluation: To prevent disturbance in habitat suitability model results, the
correlation of the habitat variables was measured, and variables with a correlation over 0.7 were
distinguished. From each pair of variables with a high correlation, only one variable should be
selected. In this ecological research, the justification was the criterion for choosing the best variable,
which was ecologically more effective on the distribution of Asiatic Cheetah (Table 2).
Developing a habitat suitability model using the MaxEnt approach: For this analysis, MaxEnt
software (ver. 3.3) (Phillipes et al., 2006) was used. The advantages of using the Maximum Entropy
modeling approach are that the software is the only method, which reduces the time and budget
needed to gather the absence data. It is crucial, especially for cryptic, elusive, and shy predatory
species such as cheetahs, which are not easy to observe. Therefore, only using presence data will be
more reliable (Hirzel et al., 2002). For determining the function of each variable, the analysis of
variable contributions and response curves was used.
19| Journal of Wildlife and Biodiversity 5 (1): 15-31 (2021) Determining the importance of variables: In each repetition of the making model algorithm, the amount of increase or decrease in the degree of proximity to the model's predictions to the presence points used in it is measured by inputting each variable. Using this method, the increase in the efficiency of the model is determined for each variable (Phillipes, 2012). Jackknife's test is another approach for evaluating the importance of variables (Yost et al., 2008). One variable is pretermitted from the modeling in this approach, and the model is executed every time. Therefore, the degree of proximity to the model's prediction to presence points was used in making it is calculated. By creating a response, curves can show the selected variables' effects on choosing habitat probability (Baldwin, 2009). Habitat suitability map classification: Habitat suitability map presents a continuous spectrum of suitability for the habitat, while a little difference in predicted suitability doesn't necessarily mean habitat difference. Thus, by using the suitability threshold, these maps would be classified into suitable and unsuitable classes. This map is more applicable in management actions, such as determining suitable areas for protecting species (Shams-Esfandabad et al., 2010). MaxEnt software provides different suitability thresholds among them. The threshold that maximizes sensitivity plus specificity for test data is highly recommended. Validation of the model: The prepared model by the MaxEnt method can be evaluated by calculating the area under the curve (AUC) for the ROC graphs. The Area Under the Curve is equal to the probability of a randomly chosen presence point is considered more suitable by the model than a randomly chosen background point (Pierce and Ferrier, 2000). This number is typically between 0.5 – 1. Those values close to 0.5 indicate that the performance of the model is not better than the random state, and number 1 shows a complete performance. AUC is used to evaluate the model's performance and is equal to a probability that a randomly chosen presence point obtains a higher degree of suitability than a randomly chosen background point, other parts of an area where the presence of species is not registered. These random background points are used as Pseudo-absence in all analyses in MaxEnt (Phillipes & Dudik, 2008). Cross-validation was used to replicate run types that use all data in making the model and its test. In this method, presence data randomly divided into some categories with the same sample size showing it with K. Then, the modeling repeats K times, and in each time, one category left out for testing the sample and K-1 extant category use for training the model. By repeating can calculate the average and standard deviation for the results of the model. Less standard deviation indicates the power of prediction and more stability of the model. This research data divided into four categories. Analysis of the habitat suitability based on landscape ecology: According to the implications of landscape ecology, landscape configuration affects ecological processes that flow inside and between patches (Turner et al., 2001). In this research, suitable areas are considered habitat patches for Asiatic Cheetah and common indicators in landscape ecology studies. These include the patches size, SD's of patches, and patches' distribution. Least cost path (LCP) analysis: For LCP analysis, the first cost layer should be provided. Thus the inverse of the habitat suitability map is considered as the cost map. In other words, the cost of moving from the pixel reduces by increasing its suitability for species. Using the least-cost path analysis in ArcMap (ver. 10.2) software, a one-pixel width corridor (one kilometer in this research) was designed between source and sink.
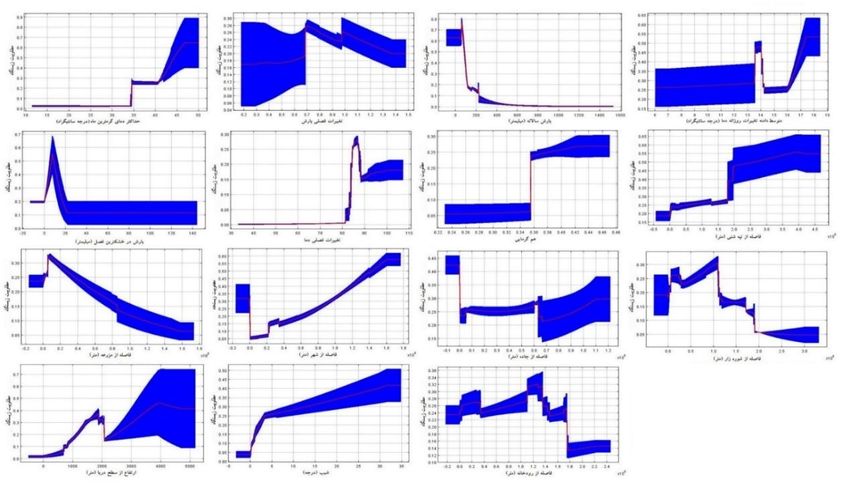
20| Journal of Wildlife and Biodiversity 5 (1): 15-31 (2021)

Results
Model validation: The average value of the area under the curve for test data excluded from the four
replicates' training data was 0.976, and the standard deviation was 0.007. The high value of the area
under the curve shows a high capacity of the Cheetah habitat suitability model to separate the
presence from background data, even in data not used in training the model. Moreover, the area
under the curve for ROC was measured 0.984 with a standard deviation of 0.0004.
Variables' response: Evaluation of the final model's response curves for cheetahs (Fig. 1) shows that
the habitat suitability increases by increasing the total annual precipitation to nearly 100 mm. In
contrast, the cheetah's habitat suability decreases. By increasing seasonal changes in rainfall, the
cheetah's habitat's suitability slowly raised to 70%, and after that, it experienced sharp rises. By
increasing precipitation in the driest season to 10 mm, cheetah's habitat suitability increased and
decreased. Changing rainfall from 20 mm to higher values does not affect the cheetah's habitat
suitability. By increasing the isothermally, the distance from cities, and the average range of daily
changes in temperature and getting away from the dunes, the Cheetah habitat suitability increased.
With the rise of seasonal temperature variations, habitat suitability will be increased. The warmest
month's maximum temperature also had a positive effect on the species habitat suitability. The areas
with a maximum temperature of about 35 and more than this in the warmest month of the year
showed more suitability. Increasing the height to nearly 1900 meters leads to an increase in the
cheetah's habitat suitability. Also, from 400 to 3400 altitudes, the habitat suitability increased. The
most suitable habitat for Asiatic Cheetah was located at least 5 km away from farmlands, while
more distance caused lower suitability, which can be related to soil fertility. The species habitat
suitability increased and then decreased by increasing the distance from the rivers up to 14 km.
Cheetah's habitat suitability slowly increased by increasing distance from roads, especially to a
range of 60 km. Areas of 100 km away from the salt pans were the most suitable habitats for
Cheetahs. The more distance from the dunes caused more habitat suitability. With increasing the
slope, the habitat suitability increased for the species.
The evaluation of contributing variables indicated that the most crucial variable was a seasonal
temperature change. Then three variables, which were the distance from human settlements, annual
precipitation, and slope, had the most contribution to the model performance. The least essential
variable is precipitation in the driest season (Table 2).
According to the Jackknife test's average results with four replications, the variable with the most
significant function in predicting the model is the variable of seasonal change of temperature and
thus has the most useful information. Furthermore, the variable that its deletion reduces the model's
prediction to the most degree was the seasonal change of temperature; therefore, it has unique
information.
Variables contribution examination based on Jackknife tests indicated that the variables of seasonal
change of temperature, distance from human settlements, annual precipitation, slope, and distance
from traffic roads were the most critical variables in predicting species habitat suitability.
21| Journal of Wildlife and Biodiversity 5 (1): 15-31 (2021)
Figure 1. The average of response curves ± Standard Division for the environmental variables after four
replications
Table 2. Environmental variables which used in cheetah's habitat preferences modeling after the
correlation analyses the analysis of variable contributions in four replications
Environmental Variable Percent contribution Variable response*
Annual mean temperature 27.7 +
Distance from Cities 16.3 +
Annual precipitation 14.9 -
Slope 10.2 +
Maximum temperature of the warmest month 7,3 +
Daily mean temperature (maximum monthly mean temperature – minimum
5 +
temperature)
Elevation 4.8 +
Distance from farmlands 3.7 +/-
Distance from rivers 2.5 +/-
Isothermality 2 +
Distance from roads 1.6 +
Precipitation seasonality 1.2 +
Distance from sandy hills 1.2 +
Distance from salty areas 1 +/-
Precipitation of driest season 0.6 +/-
* The habitat suitability trend with increasing of the variable
Habitat suitability: With an average of four replications MaxEnt model, used to provide a logistic
habitat suitability map. The threshold of habitat suitability, which was used to categorize the
cheetah's habitat suitability map to two suitable and unsuitable classes, was 13.02%. This suitability
threshold has been chosen so that the sample has the highest accuracy in the correct classification
of the presence points and the background points. According to the MaxEnt model, those areas
where the expected habitat suitability was more than this value were considered suitable, while the
other regions were deemed unsuitable. By mapping the cheetah's presence points on the habitat
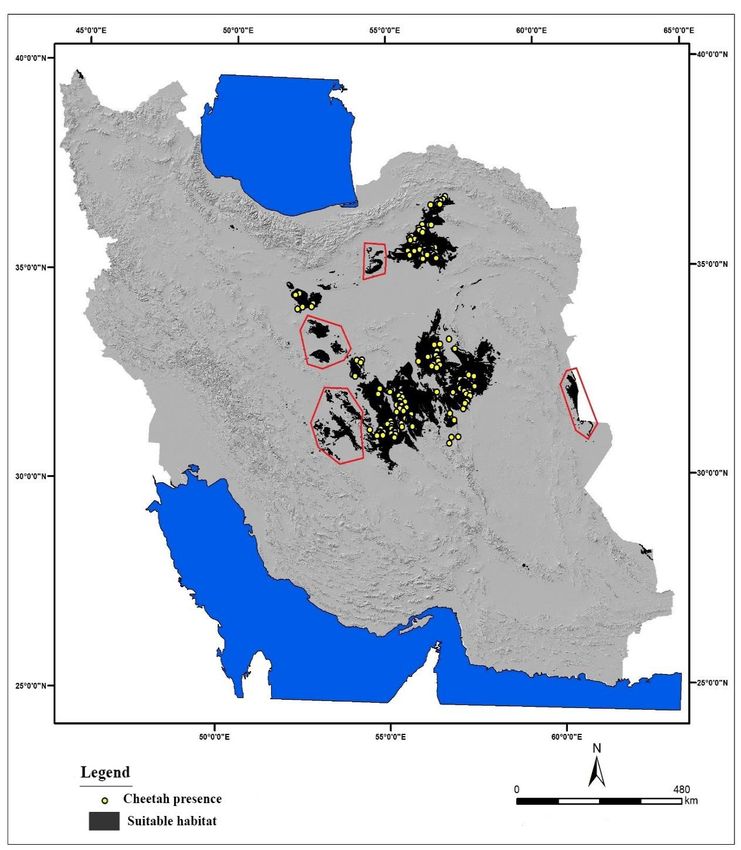
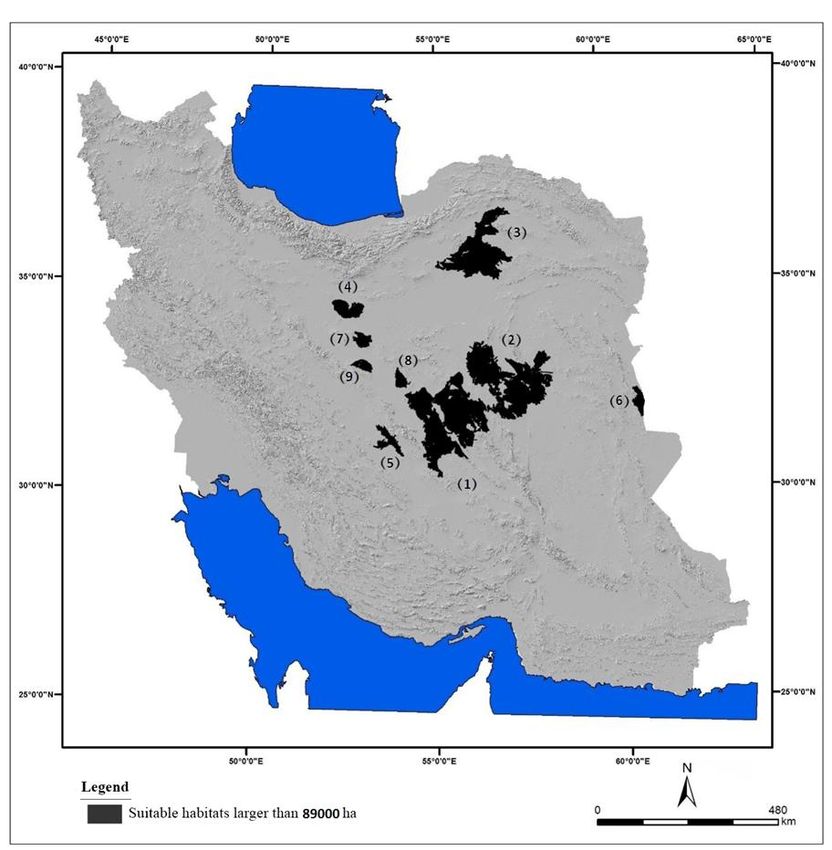
suitability classification map, four areas were identified. Despite the suitability for cheetah, there22| Journal of Wildlife and Biodiversity 5 (1): 15-31 (2021) has been no record for the target species in those areas so far (Fig. 2), which requires more evaluation to ensure the Asiatic Cheetah's presence in these regions. Figure 2. The suitability map distribution for the cheetah with the extent more than 89000 ha in Iran Patches classification in terms of landscape characteristics: Evaluating patches in terms of landscape characteristics (Table 3) shows a high distribution of suitable habitats for Cheetahs, with a total area of 76681 km². By evaluating patches' area, nine-patches with a location close to 900 km² (90,000 hectares) or more extensive than that were found for cheetahs in the country. Characteristics of these patches from a landscape viewpoint are presented in Table 4. In four patches listed in Table 4 in gray, with a total area of 7.4% of all cheetah's suitable habitats, this species' presence has not been recorded so far, which could be more field observations (Fig. 3).
23| Journal of Wildlife and Biodiversity 5 (1): 15-31 (2021)

   Figure 3. Overlaying suitable habitats and present points of cheetah (the red lines show the suitable
                  habitats which were not reported any observation of the species yet)

The efficiency of protected areas in conserving cheetah (or protecting cheetah's habitat): Overlaying
DoE protected areas map in the country on a classified map of habitat suitability shows that 27846
km² (36.3 percent) of the suitable habitats for cheetahs are within the DoE protected areas regions
boundaries and 48835 km² (63.7 percent) are outside of protected areas. National parks with the
highest protection level in the country and with the most protective actions cover nearly 6% of the
total suitable habitats for Asiatic Cheetah, which Kavir national park covers more than half of these
areas (Table 5).
24| Journal of Wildlife and Biodiversity 5 (1): 15-31 (2021)
Nearly 19% of the cheetah habitats are located within the Wildlife Refuges, which Naybandan W.R.
has about 12.6% of these areas (Table 6). Protected areas have close to 12% of the suitable habitats,
and Touran national park covers 99.6%. They were considering that Touran national park has 1.3%
of the suitable habitats and Touran wildlife refuge covers 2.5% of suitable habitats, so that 10.79%
of the suitable habitats for cheetah are in the Touran national park (Table 7). It can be concluded
that the Naybandan W.R. and Touran areas with 12.6% and 10.79% are the most suitable habitats.
From habitats that are not within protected areas of the DoE, 5.42% are in the No-hunting area
regions that have the lowest level of protection. Among them, Ariz No-hunting area in Yazd
province is the most suitable No-hunting area (Table 8). 58.48% of cheetah's habitats do not have
any protection by DoE at present.
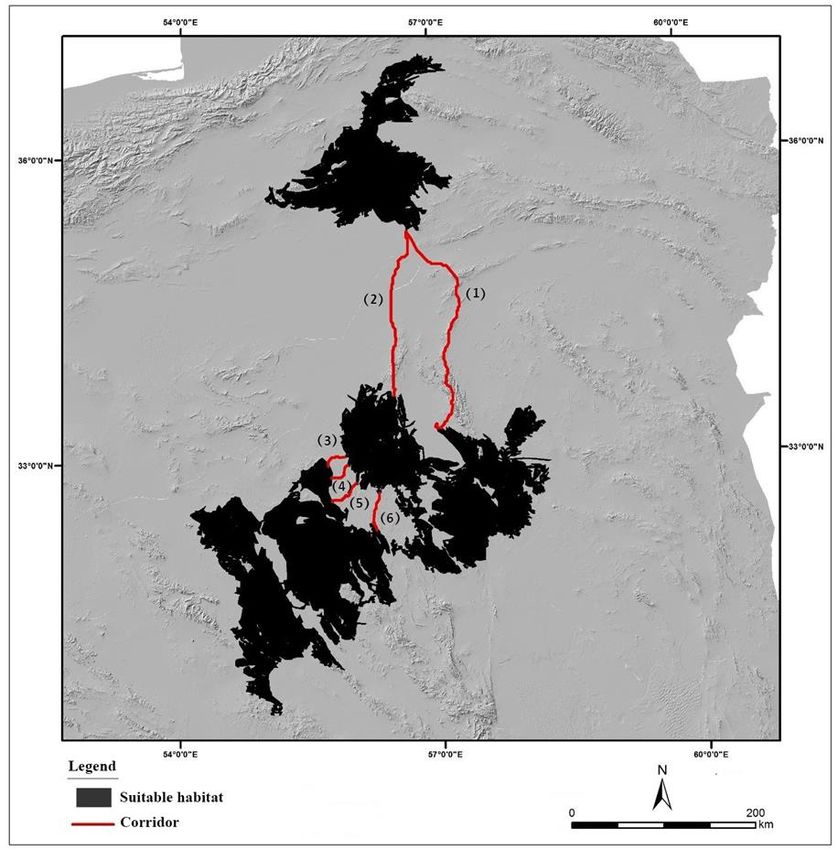
Least cost analysis: Using the least cost analysis approach, the best corridor for linking patch 3 to
patch 1 and 2 were determined. For this purpose, the cost layer was calculated by reversing the
cheetah's habitat suitability map. The northernmost habitat patch (patch number 3), was regarded as
the source layer, and two close patches of 1 and 2, which form the southern habitats, were introduced
as a sink in the analysis, then the routes with the lowest cost were calculated (Fig. 4). These paths
provide habitat corridors for the north-south movements and also make a connection between two
adjacent patches. Paths no. 1 and 2, which connect the northern and southern habitats, are critical,
and lower path length makes its physical protection easier (Table 9).
Table 3. Description of the suitable habitat patches for Asiatic cheetah in the country scale
The standard
The Average of the Sum of the
Suitability of The lowest The widest deviation of
abundance of patches extent extent of the
the patches extent (km2) extent (km2) the patches
the patches (km2) patches (km2)
extent
Suitable 1434 1 24583 53.47 923.31 76681
Table 4. Most extensive suitable patches for the cheetah habitats, according to the ratio of the perimeter to
the area
The ratio of the Ranking
Patches Area of the patches Percent of the The perimeter of
perimeter to the according to the
number (km2) suitable habitats the patches (km)
area (P/A) P/A
1 24583 32 4403 0.179 2
2 20571 26.8 5621 0.273 4
3 13544 17.7 2551 0.188 3
4 2536 3.3 404 0.159 1
5 1618 2.1 758 0.468 9
6 1191 1.6 448 0.376 8
7 1157 1.5 433 0.374 7
8 989 1.3 287 0.290 5
9 894 1.2 288 0.322 6
Sum 67083 87.5 - - -
Table 5. The distribution of the suitable habitats in the National Parks of Iran
National Park Extent of the suitable habitat (km2) Percentage of the suitable habitats
Kavir N. P. 2656 3.5
Touran N. P. 1010.9 1.3
Siyahkooh N. P. 668.9 0.9
Sum 4335 5.725| Journal of Wildlife and Biodiversity 5 (1): 15-31 (2021)
Table 6. Distribution of the suitable habitats in the Wildlife Refuges of Iran
Wildlife Refuges Extent of the suitable habitat (km2) Percentage of the suitable habitats
Nayebandan W. R. 9661.7 12.60
Touran W. R. 1918.7 2.50
Dareh Anjir W. R. 1558.1 2.03
Darband W. R. 729.4 0.95
Miyandasht W. R. 600.5 0.78
Hamoon W. R. 33.4 0.04
Sum 14501.8 18.9
Table 7. Distribution of the suitable habitats in the Protected Areas of Iran
Wildlife Refuges The extent of the suitable habitat (km2) Percentage of the suitable
Touran P.A. 5361.4 habitats
6.99
Kalmand-Bahadoran P.A. 1705.9 2.22
Bafgh P.A. 821.7 1.07
Siyahkooh P. A. 407.6 0.53
Dahaj P. A. 219.8 0.29
Parvand P. A. 159.2 0.21
Kavir P. A. 154.2 0.20
Kahyaz P. A. 145.1 0.19
Eftekhari P. A. 21 0.03
Chah kooche P. A. 9.7 0.01
Khaje forest P. A. 1.1 0.001
Kooh Asyab Kooh Banan P. A. 1.1 0.001
Mozafari P. A. 0.55 0.0007
Karkas P. A. 0.06 0.00008
Sum 9008.41 11.74
Table 8. Distribution of the suitable habitats in the No-Hunting Areas of Iran
No-Hunting Areas Extent of the suitable habitat (km2) Percentage of the suitable habitats
Ariz 1310.13 1.71
Kharoo 638.05 0.83
Transboundary areas with long 7 km 633.67 0.83
Taghestane Abarkooh 535.38 0.70
Nodarhang Rafsanjan 280.93 0.37
Marvar Meybod 184.95 0.24
Kooh bozorgi Anarak 180.24 0.24
Dare bagh 105.65 0.14
Shirk ooh Taft 97.16 0.13
Aghgol Makoo 77.92 0.10
Dorooh 59.72 0.08
Shahr Babak 28.25 0.04
Basiran 4.21 0.005
Rivand 0.55 0.0007
Sum 4136.81 5.42
Table 9. Length of the selected corridors for cheetah based on the Least Cost Analyses
Corridor Number Long of the corridors
1 262.5
2 192.5
3 26.2
4 27
5 43.5
6 44.226| Journal of Wildlife and Biodiversity 5 (1): 15-31 (2021)
Figure 4. The selected corridors for cheetah based on the Least Cost Analyses (the length of the habitat
corridors are in table 9)
Discussion
Asiatic cheetah has disappeared from its historical boundaries in the southwest of Asia (Ahmadi et
al., 2017). Now it is clear that this species can be seen only in the Iranian Plateau (Nezami, 2018a).
At present, our data regarding the species dispersal and habitat requirements is minimal (Farhadinia
et al., 2008; Rabinowitz & Zeller, 2010). Recognizing the environmental factors that affect the
cheetah distribution has tremendous importance because the species has a tiny population with low
density; on the other hand, it lives in the harsh and fragile environments of the desert area.
Recognition of the environmental factors that affect the distribution of cheetahs also has very
important in defining corridors and new conserved regions. Whereas traditionally, only the presence
of prey has been the criterion for managers' decision for determining conserved areas.
Asiatic Cheetah's habitats selection: Based on the results, the most crucial influencing variable in
cheetah's habitat selection was seasonal changes of temperature as by increasing the ambient
temperature, the habitat suitability enhanced. According to the results, cheetah's habitat selection27| Journal of Wildlife and Biodiversity 5 (1): 15-31 (2021) from the climatic aspect indicates species adaptation to areas with high temperatures, low annual precipitation, and significant seasonal changes (Ahmadi et al., 2017). Rainfall over 100 mm reduces the habitat suitability. Except for the temperature, three other variables, distance from the cities, annual precipitation and slope, account for over 60% of the model's prediction capability. While habitat roughness is significant for the Asiatic Cheetah's habitat selection, against its African relatives, lives in the plains, savannas, and grassland of the African Sahara Desert, where is the home of large ungulates (Andresen et al., 2014; Rostro-García et al., 2015). Sarhangzadeh et al. (2013) found that the species habitat suitability improves by increasing slope, getting far from human settlements and roads in Dareh Anjir of Yazd Province. Avoiding human settlements is already emphasized by other researchers (Ahmadi et al., 2017; Cheraghi et al., 2017). Simultaneously, in Europe, for example, large and medium-size carnivores have been adopted in human-induced landscapes (Chapron et al., 2014). Also, in Serengeti National Park, the African Cheetah's habitat suitability increases by getting far from human resources (Pettorelli et al., 2009). Cheetahs' distribution is currently limited to Iran's central plateau, which inhabits the lowest human population. Despite the relatively high-frequency of prey, especially gazelles in many habitats, like those located in Isfahan province, Cheetahs have not preferred these regions (Ahmadi et al., 2017). By increasing the elevation and slope, the cheetah's habitat suitability increases as well, indicating the species' tendency to the mountainous and hilly habitats and regions with mostly local prey items (Sarhangzadeh et al., 2013; Zahedian & Nezami, 2019). This contrasts with the species' suitable habitat and its selected prey in Africa (Hunter et al., 2007; Farhadinia & Hemami, 2010). In Serengeti National Park, the African Cheetah's habitat suitability increases by getting away from mountainous areas (Pettorelli et al., 2009). A study in South Africa's Kruger National Park also showed that the combination of the prey, the vegetation covers of the region, and rival species' presence have a significant impact on cheetah's habitat selection (Mills et al., 2004). The cheetah's diet and its behavior of choosing the prey are exceptional and have a high adaptation to predation on prey living in the deserts and hills (Mills & Harvey, 2001; Hayward et al., 2006). The widespread distribution of Asiatic cheetahs in the mountainous and hilly areas of the central Iranian plateau may indicate a change in selecting the prey by this carnivore (Farhadinia et al., 2008). It seems that there is a sharp decrease in the number of plans ungulates, such as Jebeer and Goitered gazelle, which are the main prey of Asiatic Cheetah in Iran (Firouz, 1998; Hunter et al., 2007; Mallon, 2007; Zahedian & Nezami, 2019). The loss of the main habitats of the species and gazelles first reduced the number of Cheetahs (Nowell & Jackson, 1996; Hayward et al., 2006), and second, it has led to the loss of integrated habitats of the species and the species feed on less preferred prey in the habitats with lower suitability (Jowkar et al., 2009; Hunter et al., 2007; Durant et al., 2017). Although the species tends to dry habitats, proximity to water resources is very important for selecting its habitat. According to Sarhangzadeh et al. (2013) and Cheraghi et al. (2017), proximity to water resources increases habitat suitability. In the Serengeti National Park, the cheetah's habitat suitability increases by getting close to water resources (Pettorelli et al., 2009). Ungulates, especially in warm seasons, have a high dependence on water and water resources in the arid environment (Montenegro, 2004). Because of facilitating water supply in the hot season by game guards, most of the water resources are located on the hillsides. Therefore, mountain ungulates, wild sheep, and wild goats are more huntable by the Cheetah (Shams-Esfandabad, 2010; Nezami, 2018a). Prioritization of cheetah's habitats in the country: We found patches 1 to 3 had formed more than 76% of the suitable habitats. Considering these areas, it may be possible to extend this complex's
28| Journal of Wildlife and Biodiversity 5 (1): 15-31 (2021)

boundaries in the coming years. Our results also indicate that except for the protected areas that are
now managed and protected by the DoE, to ensure the conservation and survival of Asiatic Cheetah,
necessary critical habitat patches are identified, and corridors mainly should be the priority of
protection (Farhadinia et al., 2016). Patch number 4, located in the Kavir N.P., despite its small size
compared to the other patches found in the Semnan and Yazd province, in terms of the perimeter
ratio to the area marginal effect, is in a better condition than other patches. Thus, despite its smaller
size than the other regions, it faced the least conservation conflicts and can be regarded as one of
the ideal candidates for the species long term protection. Despite its suitability and least conflicts,
Kavir N.P. had low observation of the cheetah, and it probably will be disappeared from the species'
distribution map soon.
Least cost analysis: In suitable patches with more connections, large carnivores will be conserved
with a higher probability (Ahmadi et al., 2017). Cheetah has a high potential for dispersal among
the habitat patches (Boast, 2014).
Therefore, better conservation of corridors will contribute to more prolonged survival and will
facilitate the transfer of genes among the subpopulations. Our proposed model also predicts the
corridors of habitat patches in existing areas. Unfortunately, the corridors' function and capability
for the distribution of cheetah have been mainly influenced by low conservation and the risk of
accidents in the roads that fragmented their suitable habitat (Ahmadi et al., 2017). In all cheetah
habitats in Iran, roads cross the border or within the habitats and disturb habitat integration (Nezami,
2018a). Hence, investigating and conserving the habitat corridors, especially between the northern
and southern regions, which have not been studied over these years, can be very crucial.
Corridors 1 and 2, with a length of more than 190 km, have provided the possibility of linking the
northern and southern cheetah's subpopulations across the country. The range of these corridors
makes their protection a challenging issue. However, according to the least cost of these corridors
for animal movements, reducing the probability of threats to the species' long-term viability can be
expected.

Conclusion
Asiatic cheetah has long movements among fragmented remained habitats (Farhadinia et al., 2016).
Stabilizing new protected areas or local community conserved areas and extending current borders
of the protected regions concerning the spatial location of the proposed habitat corridors can enhance
the gene flow between these two prominent habitat patches in the country (Moqanaki & Cushman,
2017). The conservation of predicted corridors by provided solutions is essential for better
protection of the subspecies. Furthermore, in recent years, disregard of patches that are located
among the subpopulations on the corridors has led to high mortality in both prey and predator
(Mohammadi et al., 2018). Therefore, four habitat corridors between patches number 1 and 2, due
to the large areas of the patches and their proximity to each other, can ideally enhance the gene flow.

Acknowledgment
Thanks to anonymous reviewers who helped us to improve the first draft.
29| Journal of Wildlife and Biodiversity 5 (1): 15-31 (2021)

References
Ahmadi, M., Nezami, B., Jowkar, H., Hemami, M. R., Fadakar, D., Malakouti-Khah, Sh., &
         Ostrowski, S. (2017). Combining Landscape Suitability and Habitat Connectivity to
         Conserve the Last Surviving Population of Cheetah in Asia. Diversity and Distributions,
         23(6), 592–603. https://doi.org/10.1111/ddi.12560
Andresen, L., Everatt, K. T., & Somers, M. (2014). Use of site occupancy models for targeted
         monitoring       of     the    cheetah.    Journal    of    Zoology,     292,      212–220.
         https://doi.org/10.1111/jzo.12098
Araujo, M. B., & Williams, P. H. (2000). Selecting areas for species persistence using occurrence
         data. Biological Conservation, 96, 331–345. https://doi.org/10.1016/S0006-
         3207(00)00074-4
Bailey, J. A. (1984). Principles of Wildlife Management. New York: John Wiley and Sons. 373 p:
         illus, maps, diagrams. Bibliography. Includes index.
Baldwin, R. A. (2009). Use of maximum entropy modeling in wildlife research. Entropy, 11, 854-
         866. https://doi.org/10.3390/e11040854
Boast, L. (2014). Exploring the causes of and mitigation options for human-predator conflict on
         game ranches in Botswana: How is coexistence possible? South Africa, Cape Town, Ph.D.
         thesis, University of Cape Town.
Cheraghi, F., Delavar, M. R., Amiraslani, F., Alavipanah, K., Gurarie, E., & Fagan, W. F. (2017).
         Statistical analysis of Asiatic cheetah movement and its spatio-temporal drivers. Journal of
         Arid Environment, 151, 141-145.
Durant, S. M., Mitchell, N., Groom, R., Pettorelli, N., Ipavec, A., Jacobson, A. P., & Overton, K.
         Y. (2017). The global decline of cheetah Acinonyx jubatus and what it means for
         conservation.                    PNAS,                   114(3),                  528−533.
         www.pnas.org/lookup/suppl/doi:10.1073/pnas.1611122114/-/DCSupplemental.
Durant, S. M., Mitchell, N., Ipavec, A., & Groom, R. (2015). Acinonyx jubatus. The IUCN red list
         of       threatened        species      2015:      e.      T219A50649567.          http://dx.
         doi:10.2305/IUCN.UK.20154.RLTS.T 219A50649567. En.
Ellerman, J. R., & Morrison-Scott, T. C. S. (1966). Checklist of Palearctic and Indian mammals,
         758 to 1946. 2nd ed. London: British Museum (Natural History). 810 pp.
Farhadinia, M. S., Jourabchian, A., Eslami, M., Hosseiniand, F., & Nezami, B. (2008). Is Food
         Availability a Reliable Indicator of Cheetah Presence in Iran? Autumn. CAT News, 49, 14-
         18.
Farhadinia, M., & Hemami, M. R., (2010). Prey selection by the critically endangered Asiatic
         cheetah in central Iran. Journal of Natural History, 44(19-20), 1239-1249. http://doi:
         10.1080/00222931003624770
Farhadinia, M. S., Gholikhani, N., Behnoud, P., Hobeali, K., Taktehrani, A., Hosseini-Zavarei, F.,
         Eslami, M., & Hunter, L. T. B. (2016). Wandering the barren deserts of Iran: Illuminating
         high mobility of the Asiatic cheetah with sparse data. Journal of Arid Environments, 145-
         149. http://dx.doi.org/10.1016/j.jaridenv.2016.06.011
Farhadinia, M. S., Hunter, L. T. B., Jourabchian, A. R., Hosseini-Zavarei, F., Akbari, H., Ziaie, H.,
         Schaller, G. B., & Jowkar, H. (2017). The critically endangered Asiatic cheetah Acinonyx
         jubatus venaticus in Iran: a review of recent distribution, and conservation status.
         Biodiversity and Conservation, 26(5), 1027-1046. http:// doi:10.1007/s10531-017-1298-8
30| Journal of Wildlife and Biodiversity 5 (1): 15-31 (2021)
Firouz, E. (1998). A Guide to the Fauna of Iran. Tehran, Iran: Iran University Press. 491 pp.
Franklin, J. (2009). Mapping species distributions; spatial inference and prediction. Cambridge
University Press.
Guisan, A., & Zimmermann, N. E. (2000). Predictive habitat distribution models in ecology.
Ecological Modelling, 135:147-186. https://doi.org/10.1016/S0304-3800(00)00354-9
Hayward, M. W., Hofmeyr, M., O'Brien, J., & Kerley, I. H. (2006). Prey Preference of the Cheetah
(Acinonyx jubatus) (Felidae: Carnivora): Morphological Limitations or the 109 Need to
Capture Rapidly Consumable Prey before Kleptoparasites Arrive? Journal of Zoology,
270, 615-627. https://doi.org/10.1111/j.1469-7998.2006.00184.x
Hunter, L., Jowkar, H., Ziaei, H., Schaller, G., Balme, G., & Walzer, C. (2007). Conserving the
Asiatic cheetah in Iran: launching the first radio-telemetry study. Cat News, 46, 8–11.
Jowkar, H., Hunter, L., Ziaie, H., Marker, L., Breitenmoser-Wursten, C., & Durant, S. (2009).
Acinonyx jubatus ssp. venaticus. In: IUCN 2014. IUCN Red List of Threatened Species.
Version 2014.1. http://www.iucnredlist.org
Karami, M. (1992). Cheetah distribution in Khorasan Province, Iran. Cat News, 16, 4.
Karger, D. N., Conrad, O., & Bohner, J. (2017). Climatologies at high resolution for the earth land
surface area. Scientific Data, 4(170122), 1-20.
Mallon, D. P. (2007). Cheetahs in Central Asia: A Historical Summary. Cat News, 46, 4-7.
Mills, M. G. L., & Harvey, M. (2001). African Predators, Cape Town, Struik Publishers.
Mills, M. G. L., Broomhall, L. S., & Toit, J. T. (2004). Cheetah Acinonyx jubatus feeding ecology
in the Kruger National Park and a comparison across African savanna habitats: is the
cheetah only a successful hunter on open grassland plains? Wildlife Biology, 10, 177–186.
https://doi.org/10.2981/wlb.2004.024
Mohammadi, A., Almasieh, K., Clevenger, A. P., Fatemizadeh, F., Rezaei, A., Jowkar, H., &
Kaboli, M. (2018). Road expansion: A challenge to conservation of mammals, with
particular emphasis on the endangered Asiatic cheetah in Iran. Journal for Nature
Conservation, 43, 8-18. https://doi.org/10.1016/j.jnc.2018.02.011
Moqanaki, E. M., & Cushman, S. A. (2017). All roads lead to Iran: Predicting landscape
connectivity of the last stronghold for the critically endangered Asiatic cheetah. Animal
Conservation, 20, 29-41. https://doi.org/10.1111/acv.12281
Montenegro, O. L. (2004). Natural licks as keystone for wildlife and people in Amazonia. Ph.D.
Dissertation, University of Florida.
Nezami, B. (2018a). Asiatic Cheetah: Ecology and Status of Asiatic Cheetah in Iran. Tehran: Jahade
Daneshgahi Publication.
Nezami, B. (2018b). Conservation of Asiatic Cheetah Project, Progress Report phase III: 2009-
2018. Department of Environment.
Nowell, K., & Jackson, P. (1996). Wild cats: status, survey and conservation action plan. Gland
(Switzerland): IUCN/Species Survival Commission Cat Specialist Group.
Pierce, J., & Ferrier, S. (2000). Evaluating the predictive performance of habitat models developed
using logistic regression. Ecological Modelling, 133, 225-245. http://doi: 10.1016/S0304-
3800(00)00322-7
Pettorelli, N., Hilborn, A., Broekhuis, F., & Durant, S. M. (2009). Exploring habitat use by cheetahs
using ecological niche factor analysis. Journal of Zoology, 277, 141-148.
https://doi.org/10.1111/j.1469-7998.2008.00522.x31| Journal of Wildlife and Biodiversity 5 (1): 15-31 (2021)
Phillipes, S. J., Anderson, R. P., & Schapire, R. E. (2006). Maximum entropy modeling of species
geographic distributions. Ecological Modeling, 190, 231–259. http://
doi:10.1016/j.ecolmodel.2005.03.026
Phillipes, S. J., & Dudík, M. (2008). Modeling of species distributions with MaxEnt: new extensions
and a comprehensive evaluation. Echography 31, 161-175. http://doi: 10.1111/j.0906-
7590.2008.5203.x
Phillipes, S. J. (2012). A brief tutorial on MaxEnt, versions: 3.3.3. Available online. http://www.cs.
princeton.edu /~schapire/maxent/
Rabinowitz, A., & Zeller, K. A. (2010). A range-wide model of landscape connectivity and
conservation for the jaguar, Panthera onca. Biological Conservation, 143, 939–945. http://
doi: 10.1016/j.biocon.2010.01.002
Rostro-García, S., Kamler, J. F., & Hunter, L. T. (2015). To kill, stay or flee: The effects of lions
and landscape factors on habitat and kill site selection of cheetahs in South Africa. PLOS
One, 10, e0117743. http:// doi:10.1371/journal.pone.0117743
Rotenberry, J., Preston, K., & Knick, S. (2006). GIS-based niche modeling for mapping species'
habitat. Ecology, 87, 1458-1464. http://doi:10.1890/0012-
9658(2006)87[1458:GNMFMS]2.0.CO;2
Saraie, H. (2008). Basic Methods of Population Analysis. Tehran: University of Tehran Press. 4th
Edition. p. 177.
Sarhangzadeh, J., Akbari, H., Mossavi, J., & Poorchitsaz, A. (2013). Modeling of Asiatic cheetah
habitat suitability in Dareh-Anjir wildlife refuge in Yazd province. Arid Biome Scientific
and Research Journal, 3(2), 40–50.
Shams-Esfandabad, B., Karami, M., Hemami, M. R., Riazi, B., & Sadough, M. B. (2010). Habitat
associations of wild goat in central Iran, Implications for conservation. European Journal
of Wildlife Research, 56:883-894. http://doi:10.1007/s10344-010-0386-9
Stamps, J. A., & Swaisgood, R. R. (2007). Some place like home: experience, habitat selection and
conservation biology. Appl. Animal Behavior Science, 102, 392–409. http://doi:
10.1016/j.applanim.2006.05.038
Turner, M. G., Gardner, R. H., & Neill, R. V. (2001). Landscape ecology in theory and practice,
New York: Springer-Verlag, 401p.
Yost, A. C., Petersen, S. L., Gregg, M., & Miller, R. (2008). Predictive modeling and mapping sage
grouse (Centrocercus urophasianus) nesting habitat using Maximum Entropy and a long-
term dataset from Southern Oregon. Ecological Information, 3, 375–386. http://doi:
10.1016/j.ecoinf.2008.08.004
Zahedian, B., & Nezami, B. (2019). Cheetah (Acinonyx jubatus venaticus) (Felidae: Carnivora)
feeding ecology in Central Plateau of Iran and effects of prey poor management. Journal
of Wildlife and Biodiversity, 3(1), 22-30. http://doi: 10.22120/jwb.2018.94491.1033You can also read