Tree Canopy and Potential in Portland, Oregon - February 2018 - City of Portland
←
→
Page content transcription
If your browser does not render page correctly, please read the page content below
Tree Canopy and Potential in Portland,
                              Oregon
                          February 2018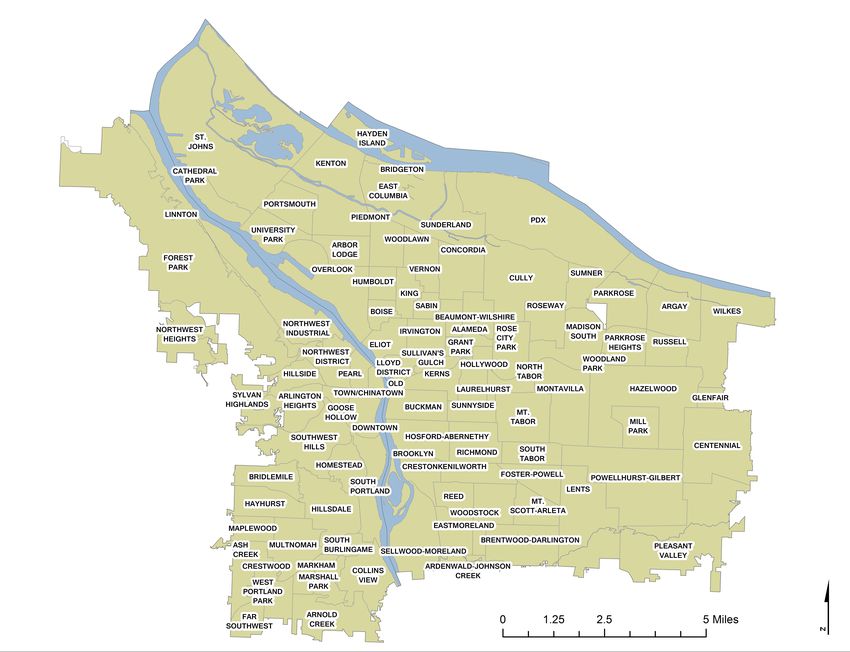
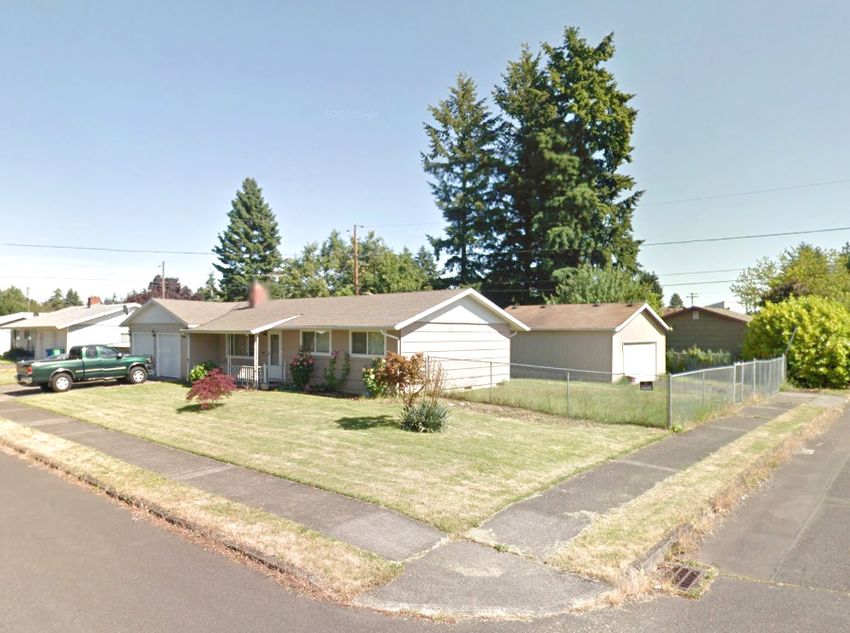
Tree Canopy and Potential in Portland, Oregon
February 2018

Prepared by Portland Parks & Recreation Urban Forestry Staff

Project Staff
Jeff Ramsey, Botanic Specialist II - Forestry
Angie DiSalvo, Outreach and Science Supervisor

Cover Photo: A single family lot in Portland’s Powellhurst-Gilbert neighborhood shows room
for tree planting

Portland Parks & Recreation
1120 SW Fifth Avenue, Suite 1302
Portland, Oregon 97204
(503) 823-PLAY                                                                  Amanda Fritz, Commissioner
www.PortlandParks.org                                                                Mike Abbaté, Director
Contents

Summary . . . . . . . . . . . . . . . . . . . . . . . . . . . . . . . . . . . . . . . . . . . . . . 1

Background . . . . . . . . . . . . . . . . . . . . . . . . . . . . . . . . . . . . . . . . . . . . 3

Data and Methods  . . . . . . . . . . . . . . . . . . . . . . . . . . . . . . . . . . . . . . 5

Findings  . . . . . . . . . . . . . . . . . . . . . . . . . . . . . . . . . . . . . . . . . . . . . . 9

Discussion . . . . . . . . . . . . . . . . . . . . . . . . . . . . . . . . . . . . . . . . . . . . 17

References . . . . . . . . . . . . . . . . . . . . . . . . . . . . . . . . . . . . . . . . . . . . 21

Appendix A: Canopy and Potential, by Neighborhood . . . . . . . . 23

Appendix B: Methods . . . . . . . . . . . . . . . . . . . . . . . . . . . . . . . . . . . 27
Summary

As part of ongoing efforts to monitor and manage Portland’s urban forest,
Portland Parks & Recreation identified and mapped the distribution of
tree planting opportunity in the city. Potential for expansion of the city’s
current tree canopy and the services it provides is extensive but uneven
across Portland’s geography, zoning, and property ownership. This analysis
of the distribution of Portland’s tree canopy and potential provides critical
baseline information for updating the 2004 Urban Forest Management Plan
and revising canopy goals according to the most current available data.

KEY FINDINGS

•   Areas of potential tree canopy make up 20,886 acres, or 23%, of the
    city, representing space for an estimated 1.3 million additional trees.

•   Potential tree canopy is not evenly distributed across zoning types.
    Residential zones contain 54% of the city’s canopy potential, industrial
    zones 25%, open space zones 14%, and commercial zones 7%.

•   Distribution of potential canopy is geographically uneven, with areas
    east of the Willamette River containing 82% of the city’s potential tree
    canopy, compared to 18% west of the river.

•   Nearly two-thirds of Portland’s canopy potential (62%) is located on
    private lands, with the remaining divided between public lands (21%)
    and rights-of-way (16%).

•   To meet the city’s goal of 33.3% canopy cover by 2035, canopy cover
    in Portland would have to expand by approximately 3,200 acres, or
    15% of total canopy potential identified in this analysis. To meet
    Urban Forest Management Plan goals for an equitable distribution of
    the services provided by the urban forest, tree planting will need to be
    focused in areas where it is currently lacking.

•   Meeting some or all of Portland’s canopy potential would yield
    substantial returns in environmental services and other benefits. If
    realized, canopy potential identified in this report represents $197
    million in annual services, totaling $3.9 billion over 20 years.

•   This study does not attempt to predict changes to Portland’s
    canopy potential due to expected population growth and associated
    development; however, over 80% of all potential canopy identified
    in this study lies outside areas projected by the City to experience
    development in the next 20 years. Further study, including detailed
    site analysis based on zoning requirements, is needed prior to further
    adjusting estimates presented in this report.

                                                                           Portland Parks & Recreation   1
2 Tree Canopy and Potential in Portland, Oregon
Background

Portland’s urban forest is integral to the environmental, economic,
and social health of the city. Trees on public and private lands benefit
residents by protecting air and water quality, improving public
health, increasing public safety, and making the city more livable for
both humans and wildlife. In recognition of the importance of the
urban forest, canopy cover is cited as an important indicator in the
Portland Urban Forest Management Plan (2004), Urban Forest Action Plan
(2007), Portland Plan (2012), Climate Action Plan (2015), and the 2035
Comprehensive Plan (2016) and the city has set a goal of expanding canopy
cover from its current 29.9% to at least 33.3% by 2035 (Bureau of
Planning and Sustainability (BPS 2012a).

Portland Parks & Recreation (PP&R) regularly monitors urban forest
canopy cover in order to assess forest health, track program progress,
and inform management of this natural resource (PP&R 2007b, 2017).
In recent years, Portland has been successful in increasing canopy cover
across the city despite population growth and urban development,
adding over 3,000 acres of canopy from 2000-2015—a time period in
which population grew by approximately 100,000 people. Building on
this short-term success will be a challenge, as Portland’s population
is expected to grow by an additional 260,000 people by 2035 (BPS
2016). Continuing to expand tree canopy in the face of this growth and
associated land development will take planning and investment, and this
report provides important baseline information for those efforts.

This analysis provides detail on the distribution of tree canopy in
Portland, identifies areas of the city that offer tree planting opportunities,
and estimates the monetary value of planting to fulfill canopy potential
across the city. Mapping canopy potential will help guide efforts to
continue Portland’s success in expanding the urban forest and aid in
developing canopy targets that meet multiple tree-related and other
goals, including equity in distribution of forest canopy and the services it
provides and mitigating and adapting to climate change.

While this report focuses on areas of opportunity for tree planting,
meeting and exceeding one-third canopy cover across the city requires
the preservation of existing trees whenever possible. Planting a tree is an
investment that takes decades to realize—akin to putting a dime in the
bank and waiting for the interest to turn it into a dollar. Portland’s “bank
account” of tree canopy cannot grow by pulling out dollars and replacing
them with dimes.

                                                                          Portland Parks & Recreation   3
4 Tree Canopy and Potential in Portland, Oregon
Data and Methods
CATEGORIZING LAND COVER
This analysis is based on existing land cover classifications, including a
map of tree canopy cover derived from the 2014 Metro Regional Land
Information System (RLIS) land cover classification (Metro 2016) as well
as other land cover datasets maintained by the City of Portland (Table
1). Using these data within a geographic information system (GIS),
land cover across the city was grouped into four categories: 1) water, 2)
existing tree canopy cover, 3) impervious surfaces, 4) pervious surfaces,
including non-tree vegetation. Impervious surfaces were further divided
into buildings, streets, sidewalks, and parking lots in order to capture
differences in their ability to support tree canopy.
Table 1 : Data and sources
Data Time Period Source
Canopy 2014 Metro RLIS
Waterbodies 2014 Metro RLIS
Zoning 2017 City of Portland, Bureau of Planning and Sustainability
Impervious surfaces (buildings, 2014 City of Portland, Bureau of Environmental Services,
streets, sidewalks, parking lots) Bureau of Transportation
PDX primary zone 2014 Port of Portland
Buildable Lands Inventory 2012 Bureau of Planning and Sustainability
Those land covers not able to support tree canopy—streets, buildings,
and waterbodies—were then removed from analysis. While exceptions
exist, these areas cannot be planted without significant expense or
redesign. Because of federal regulation of vegetation around airports,
the “primary zone” around Portland International Airport (PDX) was
also excluded from analysis, as it is exempt from some tree planting and
removal regulations and therefore does not constitute a viable planting
opportunity.
Finally, areas of existing canopy were removed from analysis as they do
not represent areas of potential. While future tree planting efforts could
take place in some of these spaces, planting would not result in a notable
net gain of tree cover over time.
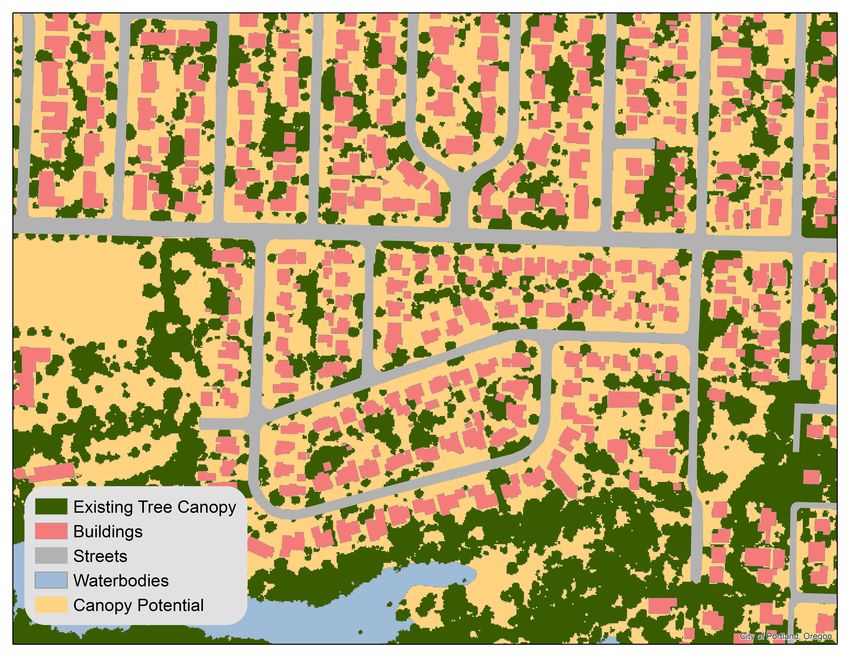
All remaining areas, including all pervious surfaces, non-tree vegetation,
sidewalks, and parking lots were preliminarily classified as areas of canopy
potential (Figure 1), able to support tree canopy and adding to the city’s
existing tree canopy cover. Note that areas of potential identified in this
Portland Parks & Recreation 5Data and Methods
analysis are areas where it is assumed that there is enough planting opportunity nearby to support 100%
tree canopy coverage —not that a tree can be planted anywhere in this space. For example, while tree
planting space is limited in sidewalks, there is enough planting opportunity both within the sidewalk and
on adjacent lands that trees planted may be able to create a continuous canopy over these areas. While
this is also true to a lesser extent with streets (canopy currently covers 10-15% of Portland’s streets), to
be conservative, streets were excluded as areas of potential with no canopy assumed to be added over
these spaces from additional tree plantings. See Table 2 for a summary of areas classified as canopy
potential.
Figure 1: Areas not covered by water, buildings, streets, or existing canopy are classified as canopy
potential prior to the application of adjustment factors.
Table 2: Land covers and canopy potential
Potential No Potential
Pervious surfaces Areas under tree canopy cover
Parking lots Buildings
Sidewalks Water
Streets
PDX Primary Zone
6 Tree Canopy and Potential in Portland, OregonData and Methods
ADJUSTMENT FACTORS
Some limitations not easily identified from aerial images preclude
planting in potential canopy areas. Gross canopy potential over pervious
areas was reduced by an adjustment factor in order to account for sports
fields, vegetable gardens, underground utilities, and other physical
limitations to planting. Developing this adjustment factor for Portland
would require a separate field study which is outside the scope of this
report. However, this work has been done in San Jose, CA (McPherson
et al. 2013), which has a similar population density to Portland and can
be used as a model for this report. That study found 64% of unirrigated,
bare soil to be free of such limitations; therefore, an adjustment factor of
0.64 was applied to pervious areas of potential canopy.
Surface parking lots are included as potential in this study because of the
opportunity for trees to mitigate the increased stormwater runoff and
urban heating associated with these areas. Portland city code requires
tree planting with the development of new parking lots. Although there
is no set canopy goal associated with these requirements, it is estimated
that current standards would lead to 35% canopy coverage of parking
lots at maturity (Bureau of Development Services 2017). Therefore, an
adjustment factor of 0.35 was applied to all areas of potential canopy over
surface parking lots.
TARGET GEOGRAPHIES
Geography, land use, and property ownership can each help to explain
the presence or absence of tree canopy in an urban environment, as
well as the limitations to the planting and preservation of trees. Using
a classified map of tree canopy makes it relatively easy to analyze the
data by a number of categories and determine the extent to which each
is related to tree canopy and potential. This study reports canopy and
potential according to geography (east or west of the Willamette River),
zoning (commercial, industrial, open space, or residential), and ownership
(public, private, right-of-way). Neighborhood data is included in
Appendix A, and zoning categories are explained in Appendix B.
SERVICES PROVIDED BY INCREASED CANOPY COVER
Urban trees provide numerous services to city residents including
improved environmental and human health, public safety, and livability.
Expanding Portland’s urban forest to meet some or all of its canopy
potential would also increase the tree-related services that residents
currently enjoy.
This study uses algorithms developed by the US Forest Service to
quantify the value of air quality improvement, stormwater reduction,
Portland Parks & Recreation 7Data and Methods and carbon sequestration that meeting some or all of Portland’s canopy potential would generate (www. itreetools.org). Additionally, aesthetic and other benefits are estimated based on local and national research on the sales prices of properties with and without trees, which is a proxy for the price that the public is willing to pay to live near trees and enjoy their harder-to-quantify services, including beautification, noise reduction, privacy, wildlife habitat, and psychological well-being. Details on each of the calculations are included in Appendix B. LIMITATIONS This large-scale study is not meant to map specific sites for tree planting in Portland; rather, it highlights the overall pattern of planting opportunity across the city and its various zones of land use and ownership. Suitability assessment for actual planting of trees requires site inspection, which is outside the scope of this analysis. The numbers presented in this report are meant to reflect canopy potential based on current land use, accounting for physical obstacles to planting through adjustment factors and the exclusion of Portland International Airport. This is an assessment of physical capacity for tree canopy, providing a baseline for what land is currently available for planting. A preliminary analysis of lands that are expected to experience some level of development in coming decades is included in this report’s findings, however further study is required to assess how development on these lands would impact overall tree canopy and potential in Portland. 8 Tree Canopy and Potential in Portland, Oregon
Findings

CITYWIDE CANOPY POTENTIAL
Given current land use and development, Portland could support an
additional 20,886 acres of tree canopy, comprising 22.5% of Portland’s
total area (92,680 acres). Combined with existing canopy, total canopy
potential is 52.4% (Figure 2). Canopy potential is unequally distributed
across geography, zoning class, and ownership.

                                  60%

                                  50%
 Percent of Portland Land Cover

                                  40%

                                  30%

                                  20%

                                  10%

                                  0%

                                        Existing Canopy   Potential Canopy

Figure 2: Existing canopy and potential total 52.4% of Portland land cover.

GEOGRAPHY

Lands east of the Willamette River in Portland contain 17,205 acres of
tree canopy potential, comprising 82.4% of the city’s overall potential
canopy cover. Portland’s west side contains 3,681 acres of tree canopy
potential, comprising 17.6% of the city’s overall potential canopy cover
(Table 3).

                                                                             Portland Parks & Recreation   9
Findings
Table 3: Existing canopy and potential, east and west of the Willamette River
Percent of Total Percent Canopy Percent of Acres of Percent of
City Area Cover (acres) Portland’s Ex- Potential Portland’s
isting Canopy Canopy Potential
Canopy
East 72.0 20.5 (13,661) 49.3 17,205 82.4
West 28.0 54.2 (14,053) 50.7 3,681 17.6
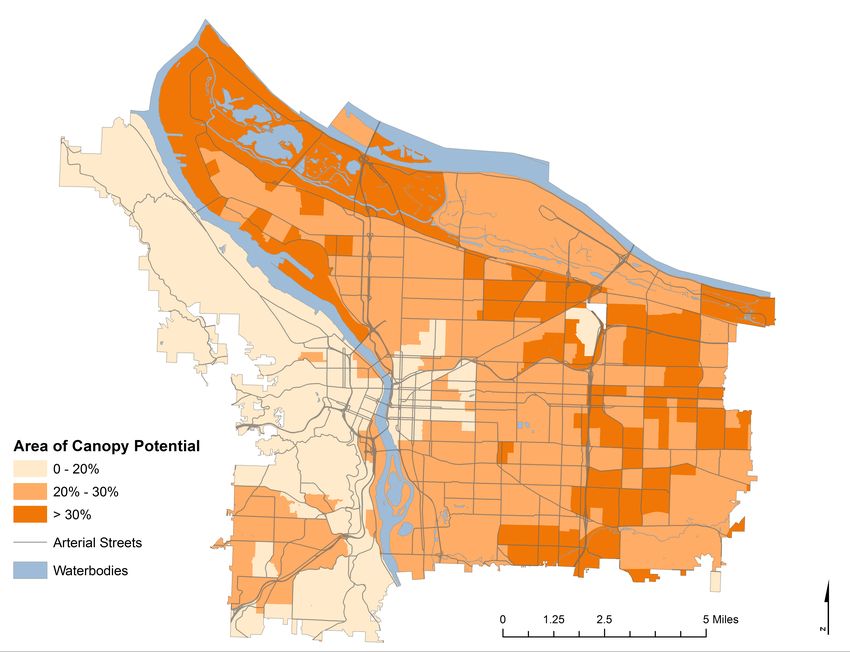
Figure 3: Canopy potential in Portland census block groups, as proportion of land area
10 Tree Canopy and Potential in Portland, OregonFindings
ZONING
Residential areas contain the majority (53.9%) of Portland’s canopy
potential. Industrial areas contain 24.8% of Portland’s canopy potential,
and open space and commercial zones contain 13.8% and 7.3% of
Portland’s canopy potential, respectively (Table 4, Figure 4). See
Appendix B for an explanation of zoning categories.
Table 4: Existing canopy and potential, by zoning class
Zoning Class Percent of Percent Canopy Percent of Acres of Po- Percent of
Total City Cover (acres) Portland tential Cano- Portland Po-
Area Canopy py tential Canopy
Commercial 7.9 13.0 (877) 3.2 1,534 7.3
Industrial 20.8 8.5 (1,516) 5.5 5,182 24.8
Open Space 18.3 63.7 (10,001) 36.1 2,888 13.8
Residential 53.1 33.5 (15,242) 55.0 11,267 53.9
Industrial
24.8%
Residential
53.9%
Commercial
7.3%
Open Space
13.8%
Figure 4: Proportion of citywide canopy potential, by zoning class
Portland Parks & Recreation 11Findings
Proportions of land area identified as potential canopy varied across zones, ranging from 18.4% of
total area in open space zones to 29.2% of industrial zones (Figure 5, Table 5). Total canopy potential,
including existing and potential canopy, ranged from 35.8% in commercial zones to 82.1% percent in
open space zones.
Existing Canopy Potential Canopy Not Suitable for Planting
Commercial
Industrial
Open Space
Residential
0 5,000 10,000 15,000 20,000 25,000 30,000 35,000 40,000 45,000 50,000
Acres
Figure 5: Existing, potential, and unsuitable canopy area, by zone
Table 5: Potential and unsuitable canopy area, by zoning class
Zoning Class Percent of Area Not Percent Potential Total Potential Canopy
Suitable for Planting Canopy Cover Cover (incl. existing
and potential)
Commercial 64.2 22.8 35.8
Industrial 62.3 29.2 37.3
Open Space 17.9 18.4 82.1
Residential 41.7 24.8 58.3
12 Tree Canopy and Potential in Portland, OregonFindings
PROPERTY OWNERSHIP
Citywide, canopy potential is predominantly located on privately-owned
lands, which contain 62.2% of canopy potential compared to public lands
and rights-of-way (ROW), which hold 21.1% and 16.1%, respectively
(Table 6, Figure 6).
Table 6: Existing canopy and potential, by property ownership
Ownership Percent of Percent Percent of Acres of Potential Percent of
Total City Canopy Cover Portland Canopy Portland
Area (acres) Canopy Potential
Canopy
Public 24.5 46.9 (9,775) 35.3 4,416 21.1
Private 56.1 29.0 (13,853) 50.0 12,987 62.2
ROW 19.4 22.2 (3,674) 13.3 3,353 16.1
ECOSYSTEM SERVICES AND OTHER
BENEFITS
This analysis identifies 20,886 acres of canopy
Public
potential in the city of Portland, representing 21.1%
space for planting nearly 1.3 million medium-
sized (30 foot diameter canopy spread) trees.
Realizing even a portion of this potential Private
would take significant investment by the 62.2%
ROW
16.1%
City and its residents—an investment that
would yield substantial returns in the form of
environmental, social, and economic benefits.
The value of ecosystem services of air quality
improvement, carbon capture, reduced
stormwater volume, as well as aesthetic and
other benefits that this increased canopy
Figure 6: Proportion of citywide canopy potential, by
represents is included in Table 7 below.
ownership
Meeting Portland’s full canopy potential would
generate an estimated $197 million in services
annually. The cumulative monetary value of these services over 20 years
total $3.9 billion (in 2018 dollars). The annual and cumulative values
of meeting the current goal of 33.3% canopy cover are $30 million and
$600 million respectively. Meeting 35%, 40%, or 50% canopy cover
would net between $44 and $176 million in annual services and other
benefits. See Appendix B for an explanation of how these figures were
calculated.
Portland Parks & Recreation 13Findings
Table 7: Annual and 20-year cumulative value of meeting potential tree canopy goals
33.3% goal 35% goal 40% goal 50% goal All potential
(52.4% canopy
cover)
Additional Trees 195,971 291,161 576,731 1,147,872 1,287,123
Annual Services Per Tree
Air Quality $109,743 $163,050 $322,969 $642,808 $720,789 $0.56
Carbon Capture $378,223 $561,941 $1,113,091 $2,215,393 $2,484,147 $1.93
Stormwater $3,441,242 $5,112,790 $10,127,400 $20,156,631 $22,601,876 $17.56
Aesthetic/Other $26,073,811 $38,738,893 $76,733,892 $152,723,972 $171,251,281 $133.05
Total $30,003,020 $44,576,674 $88,297,352 $175,738,804 $197,058,092 $153.10
20 year cumulative $600,060,400 $891,533,477 $1,765,947,047 $3,514,776,075 $3,941,161,839 $3,062
Of the total service value of potential plantings, eighty-seven percent of expected are in the aesthetic/
other category, primarily reflecting positive property value impacts which are a proxy for other, harder
to quantify benefits such as improved mental and physical health and safety that buyers have been found
to be willing to pay more to enjoy (see Appendix B for a review of this research). Of the remaining,
12 percent are from stormwater savings, 1 percent carbon capture, and less than 1 percent air quality
improvement.
ACCOUNTING FOR FUTURE DEVELOPMENT
Expectations of population growth and associated development in Portland must be considered in any
discussion of the capacity for long-term growth of the urban forest. Impacts of development on tree
canopy and potential will vary based on current landcover, zoning and associated requirements, and
the scale and intensity of development. In some cases, canopy potential will be further restricted by
future development due to increased building footprints and other impervious areas causing a net loss
of canopy and potential. However, in developable areas with very little existing tree canopy, the City’s
landscaping and tree density standards should increase tree canopy over time as these lots are developed.
The Buildable Lands Inventory (BPS 2012b) identifies vacant and underutilized lots in Portland that
are expected to be developed, given market demand. An analysis of existing and potential tree canopy
in these areas provides insight into how future development may impact citywide canopy over the long
term.
Over 80% of Portland’s tree canopy potential lies outside of lands identified in the Buildable Lands
Inventory—an encouraging sign for long-term canopy growth (Table 8). However, existing canopy
cover on these lands is relatively high, at 42.5% for currently vacant lots and 22.5% for non-vacant
“underutilized” lots. While overall these developable lands hold just one-sixth of Portland’s total tree
canopy, preserving this canopy through development could be a challenge in some areas. A closer
examination of the expected canopy and potential on these sites based on the nature of expected
14 Tree Canopy and Potential in Portland, OregonFindings
development is necessary for creating a potential canopy estimate that
takes future development into account.
Table 8: Existing canopy and potential on Buildable Lands Inventory land
Percent of Percent Percent of Acres of Percent of
Total City Canopy Cover Portland’s Potential Portland’s
Area (acres) Existing Canopy Potential
Canopy Canopy
Vacant lots 8.6 42.5 (3,369) 12.2 2,469 11.8
Non-vacant
6.1 22.5 (1,278) 4.6 1,613 7.7
“underutilized” lots
Portland Parks & Recreation 1516 Tree Canopy and Potential in Portland, Oregon
Discussion
DISTRIBUTION OF CANOPY POTENTIAL
Under current land use conditions, ample space exists to meet and
surpass Portland’s current goal of 33.3% tree canopy cover citywide.
Assuming today’s land use and development, of the 20,886 acres of
potential canopy identified in this report, approximately 15%
(3,200 acres) needs to be realized to meet this target (Figure 25,000
7).
Opportunity exists in all areas of the city, however private 20,000
residential lots hold more canopy potential than any other
area. As most Portlanders live in private, residential zones, 15,000
these are also the areas where trees can have the greatest
Acres
outcomes in terms of human health and safety, both of which 10,000
have been positively linked to canopy cover in Portland
(Donovan et al. 2011, Donovan and Prestemon 2012).
5,000
EQUITY AND PORTLAND’S URBAN FOREST
0
Additional Canopy Required Potential Tree Canopy Area
to Meet 33.3% Goal
In addition to expanding tree canopy cover, successful
urban forest management policies will also achieve greater
environmental equity. Results of this analysis point towards Figure 7: Additional canopy acres
disparities in canopy cover distribution that meeting a required to meet 33.3% canopy goal
citywide canopy goal alone will not address. Providing
equitable urban forest services for all residents will entail addressing the
fact that 80% of Portland residents live east of the Willamette River,
where canopy cover is just 20.5%—a lower rate than New York City or
Los Angeles (Grove et al. 2006, McPherson et al. 2008). Existing and
potential canopy cover vary greatly across Portland neighborhoods (see
Appendix A, and Figure 8 below), and areas of potential identified in this
analysis can guide continued efforts to expand Portland’s urban forest in
an equitable manner.
Even with more focused efforts, continued growth and development has
the potential to exacerbate current canopy disparities. According to the
2035 Comprehensive Plan, between 2015 and 2035, Portland’s population
is expected to increase at a rate twice as fast as was experienced from
2000-2015, with the majority of this development in areas east of
the Willamette River. Tree canopy east of the Willamette River is
generally less protected during development under current code, due
to exemptions from tree preservation standards for lots less than 5000
ft2—lot sizes more common on the east side. In inner neighborhoods,
including Sunnyside, Richmond, and Vernon, up to 50% of current
canopy is contained on private lots under 5,000 ft2. Additionally, there is
a lower proportion of land in environmental overlay zones (which have
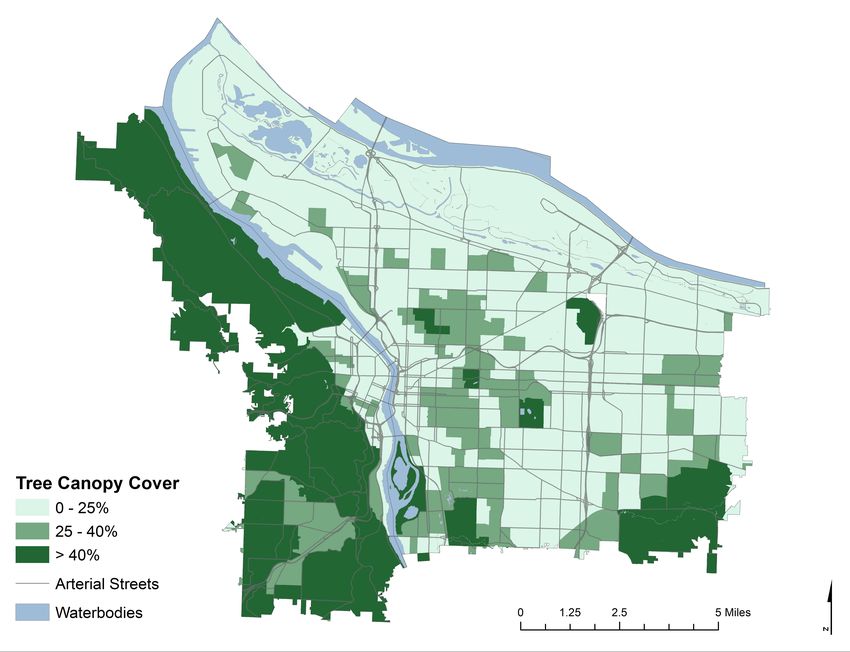
Portland Parks & Recreation 17Discussion stronger tree preservation requirements) relative to the number of lots on the east side compared to the west side. Unequal distribution of canopy cover among Portland’s neighborhoods is related to income disparities; in a recent Portland State University study, households in the top quintile of income have on average 20% more canopy than those in the bottom quintile (Voelkel 2017). Strategic focus on planting in low-income/low-canopy neighborhoods aids in reducing residents’ exposure to environmental health risks, including poor air quality and excessive urban heating. Areas of potential identified in this report can help guide decisions on how to best expand canopy in these areas to realize the most benefit for residents. Figure 8: Existing tree canopy cover in Portland census block groups, as proportion of land area REVISITING CANOPY GOALS Canopy targets are useful tools to inform policy and management of the urban forest. They provide a measurable goal that encompasses many forest services including improved human health, environmental quality, and economic growth. This report is part of ongoing efforts by PP&R to monitor urban forest canopy trends to aid in adaptive management of the urban forest to extend these services to all Portland residents. The current canopy cover target of 33.3% is an average based on goals set for urban land environments (ULEs) in the 2004 Urban Forest Management Plan. These targets have been 18 Tree Canopy and Potential in Portland, Oregon
Discussion

useful guides for planting and management efforts over the past decade,
but are now outdated as they are based on a 2002 canopy classification
and on land use categories that may include up to 20% classification
error (PP&R 2009).

Portland’s current canopy goal of 33.3% canopy cover by the year 2035
may be reasonable for that timeframe, however this report demonstrates
canopy cover could be higher in Portland over the long term. Revision
to canopy goals within the upcoming update to the Urban Forest
Management Plan should consider a longer timeframe that accounts for
development projections and urban forest needs of residents, providing
direction for long term forest management.

In isolation, a single citywide canopy goal can obscure local disparities
in canopy cover and its associated benefits. Currently, enough potential
exists in high-canopy areas of the city to meet the 33.3% target, and
studies have shown that planting is often easiest in these areas, where
residents know well the benefits that trees provide and often have the
resources to maintain them (Locke and Grove 2014, Donovan and Mills
2014). Meeting Portland’s canopy goal in this manner would be a failure
in building a forest that serves all residents. The 2015 Climate Action Plan
attempts to address this potential inequity by suggesting a 25% minimum
canopy goal for all residential neighborhoods. Raising the overall canopy
target for the city and updating minimum neighborhood goals based on
this study’s findings will ensure that urban forest canopy continues to
expand in an equitable manner.

FUTURE STUDY

Continued efforts to monitor trends in canopy and potential provide an
important guide for adaptive management of the urban forest. As new
information becomes available, PP&R will update estimates of canopy
and potential. The next canopy measurement based on the protocol
outlined in the 2017 Tree Canopy Monitoring Report will begin in 2021.
Updates to the canopy classification used in this study are expected
approximately every 5 years, with the next classification planned for 2020.

The adjustment factors used in this study are an attempt to account
for physical obstacles to tree planting in areas otherwise capable of
supporting tree canopy. A point sampling survey of obstacles within open,
pervious land cover in Portland would result in an adjustment factor
based on the city’s unique land cover.

This report includes a preliminary look at canopy and potential on lands
expected to be developed in coming decades. Further analysis is required

19    Tree Canopy and Potential in Portland, Oregon
Discussion

before estimating the impact of that development on overall tree canopy and potential in Portland, as
the nature of development will vary according to zoning type.

Neither this study nor the 2017 Tree Canopy Monitoring Report provide detail on the trees that make up
Portland’s urban forest. Understanding forest composition, including the species, size, and condition of
Portland’s trees, provides important information that can be used to increase the resiliency of the urban
forest. PP&R’s Tree Inventory Project continues to provide this information for important subsets of the
urban forest, completing an inventory of all street trees in 2016, and an inventory of park trees scheduled
for completion in 2019. A sample-based inventory of private lands, which hold the majority of Portland’s
tree canopy and potential, is scheduled for Summer 2018 in partnership with the US Forest Service.
Once baseline inventories are complete, regular updates to inventories across all property types will be
essential to future urban forest management and planning.

20    Tree Canopy and Potential in Portland, Oregon
References

Anderson, L.M. and Cordell, H.K. 1988. Influence of trees on residential
property values in Athens, Georgia (U.S.A.): a survey based on actual
sales prices. Landscape and Urban Planning 15: 153-164.

Bureau of Development Services. 2017. Tree and Landscape Manual.
http://www.portlandoregon.gov/bds/45483

Bureau of Planning and Sustainability. 2016. 2035 Comprehensive Plan.
https://www.portlandoregon.gov/bps/2035-comp-plan.pdf

Bureau of Planning and Sustainability. 2015. Climate Action Plan. http://
www.portlandoregon.gov/bps/article/531984

Bureau of Planning and Sustainability. 2012a. The Portland Plan. http://
www.portlandonline.com/portlandplan/index.cfm?c=58776

Bureau of Planning and Sustainability. 2012b. Buildable Lands Inventory.
https://www.portlandoregon.gov/bps/59296

Donovan, G.H. and Butry, D.T. 2010. Trees in the city: Valuing street
trees in Portland, Oregon. Landscape and Urban Planning 94: 77-83.

Donovan, G.H., Y.L. Michael, D.T. Butry, A.D. Sullivan, and J.M. Chase.
2011. Urban trees and the risk of poor birth outcomes. Health and Place
17(1):390-393.

Donovan, G.H. and J.P. Prestemon. 2012. The effect of trees on crime in
Portland, Oregon. Environment and Behavior 44(1):3-30.

Donovan, G.H. and Mills, J. 2014. Environmental justice and factors that
influence participation in tree planting programs in Portland, Oregon.
Arboriculture and Urban Forestry 40(2):70-77.

Grove, J.M.; J. O’Neil-Dunne.; K. Pelletier.; D. Nowak; and J. Walton.
2006. A report on New York City’s present and possible urban tree
canopy. South Burlington, VT: U.S. Department of Agriculture, Forest
Service, Northeastern Research Station. 25 p.

Guenther, A.B.; Zimmermann, P.R.; Harley, P.C.; Monson, R.K.; Fall,
R. 1993. Isoprene and monoterpene emission rate variability: model
evaluations and sensitivity analyses. Journal of Geophysical Research
96(D6):12609-12617.

International Working Group on Social Cost of Carbon (IWG). 2010.
Appendix 15a. Social cost of carbon for regulatory impact analysis under
Executive Order 12866. In Final Rule Technical Support Document (TSD):

                                                                        Portland Parks & Recreation   21
References Energy Efficiency Program for Commercial and Industrial Equipment: Small Electric Motors. U.S. Department of Energy. http://www3.epa.gov/otaq/climate/regulations/scc-tsd.pdf Locke, D.H. and J.M. Grove. 2014. Doing the hard work where it’s easiest? Examining the relationships between urban greening programs and social and ecological characteristics. Applied Spatial Analysis and Policy 1(Dec):1-20. McPherson, E.G., S.E. Marco, J.R. Simpson, P.J. Peper, Q. Xiao, A.M. VanDerZanden, and N. Bell. 2002. Western Washington and Oregon Community Tree Guide: Benefits, Costs, and Strategic Planning. International Society of Arboriculture, Pacific Northwest Chapter, Silverton, OR. 78 p. McPherson, E.G., J. R. Simpson, Q. Xiao, and C. Wu. 2008. Los Angeles 1-Million Tree Canopy Cover Assessment. Albany, CA: U.S. Department of Agriculture, Forest Service, Pacific Southwest Research Station. 52 p. McPherson, G., Q. Xiao, J. Bartens, C. Wu, J. Simpson, and J. O’Neil-Dunne. 2013. Urban Forest Inventory and Assessment Pilot Project: Phase Two Report. Submitted to CalFire Fire and Resource Assessment Program. http://www.sanjoseca.gov/DocumentCenter/View/23211 Metro. 2016. Canopy 2014. http://rlisdiscovery.oregonmetro.gov/?action=viewDetail&layerID=3552# Pillsbury, N.H.; Reimer, J.L.; Thompson, R.P. 1998. Tree Volume Equations for Fifteen Urban Species in California. Tech. Rep. 7, Urban Forest Ecosystems Institute, California Polytechnic State University; San Luis Obispo, CA, 56 p. Portland Parks & Recreation. 2004. Urban Forest Management Plan. http://www.portlandoregon.gov/ parks/38306?a=184641 Portland Parks & Recreation. 2007a. Urban Forest Action Plan. http://www.portlandoregon.gov/parks/ article/226238 Portland Parks & Recreation. 2007b. Portland’s Urban Forest Canopy: Assessment and Public Tree Evaluation. http://www.portlandoregon.gov/parks/article/424023 Portland Parks & Recreation. 2009. A standardized methodology to track urban forestry canopy cover change. White paper. Portland Parks & Recreation. 2017. Tree Canopy Monitoring: Protocol and Monitoring from 2000- 2015. http://www.portlandoregon.gov/parks/article/645547 US Forest Service. iTree Design (version 6.0). http://www.itreetools.org/design.php. Voelkel, Jackson. 2017. Canopy Analysis: CBG. https://climatescope.research.pdx.edu/income/ Xiao, Q.; McPherson, E.G.; Ustin, S.L.; Grismer, M.E. 2000. A new approach to modeling tree rainfall interception. Journal of Geophysical Research 105(D23):29173-29188. Zillow Home Value Index. Accessed 12/20/2017. http://www.zillow.com/portland-or/home-values/
Appendix A: Canopy and Potential, by Neighborhood

Figure 9: Map of Portland neighborhoods

                                          Portland Parks & Recreation   23
Appendix A
Neighborhood Canopy % Potential % % of PC in % of PC in % of PC in % of PC
residential industrial commercial in OS
Alameda 30.3% 23.1% 99.6% 0.0% 0.4% 0.0%
Arbor Lodge 18.2% 29.1% 82.9% 0.0% 10.1% 7.1%
Ardenwald-Johnson 37.9% 22.5% 61.3% 28.7% 2.6% 7.5%
Creek
Argay 12.8% 31.9% 44.3% 47.4% 3.1% 5.2%
Arlington Heights 70.0% 11.7% 19.8% 0.0% 0.0% 80.2%
Arnold Creek 71.5% 12.3% 97.2% 0.0% 0.0% 2.8%
Ash Creek 45.1% 21.1% 95.5% 0.0% 4.3% 0.2%
Beaumont-Wilshire 25.8% 27.4% 95.7% 0.0% 1.9% 2.4%
Boise 21.1% 23.9% 62.6% 11.8% 18.6% 7.0%
Brentwood-Darlington 22.5% 31.2% 86.0% 3.0% 2.4% 8.6%
Bridgeton 16.7% 37.6% 11.4% 0.2% 81.7% 6.8%
Bridlemile 48.1% 19.8% 88.6% 0.0% 4.1% 7.3%
Brooklyn 24.9% 26.7% 19.2% 43.9% 8.1% 28.8%
Buckman 18.5% 17.4% 42.7% 34.5% 10.7% 12.2%
Cathedral Park 22.6% 30.0% 42.9% 36.3% 6.9% 13.9%
Centennial 22.5% 29.9% 89.0% 0.0% 6.3% 4.7%
Collins View 62.6% 16.6% 63.4% 0.0% 0.5% 36.2%
Concordia 20.5% 29.2% 82.2% 8.9% 3.6% 5.3%
Creston-Kenilworth 23.7% 24.6% 81.8% 0.0% 13.8% 4.4%
Crestwood 57.8% 15.8% 81.5% 0.0% 2.5% 16.0%
Cully 19.2% 32.2% 49.4% 32.8% 2.7% 15.1%
Downtown 17.5% 15.7% 10.8% 0.1% 75.8% 13.2%
East Columbia 15.8% 38.4% 15.8% 54.9% 2.3% 27.0%
Eastmoreland 41.9% 25.3% 52.0% 0.0% 0.2% 47.8%
Eliot 16.8% 22.8% 31.4% 33.5% 31.8% 3.3%
Far Southwest 47.6% 19.2% 57.5% 0.0% 42.2% 0.3%
Forest Park 91.8% 4.3% 62.7% 0.5% 0.3% 36.5%
Foster-Powell 19.3% 27.9% 79.9% 0.0% 16.2% 3.9%
Glenfair 25.7% 29.6% 90.7% 0.0% 4.8% 4.5%
Goose Hollow 24.5% 16.5% 45.5% 0.0% 46.3% 8.2%
Grant Park 31.7% 23.7% 86.0% 0.0% 3.4% 10.6%
Hayden Island 14.4% 29.9% 29.2% 21.5% 48.8% 0.5%
Hayhurst 41.4% 23.5% 96.0% 0.0% 2.4% 1.7%
Hazelwood 20.2% 31.1% 64.2% 2.1% 16.5% 17.2%
Hillsdale 47.0% 19.2% 89.6% 0.0% 6.5% 3.8%
Hillside 65.9% 11.3% 91.1% 0.0% 2.2% 6.7%
Hollywood 15.2% 22.1% 36.4% 0.1% 63.2% 0.2%
Homestead 70.3% 8.7% 46.9% 36.8% 4.9% 11.4%
Hosford-Abernethy 19.7% 21.8% 55.6% 38.1% 4.8% 1.5%
24 Tree Canopy and Potential in Portland, OregonAppendix A
Neighborhood Canopy % Potential % % of PC in % of PC in % of PC in % of PC
residential industrial commercial in OS
Humboldt 20.6% 25.5% 79.0% 0.0% 17.0% 3.9%
Irvington 37.2% 19.2% 90.8% 0.3% 2.9% 6.0%
Kenton 16.8% 32.7% 22.2% 29.7% 1.6% 46.5%
Kerns 18.8% 18.5% 41.0% 18.2% 31.3% 9.6%
King 20.7% 25.1% 79.4% 0.0% 18.6% 2.0%
Laurelhurst 38.2% 19.6% 88.7% 0.0% 4.4% 6.9%
Lents 22.2% 30.7% 56.4% 14.3% 11.0% 18.4%
Linnton 40.6% 25.5% 17.3% 76.4% 1.8% 4.4%
Lloyd District 11.2% 18.3% 0.0% 11.6% 86.9% 1.4%
Madison South 32.4% 28.2% 53.6% 10.5% 4.6% 31.3%
Maplewood 48.6% 21.1% 96.5% 0.0% 1.0% 2.6%
Markham 44.5% 20.6% 99.8% 0.0% 0.1% 0.1%
Marshall Park 68.5% 12.9% 98.1% 0.0% 0.0% 1.9%
Mill Park 21.4% 28.9% 83.1% 0.0% 11.8% 5.1%
Montavilla 18.8% 28.4% 75.8% 3.4% 12.3% 8.6%
Mt. Scott-Arleta 20.3% 27.8% 87.1% 0.0% 10.3% 2.6%
Mt. Tabor 34.4% 23.1% 84.6% 0.0% 2.1% 13.3%
Multnomah 36.1% 24.3% 66.9% 0.8% 16.2% 16.1%
North Tabor 22.9% 23.2% 84.4% 0.5% 14.6% 0.5%
Northwest District 23.0% 18.2% 46.3% 24.9% 26.8% 2.0%
Northwest Heights 51.8% 17.3% 98.5% 0.0% 0.6% 0.9%
Northwest Industrial 4.2% 30.8% 0.0% 99.9% 0.0% 0.1%
Old Town/Chinatown 13.0% 19.3% 13.1% 0.0% 71.2% 15.7%
Overlook 16.0% 28.8% 21.4% 66.2% 5.1% 7.4%
Parkrose 16.7% 30.8% 43.0% 44.7% 10.5% 1.8%
Parkrose Heights 21.9% 30.2% 91.1% 0.0% 3.9% 5.0%
PDX 4.0% 15.1% 0.2% 97.1% 0.1% 2.7%
Pearl 8.3% 17.4% 0.0% 87.9% 6.2% 5.9%
Piedmont 18.9% 28.1% 69.5% 16.4% 3.5% 10.6%
Pleasant Valley 53.9% 23.2% 53.0% 0.4% 1.4% 45.2%
Portsmouth 25.0% 28.1% 77.6% 8.0% 4.1% 10.3%
Powellhurst-Gilbert 25.4% 30.5% 80.7% 4.1% 7.0% 8.2%
Reed 27.7% 23.1% 83.8% 14.8% 1.5% 0.0%
Richmond 27.0% 22.7% 87.9% 0.2% 10.7% 1.1%
Rose City Park 22.2% 26.9% 80.6% 6.8% 5.3% 7.3%
Roseway 18.9% 31.2% 86.4% 0.0% 5.6% 7.9%
Russell 20.2% 31.1% 88.7% 0.0% 6.7% 4.6%
Sabin 27.7% 24.2% 97.8% 0.0% 2.2% 0.0%
Sellwood-Moreland 31.4% 22.9% 67.4% 1.4% 10.6% 20.6%
Portland Parks & Recreation 25Appendix A
Neighborhood Canopy % Potential % % of PC in % of PC in % of PC in % of PC
residential industrial commercial in OS
South Burlingame 43.7% 18.3% 86.3% 0.0% 2.9% 10.7%
South Portland 26.5% 22.5% 43.0% 0.0% 47.8% 9.2%
South Tabor 21.8% 28.1% 85.9% 0.0% 8.3% 5.8%
Southwest Hills 62.5% 12.9% 92.3% 0.0% 1.0% 6.7%
St. Johns 18.5% 35.5% 11.2% 67.7% 0.9% 20.3%
Sullivan'S Gulch 24.2% 22.2% 50.5% 8.7% 37.5% 3.3%
Sumner 18.5% 27.2% 41.7% 54.4% 3.8% 0.1%
Sunderland 17.6% 35.9% 1.7% 65.6% 0.0% 32.8%
Sunnyside 26.2% 20.5% 82.3% 0.0% 16.3% 1.3%
Sylvan Highlands 60.2% 15.0% 54.9% 7.2% 5.8% 32.0%
University Park 23.5% 32.7% 78.1% 15.2% 2.7% 3.9%
Vernon 22.1% 27.2% 81.0% 0.0% 7.3% 11.7%
West Portland Park 39.1% 21.3% 67.5% 0.0% 12.0% 20.5%
Wilkes 23.3% 30.3% 45.0% 45.4% 1.1% 8.5%
Woodland Park 32.4% 23.7% 96.7% 3.3% 0.0% 0.0%
Woodlawn 17.9% 28.6% 71.7% 19.2% 6.3% 2.8%
Woodstock 25.7% 26.3% 92.8% 0.0% 4.7% 2.5%
26 Tree Canopy and Potential in Portland, OregonAppendix B: Methods
CANOPY COVER
This study does not include canopy cover estimates developed in
the 2017 Tree Canopy Monitoring Report, which used visual point
interpretation to estimate canopy extent and did not result in an updated
map of tree canopy cover—a necessary component for calculating canopy
potential. Estimates of existing canopy included in this study are based
on Metro’s 2014 land cover classification, which was produced using a
different method, and cannot be directly compared to the 2017 report’s
findings.
ZONING CATEGORIES
Zoning categories for this study are based on the zoning map adopted as
part of the 2035 Comprehensive Plan. While additional refinement to the
zoning map is expected in early 2018, zones used in this analysis reflect
changes to the map expected to take effect in May 2018, which will guide
development in the City for the remainder of the Plan. See Table 9 below
for an explanation of how individual zones were categorized into the four
aggregations used in this analysis.
Table 9: Zoning class categorization
Commercial Industrial Open Space Residential
CI2 EG1 OS Low Density High Den-
CM1 EG2 sity
CM2 EX RF R3
CM3 IG1 R20 R2
CE IG2 R10 R1
CR IH R7 RH
CX R5 RX
R2.5 IR
CI1
ECOSYSTEM SERVICES AND OTHER BENEFITS
Benefit calculations assume no net change in existing tree canopy,
attributing all canopy increases to the planting of 1.5” diameter, medium
form, broadleaf deciduous trees. Ecosystem service totals are based on
the annual services that trees would provide over 20 years of growth
(McPherson et al. 2002). Aesthetic and other benefits are based on
Portland’s median home value as of December 20, 2017 (Zillow 2017).
For a full summary of values used in this study, see Table 10.
Portland Parks & Recreation 27Appendix B Ecosystem Services Air Quality Trees intercept and absorb air pollutants on their leaf surfaces. Their ability to do so is based on tree size and species, which together determine total leaf surface area. The average yearly monetary value of the removal of ozone, nitrogen dioxide, sulfur dioxide, and particulate matter less than 10 microns (PM10) were calculated based on hourly deposition rates, pollutant concentrations, and meteorological data for a regional reference city (McPherson et al. 2002) and current prices (see Table 8), using a common medium sized tree, Norway maple, as a model for potential plantings. Net calculated air quality benefits were reduced to account for estimated annual emissions of biogenic volatile organic compounds (BVOCs) (Guenther et al. 1993). Carbon Sequestration Trees store carbon from the atmosphere in their biomass, which has the effect of reducing overall atmospheric carbon dioxide, a pollutant linked to global climate change. The monetary value of this service was calculated using species-based biomass equations (Pillsbury et al.1998) and the Environmental Protection Agency’s estimate of the social cost of carbon (IWG 2010). Stormwater Reduction Trees reduce the amount of rain that enters the stormwater system by intercepting precipitation with their foliage, which reduces water treatment costs. As with the interception of air quality pollutants, a tree’s ability to provide this service is a function of its leaf surface area, with large and evergreen trees providing the most benefits. Stormwater reductions and associated savings were calculated based on leaf area, canopy area, water depth (Xiao et al. 2000), local meteorological data, and the avoided cost of stormwater processing, valued at $.02779/gallon (McPherson et al 2002). Aesthetic and Other Benefits Aesthetic and other benefits were calculated as the increase in property sales price attributable to the presence of trees on site. Potential tree planting sites in rights-of-way adjoining low-density residential zones were each priced at 3% of the median home value for Portland, based on Donovan and Butry’s (2010) finding that street trees contribute a 3% increase in sales price of Portland single family homes. Prices for all other potential trees were based on Anderson and Cordell’s (1988) finding that large front yard trees increase single family home sale values by 0.88%. In order to be conservative, and to acknowledge that trees elsewhere in the yard might contribute less to overall sales price increases, reduction factors were applied to areas outside single family residential rights-of-way (McPherson et al. 2008). Potential planting sites in low-density residential zones outside the right-of-way were each valued at 70% of this total, and all sites in all other zones were valued at 40%. To estimate annual benefits, values were divided by leaf surface area of a 20-year-old medium-sized tree (4,770ft2) and multiplied by average annual growth of leaf surface area over that time period (McPherson et al. 2013). 28 Tree Canopy and Potential in Portland, Oregon
Appendix B

Table 10: Ecosystem service values
Service Type                         Service Value   Unit
Ecosystem Services
  Air Quality
     O3                              $2.40           lb.
     VOC                             $6.65           lb.
     NO2                             $2.40           lb.
     SO2                             $1.00           lb.
     PM10                            $2.72           lb.
 Carbon                              $0.00969        lb.
 Stormwater                          $0.02779        gallon

Aesthetic/Other Benefits
  low density residential ROW        $608.25         tree
  low density res. Non-ROW           $124.89         tree
  all other                          $71.37          tree

                                                              Portland Parks & Recreation   29
You can also read