Social Media Analytics of the Internet of Things - Research ...
←
→
Page content transcription
If your browser does not render page correctly, please read the page content below
Social Media Analytics of the Internet of Things
Jim Scheibmeir ( jimscheibmeir@gmail.com )
Colorado State University
Yashwant K. Malaiya
Colorado State University
Short Report
Keywords: Internet of things, Social media, Machine learning, Sentiment analysis, Popularity prediction
DOI: https://doi.org/10.21203/rs.3.rs-647683/v1
License: This work is licensed under a Creative Commons Attribution 4.0 International License. Read Full License
Page 1/17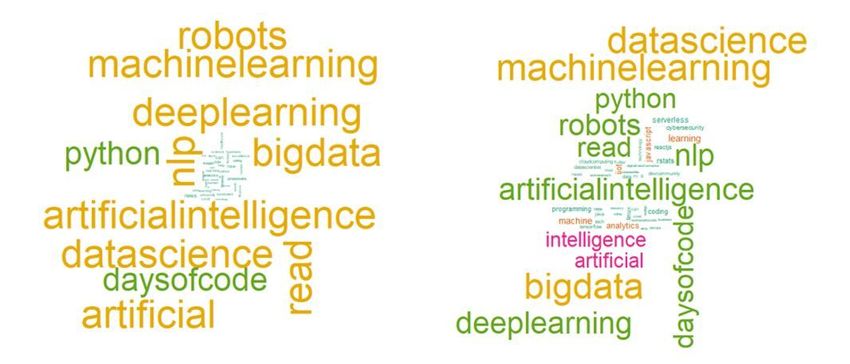
Abstract
The Internet of Things technology offers convenience and innovation in areas such as smart homes and smart cities. Internet of
Things solutions require careful management of devices and the risk mitigation of potential vulnerabilities within cyber-physical
systems. The Internet of Things concept, its implementations, and applications are frequently discussed on social media
platforms. This article illuminates the public view of the Internet of Things through a content-based analysis of contemporary
conversations occurring on the Twitter platform. Tweets can be analyzed with machine learning methods to converge the volume
and variety of conversations into predictive and descriptive models. We have reviewed 684,503 tweets collected in a two-week
period. Using supervised and unsupervised machine learning methods, we have identified interconnecting relationships between
trending themes and the most mentioned industries. We have identified characteristics of language sentiment which can help to
predict popularity within the realm of IoT conversation. We found the healthcare industry as the leading use case industry for IoT
implementations. This is not surprising as the current Covid-19 pandemic is driving significant social media discussions. There
was an alarming dearth of conversations towards cybersecurity. Only 12% of the tweets relating to the Internet of Things
contained any mention of topics such as encryption, vulnerabilities, or risk, among other cybersecurity-related terms.

1.0 Introduction
The Internet of Things (IoT) is an appealing technology that has eased the management of homes through smart appliances and
has enticed industries such as automotive, transportation, and agriculture [1]. IoT was first introduced in 1999 as a technology
concept for solving opportunities within logistics [2]. The IoT phenomenon brings compute from the cloud closer to people and
things [3]. Today, consumers of data are also producers of data. Twitter users tweet nearly 277,000 times every single minute [4].
The action of liking or retweeting a tweet is yet another data point.

We have collected 684,503 tweets within a two-week period from May 1st, 2021, through May 14th, 2021. We extend the collected
Twitter data with metadata using hierarchical clustering techniques and content-based analysis. The clustering algorithm is
informed of proper cluster distribution by the within-cluster sum of squares (WSS) and average silhouette methods. A mention
analysis is then performed to identify the number of industries, trends, and technology vendors having a presence in the tweets.
Sentiment analysis is carried out for tweets classified towards the industries and vendor technologies. Factors such as the trend
labels, industry labels, and sentiment scores are then used in naïve Bayes prediction models. We illustrate the relationships, or lack
of, between the trends, industries, and technology providers utilizing network graphs. Section two contains a brief background on
the topics of IoT and social media. The research and analysis methodology is described in detail within section three. Finally, the
fourth and fifth sections offer discussion and conclusion to the research. The main contributions of this research work include:

    Using advanced statistical and machine learning (ML) methods including naïve Bayes, hierarchical clustering, and natural
    language processing with sentiment analysis, we evaluate 684,503 contemporary tweets on the topic of the Internet of Things
    to shed light on public opinion, technology trends, popular industry usage and the popularity and sentiment of technology
    providers in this space.
    We uncover a substantial problem in the current conversations that while healthcare was the leading industry of mention only
    12% of IoT tweets discuss cybersecurity concerns.
    We stand apart from other IoT researchers by considering the volume and variety of public opinion towards this technology.

2.0 Background Work
2.1 Use of social media in research
The Twitter data has been utilized in several recent research investigations [5–7]. The public availability of the tweets allows
researchers to extract valuable conclusions from them [8]. It has been found that the geotagging of twitter users’ tweets can
complement surveys as well as enhance a sampling profile [9]. The same study found that their survey showed bias towards
elderly participants while the Twitter data was biased towards a younger population. The researchers utilized these conflicting
biases to balance their findings. A study of 640 university students found that the leading factor for using social media was to
search for and access information [10]. An earlier study by Bougie et al. [11] followed software engineering groups on Twitter to
                                                              Page 2/17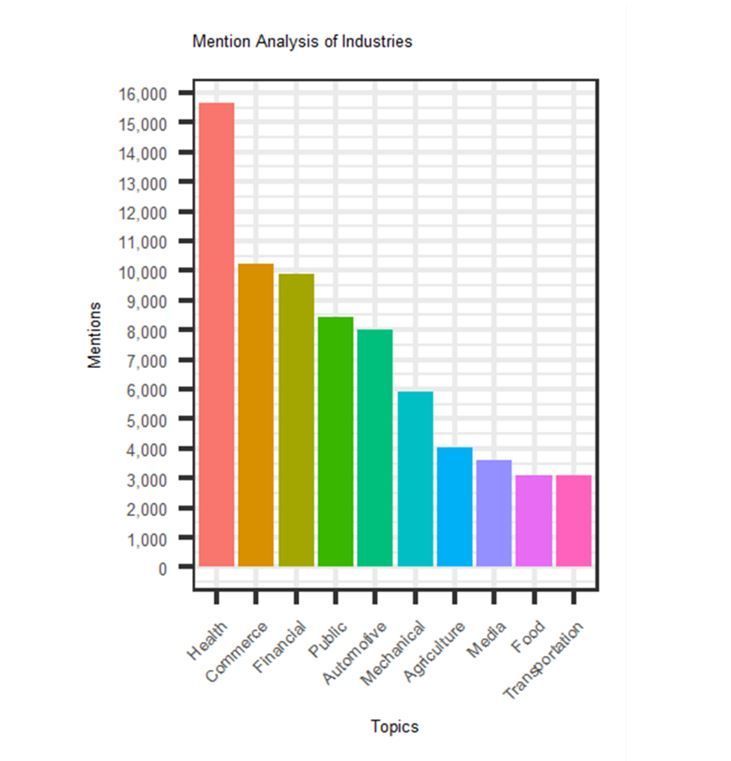
determine how they utilized the platform. This study found that 23% of the groups’ tweets were towards software engineering
topics. Of that 23% of their total tweets which regarded software engineering, 62% were towards solving software engineering
problems. Another study sought to answer if software engineering practitioners use and cite scientific research in their blogs; they
do not [12]. Rather, software engineering practitioners utilize social media to become up to date on technology trends [13]. Another
research article states that microblogging serves by linking to web resources, connecting users, and directing users’ attention, as
well as offering another channel for the public communication of science [14].
2.2 Related works on the Internet of Things
Implementing an IoT system requires storage, networks, load-balancing, and analysis tools. According to Atalay and Angin [15], an
IoT solution should utilize network partitions in private clouds which provide partitioning for enhancing security. Such network
partitions could encapsulate the concerns of actuators and sensors, the model of system states, and the business and program
logic. An encryption key management system would be utilized to support encryption across network enclaves and an intrusion
detection system (IDS) could be implemented to identify malicious activity.

The growing interest in IoT and the implementation of the systems have resulted in large cyber-attack surfaces [15]. A few well-
known cyber-physical system attacks include the Stuxnet effect on an Iranian uranium enrichment plant [16] and more recently, a
ransomware attack upon Colonial Pipeline that resulted in the gas pipeline being shut down for six days and a near $5 million
payout to the hackers [17]. There are also known consumer exploits including hacked Smart TVs listening to conversations,
personal information being extracted from coffee machines, and security cameras leaking images [18]. Today, IoT
implementations may be utilized to carry medicine, medical samples, and to assist with the management of pandemics [19],
furthering the need for rigor and security in the implementations. In a 2019 research survey of 220 security leaders in industrial
and manufacturing, 79% of respondents indicated they had experienced an IoT cyberattack within that past year [20]. The security
aspects of IoT have the attention of legitimate organizations who seek to enhance the defense as well as the hackers.

The cybersecurity concerns of IoT systems are growing in complexity and have insufficient security solutions [15]. The evaluation
of cyber-physical system component vulnerabilities is a challenging task due to the sheer number of devices and their varied
configurations. Common threats include denial of service (DoS) attacks while a common weakness is insecure wireless
networking [15]. The complexity of IoT systems and their emergent behavior also complicate the testing of the systems [21].

To manage the complexity while achieving value and providing security of the system’s assets and users, five best practices have
been suggested by Shi et al. [3]. Good service management of edge computing and IoT systems include these five considerations:

    Differentiation in device identification to discern specific state metrics such as the health of the specific device instances.
    Extensibility in the system to allow for replacement endpoints being easily swapped in and out.
    Isolation of access and data via roles and other controlling factors.
    Security/Privacy which preserves availability and confidentiality characteristics.
    Optimization of the system and components’ attributes such as cost, latency, or bandwidth.

While Shi et al. [3] mention the optimization of system components including latency and bandwidth, Fizza et al. [22] dive deeper
into optimization stating that existing definitions of quality of experience (QoE) must be renewed with the autonomous IoT
systems in mind. The same research found that if QoE is not considered in autonomous IoT applications, poor quality of
decisions and resulting actions may occur. Motta et al. [23] have examined the IoT-related literature to find twenty-nine definitions
of the concept. Connectivity, a component of QoE, is among the common concepts within the definitions Motta et al. distilled.
From those twenty-nine definitions, they have identified seven key facets. These facets must be considered when engineering an
IoT software system. They include:

    Connectivity includes the medium for things to connect to implement the IoT paradigm. Connectivity may be challenged by
    security concerns or the quality of service.
    Things include the number of heterogeneous tags, sensors, actuators, among other things. There exist challenges of
    maintaining the identities of these devices as well as managing their behavior.

                                                              Page 3/17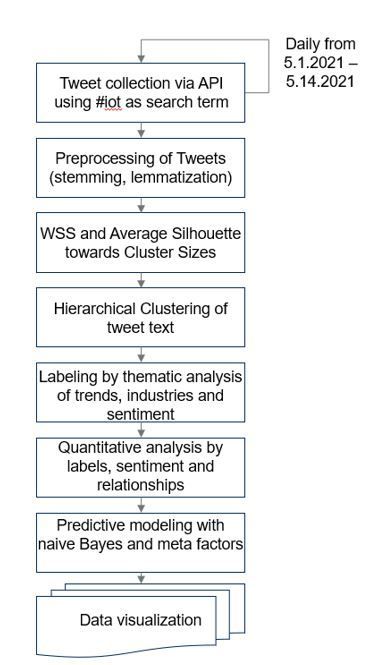
The behavior of IoT systems may include emergent behavior, which is the nonobvious side effects resulting from the
    composition of individual parts into a system. The main cause of emergent behavior is due to the complexity of systems and
    the human interaction within them [24].
    The smartness of the things within the IoT system relates to how devices are managed, orchestrated, and their allowance and
    use of autonomous behavior.
    Problem Domain may refer to the industry or specific problem that the IoT software system is built to alleviate.
    Interactivity is not limited to the interaction between things and humans, but also the interaction amongst things within the
    IoT system.
    The environment is the context in which an IoT system operates and can also be specific to the problem domain or industry.

3.0 Methodology
3.1 Data acquisition and preprocessing
We wrote and utilized an R program to manage the downloading of tweets from Twitter’s application programming interface (API).
Another R program was created to label the tweets and to perform the content-based analysis. The analysis begins with
preprocessing the tweets including the removal of stop words and usage of word stemming and lemmatization. The analysis
includes the determination of IoT trends and industry and labeling the tweets towards those factors. There is an evaluation of
sentiment within the labeled tweets. We also analyze the relationships between the factors of industry and trending terms. A naïve
Bayes model is created to determine whether our labeled factors can predict the content or popularity of the tweets. The following
illustration presents our methodology in seven steps. The seven steps are carried out in two R programs. The R programs and a
compressed CSV file of the 684,503 tweets are available for use and evaluation on a publicly available Gitlab site [25].

To perform the collection of tweets, we first created a programming account on the Twitter platform. This account creation offered
the authentication and authorization needed to access the Twitter platform via API. For the first fourteen days of May 2021, we
searched for tweets containing #iot and stored up to 50,000 per day. The search limit was required as our AWS EC2 server
instance is limited to four cores and 32GB of memory. The impact of the limited server resources will be described later in this
section. By the last day of tweet collection, we had successfully captured 684,503 tweets containing #iot.

3.2 Number of cluster determination
After data collection, we created a document-term object matrix. The individual words from each tweet were then cast into the
matrix and their frequency of appearance recorded. To determine an ideal number of clusters, we utilized within-cluster sum of
squares (WSS) and the average silhouette methods. However, due to the size of the term matrix as input into these methods and
the restrictions of our compute environment, only samples of the entire tweet corpus were used to generate the term matrix.

The WSS method will iterate through many generations of k-means clusters. During each iteration through k number of clusters,
the squared distance between a cluster’s observations (within cluster) and the clusters’ centroid are summed and plotted for the
given number of clusters. This is done for all clusters and compared for Euclidean distance over the iterations. The ideal number
of clusters is frequently determined visually, known as the “elbow method” and identified when the WSS is decreasing and the
next increment in cluster generation does not offer much benefit. This is often visually detected by looking for the “elbow” or the
“knee” in the line chart where the WSS has dropped and then flattens. The illustration below identifies the knee at four clusters for
our dataset of #iot tweets collected over two weeks.

The silhouette method is like the WSS method in that it also generates many iterations of clusters and evaluates them for a proper
k size. The average silhouette evaluation is performed by comparing the silhouette width of each cluster within an iteration to
cluster widths of succeeding iterations having incrementing numbers of clusters. Overall, when many clusters are found within a
small dimension, the width of the clusters (silhouettes) are smaller than if one cluster was occupying the same space. Thus, when
having many small clusters in a dimension that could be optimized by having fewer clusters, the average silhouette method will
indicate a small average cluster width and an improper number of k clusters.

                                                             Page 4/17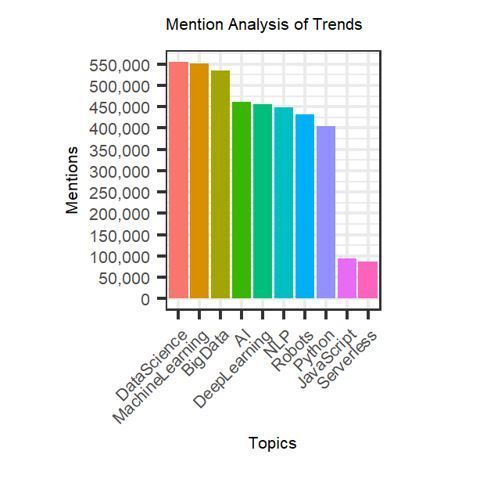
Additionally, if clusters are generated as tightly grouped neighbors, then one observation in one cluster will be very close in
distance to an observation in a neighboring cluster. The closeness of observations belonging to different clusters can indicate that
the model suffers too many clusters. A quality number of clusters to generate would be the number of clusters that optimizes the
largest average silhouette width. Ribeiro et al. [26] utilized maximum silhouette scores in their graph-clustering algorithm to
identify groups of terms and their semantics. Their method, and the inclusion of silhouette scoring, outperformed previous
methods. In our research, the silhouette method suggested the proper number of clusters for our dataset of IoT tweets to be five
(as shown in Fig. 3), whereas the WSS method suggested the proper number of clusters to be four. To ease the execution of
algorithms, we utilized R packages factoextra and NbClust.

Unsupervised hierarchical clustering was performed for both four and five cluster outcomes. An agglomerative method was used.
With agglomerative clustering, each observation initializes as its cluster and through iterations is joined with nodes being the
shortest distance away [27]. The difference of trend identification between the different cluster generations, whether four or five
clusters, was not found to be interesting. This is further illustrated within Fig. 4 below where the largest clusters of tweets were
cast into word clouds. It is seen that the leading terms are still quite similar despite the differing number of clusters generated.
What was most concerning, whether four or five clusters were generated, was the lack of any cybersecurity topic as a trending top
ten topic. Only 12% of the 684,503 tweets contained any term related to vulnerabilities, hacking, malware, and other cybersecurity-
related terms.

The tweets were labeled for having inclusion to industry, trend, and commercial vendor technologies. To determine industry names
and search terms, we utilized a list by the International Labor Organization [28]. The tweets were also evaluated for their sentiment
by utilizing the NRC lexicon [29]. Our analysis will be further discussed in the following section.

4. Findings And Discussion
4.1 Unsupervised hierarchical clustering and top trends
Because the WSS and average silhouette methods identified the proper number of clusters for our dataset as four and five
respectively, we generated clusters of tweets for both findings. However, the leading trends identified did not vary between four
and five clusters as illustrated in the word clouds below. Word clouds are basic and intuitive tools that allow us to evaluate text
results for insight [30].

The word cloud on the left is the largest cluster when only four clusters were generated. The word cloud on the right is the largest
cluster when five were generated. We performed a similar analysis of trend analysis throughout the cluster creation and the
leading identified trends did not alter. Regardless of the number of clusters created, the top mentioned term continued to be “data
science”. It was closely followed by “machine learning”, and subsequent frequent terms began dropping off in mention at a
greater pace than compared to the first and second most mentioned terms. The mention analysis of trending topics is illustrated
in the following figure.

4.2 A Small number of Cybersecurity Mentions within the IoT Tweets
Among the trend analysis, in general, what was most concerning was the lack of cybersecurity topics in the list of top mentioned
terms. As illustrated in the following pie chart, only 12% of the 684,503 tweets had any mention of the following stemmed
cybersecurity-related terms: cyber, secure, hack, vulnerability, risk, exploit, breach, malware, virus, ransomware, spyware, worm,
trojan, encrypt or phishing.

When tweets did mention cybersecurity terms, the topics of the three most retweeted conversations included an industry
roundtable discussion [31], a reference to an opinion article about the risk of AI on military technology [32], and a reference to an
article on the risk of AI on national security [33]. Among the most retweeted tweets discussing cybersecurity, the top three are each
a technology being touted to secure IoT implementations.

4.3 Content-based Analysis of Industries within the IoT Tweets

                                                              Page 5/17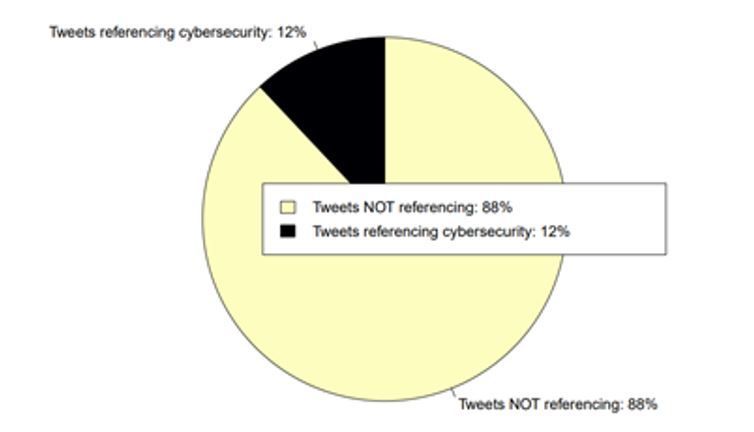
What is further concerning by the dearth of cybersecurity-related discussions within the collection of IoT-related tweets is that the
top mentioned industry was healthcare. Previous research identified healthcare as one of the lesser influential industries
mentioned in research papers on IoT [34]. Our research and this paper are one effort in shifting that claim. The top ten mentioned
industries are depicted in Fig. 7. It is not surprising to see healthcare leading the mentions as many countries are still experiencing
the Covid-19 pandemic. While collecting these tweets based upon the inclusion of #iot, 4% of the tweets referenced Covid-19.
Recent research has discussed the relationship between digital twins, IoT, and contact tracing technology [35], which could be
utilized to help understand the behavior of a pandemic. After healthcare, the second most mentioned industry within the IoT
tweets is commerce followed by financial.
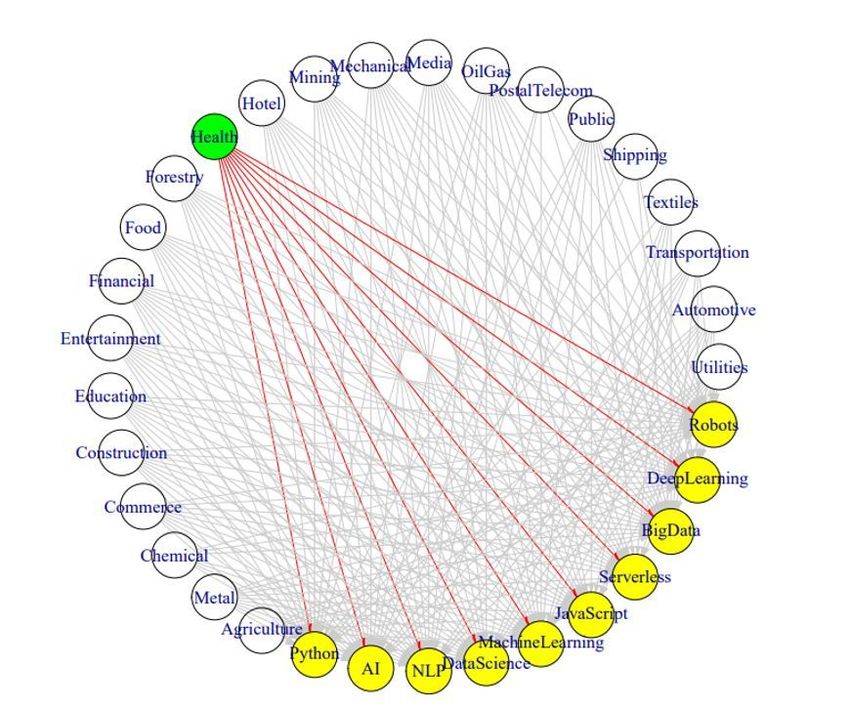
4.4 Network analysis and relationship identification
A network analysis was also performed on the relationships between trends and industries. Fundamental parameters of a network
are its number of nodes, otherwise known as the network size, and the number of edges [36]. We are surrounded by naturally
connected structures and networks [37]. Industries and technology trends are no different, as we confirm with this analysis
regarding the health industry connection to all the top identified IoT trends.
To construct the network graph in Fig. 8, the tweets’ metadata labels were cast as nodes into two tables. The first table listed every
industry and the trend terms (nodes) along with a unique identifier. The second table was a large list of the industry nodes, a
corresponding trend node, and a weight column that indicated the frequency when a tweet was identified as matching both labels.
Utilizing the network and igraph libraries in R, we plotted the node and edge relationships as the data visualization in Fig. 8. This
figure is a network graph that has the most mentioned industry, healthcare, highlighted as a green network node. Then, red lines
which indicate relationships, are drawn to each of the yellow trending terms given both labels co-exist in single tweet metadata
that we created during our preprocessing. As the image indicates, all trend terms are found in the network of healthcare tweets. As
Fig. 4 indicated, serverless was the least mentioned trending term, yet it too has an inner-tweet relationship to those tweets having
reference to healthcare.
4.5 Sentiment analysis of commercial technology providers within the IoT
tweets
There are many technology providers which have solutions, offer services, or offer platforms to solve IoT opportunities. We
performed a content-based analysis of technology vendors within the IoT space. To determine the list of IoT vendors to analyze,
we utilized two 2020 research reports by Gartner [38–39]. We utilized the sentimentr library to determine the sentiment scores of
industry technology providers.
We plotted the technology provider names into a chart having four sections. The four sections of the chart have an x and y-axis,
where the x-axis is the z-score of the tweet sentiments when the vendor is mentioned. The z-score is found by first determining the
sentiment of all tweets that mention the commercial technologies, then calculating the average, and the standard deviation. Then,
the z-score for a given technology vendor is calculated by dividing the commercial vendor’s mentioned tweet sentiment by the
number of standard deviations away from the population’s average sentiment. The y-axis is measuring the number of times an
IoT technology provider is mentioned in our corpus of tweets.
In general, if a vendor is placed on the upper right area of the chart, that implies that they are widely mentioned and the sentiment
of the tweets that they are mentioned within is above average sentiment. If a vendor is found on the bottom left side of the chart,
they would be both lower in popularity and lower in sentiment positivity within this collection of tweets. Any vendors having less
than ten mentions within the tweets were removed from the plot. The dashed blue lines represent the average mentions and
average sentiment scores. The average sentiment of all tweets mentioning these IoT solution vendors is slightly positive. Use
caution when reviewing the chart as the y-axis is intentionally logarithmic. The logarithmic axis allows the data to pull slightly
apart, as though zooming in, for the vendors who have lesser mentions. The vendor placement can be viewed in Fig. 9.
Amazon’s AWS has the most mentions and the most positive sentiment among the vendors being mentioned within the IoT
tweets. The AWS IoT Core can connect IoT devices to AWS cloud services and AWS offers an IoT SDK for development in
Page 6/17languages such as Java, JavaScript, or Python. AWS IoT Core product supports message brokering for these protocols [40]:
Message Queuing and Telemetry Transport (MQTT)
MQTT over Websockets Secure (WSS)
Hypertext Transfer Protocol -Secure (HTTPS)
Long Range Wide Area Network (LoRaWan)
Davra is within the bottom left area of the plot. They have fewer mentions in the analysis and the tweets that do mention them
tend to have a lower sentiment than average across all of the analyzed technology vendors. Davra offers an IoT Platform that has
features such as access control to both devices and services, service management features including edge, cloud, Kubernetes, or
container deployments, as well as supporting many different IoT device protocols and data storage capabilities [41].
4.4 Predictive modeling based upon our IoT tweet metadata factors
Naïve Bayes has been utilized to accurately forecast crime activities including arson, burglary, and theft [42]. Biology researchers
have successfully applied naïve Bayes modeling to determine the presence of links in protein interaction networks, although
anomaly detection was utilized to increase the accuracy [43]. In our research, we utilize naïve Bayes models to understand
relationships between the IoT trends, the sentiment of the content, industries, and IoT technology providers.
Using a naïve Bayes model with a dependent factor of trend type and an independent variable of sentiment, we found that given a
tweet is labeled as towards the trending topic data science, there is a 66.7% probability that the sentiment of the tweet is positive.
Tweets that were labeled as towards the IoT trend of natural language processing (NLP) scored the second-highest in positive
sentiment probability at 57.1%. The table below notates the conditional probabilities as found by the model.
Table 1
Trending IoT tweet topics having the highest probability of positive sentiment are highlighted in this conditional probability table
Trends (below) anger anticipation disgust fear joy negative positive sadness surprise trust
AI 0.000 0.214 0.107 0.071 0.000 0.107 0.357 0.036 0.000 0.107
BigData 0.149 0.064 0.000 0.064 0.128 0.106 0.234 0.000 0.064 0.191
DataScience 0.000 0.222 0.000 0.000 0.000 0.000 0.667 0.000 0.111 0.000
DeepLearning 0.100 0.100 0.000 0.000 0.100 0.200 0.300 0.000 0.100 0.100
JavaScript 0.000 0.222 0.000 0.000 0.111 0.000 0.444 0.000 0.000 0.222
MachineLearning 0.045 0.136 0.000 0.091 0.000 0.136 0.455 0.000 0.000 0.136
NLP 0.000 0.143 0.143 0.000 0.000 0.143 0.571 0.000 0.000 0.000
Python 0.000 0.000 0.000 0.500 0.000 0.500 0.000 0.000 0.000 0.000
A second naïve Bayes model was created to help with understanding which factors affect the prediction of tweets being
retweeted. The industry and trend factors had little effect on a tweet being retweeted. However, using words that conveyed the
sentiment of either fear or joy would improve the probability of retweet to 13.0% and 12.4% respectively. A third naïve Bayes model
was used to predict which trending term an IoT tweet may be about. Using the factors of favorite, industry type, retweet, and IoT
vendor name, we could predict the trend a tweet was referencing with an accuracy of 63.9%.
5.0 Conclusion
There are new microblogs on the topic of the Internet of Things each day. From May 1st, 2021, to May 14th, 2021, we collected
684,503 tweets by searching Twitter’s API for #iot. While previous research has indicated that healthcare is not a top-three industry
influence on the IoT [34], our research determined healthcare the most widely discussed industry. While the healthcare industry
requires secured information systems, only 12% of the tweets within this IoT network analysis referenced cybersecurity concepts.
Page 7/17From this collection of tweets, the most common trend term was data science. A network analysis graph depicted that every
trending term was mentioned within healthcare-related tweets. Whereas for the tweets regarding the shipping industry, only the
trends of AI, big data, and machine learning were related.
No cybersecurity-related terms were identified as trending terms. In general, there was an alarming dearth of conversations
towards cybersecurity as only 12% of the IoT tweets contained any mention of topics such as encryption, vulnerabilities, or risk,
among other cybersecurity-related terms.
The trending terms having the highest probability of positive sentiment in a referencing tweet were data science followed by
natural language processing. We could predict what trending term a tweet was referencing with a 63.9% accuracy. To reach that
level of accuracy in the model we utilized the factors of whether the tweet had been retweeted, marked as a favorite, and by
knowing the industry and vendors being mentioned in the tweet’s text.
The technology provider that was most frequently mentioned in this collection of tweets was Amazon AWS. It was also Amazon
AWS that had the highest average sentiment among the vendors that were considered in this research.
A limitation of this research is that only one microblogging site, Twitter, was utilized for data collection. Another limitation was the
available computing power of our systems. Our experience is that 32 GB of memory is not sufficient when analyzing 684,503
tweets and thus forces the use of samples within the collection. Specifically, we turned to use samples when carrying out the
unsupervised hierarchical clustering and the naive Bayes models within our methodology.
Abbreviations
API
application programming interface; CSV:Comma-separated values; DoS:Denial of service; IDT:Intrusion detection systems;
IoT:Internet of things; NRC:National research council Canada; NLP:Natural language processing; QoE:quality of experience;
WSS:Within-cluster sum of squares;
Declarations
Availability of data and materials The datasets analyzed during the study and the R code are available in the GitLab repository,
https://gitlab.com/jimscheibmeir/socialmediaanalyticsofiot Competing interests The authors declare that they have no
competing interests. Funding No funding was received for this research effort. Authors' contributions JS conceived the study. JS
and YM reviewed the literature. JS collected the data and performed the text analysis. YM supervised the project. All authors
contributed to the writing of the manuscript, read, and approved the final version. Acknowledgements We thank the National
Research Council Canada (NRC), Saif Mohammad, and Peter Turney for the creation and maintenance of their sentiment lexicon.
References
1. Girma, A. Analysis of Security Vulnerability and Analytics of Internet of Things (IOT) Platform. In: Latifi S. (ed) Information
Technology - New Generations. Advances in Intelligent Systems and Computing, vol 738. Springer, Cham: 2018
2. Ashton, K. That Internet of Things thing. RFiD J. 2009;22;97–114.
3. Shi W, Cao J, Zhang Q, Li Y, Xu, L. Edge Computing: Vision and Challenges. IEEE JIOT. 2016;3:637-646.
https://doi:10.1109/JIOT.2016.2579198.
4. James, J. Data never sleeps 2.0. 2014. Retrieved from https://www.domo.com/blog/data-never-sleeps-2-0/
5. Cruickshank, I.J., Carley, K.M. Characterizing communities of hashtag usage on twitter during the 2020 COVID-19 pandemic
by multi-view clustering. Appl Netw Sci. 2020. https://doi.org/10.1007/s41109-020-00317-8
6. Guarino, S., Trino, N., Celestini, A. et al. Characterizing networks of propaganda on twitter: a case study. Appl Netw Sci. 2020.
https://doi.org/10.1007/s41109-020-00286-y
Page 8/177. Tien, J.H., Eisenberg, M.C., Cherng, S.T. et al. Online reactions to the 2017 ‘Unite the right’ rally in Charlottesville: measuring
polarization in Twitter networks using media followership. Appl Netw Sci. 2020. https://doi.org/10.1007/s41109-019-0223-3
8. D'heer E, Verdegem P. What social media data mean for audience studies: a multidimensional investigation of Twitter use
during a current affairs TV programme, Information, Communication & Society. 2015;18:221-
234. doi:10.1080/1369118X.2014.952318.
9. Martín Y, Cutter S, Li Z. Bridging Twitter and Survey Data for Evacuation Assessment of Hurricane Matthew and Hurricane
Irma. Natural Hazards Review. 2020. doi.org/10.1061/(ASCE)NH.1527-6996.0000354.
10. Gómez-García M, Matosas-López L, Ruiz-Palmero J. Social Networks Use Patterns among University Youth: The Validity and
Reliability of an Updated Measurement Instrument. Sustainability. 2020. doi:10.3390/su12093503.
11. Bougie G, Starke J, Storey M, German D.M. Towards understanding twitter use in software engineering: preliminary findings,
ongoing challenges and future questions. In: Web2SE '11. ACM, New York, NY, USA. 2011;31–36.
https://doi:10.1145/1984701.1984707.
12. Williams A. Do software engineering practitioners cite research on software testing in their online articles?: a preliminary
survey. ACM. 2018;151–156.
13. Storey M. et al. The impact of social media on software engineering practices and tools. In: Proceedings of the FSE/SDP
workshop on Future of software engineering research. ACM. 2010;359–364.
14. Büchi, M. Microblogging as an extension of science reporting. Public Understanding of Science. 2017;953–968.
https://doi:10.1177/0963662516657794.
15. Atalay M, Angin P. A Digital twins approach to smart grid security testing and standardization. In: IEEE International Workshop
on Metrology for Industry 4.0 & IoT, Roma, Italy, 2020;435-440, https://doi:10.1109/MetroInd4.0IoT48571.2020.9138264.
16. Langner R. Stuxnet: Dissecting a Cyberwarfare Weapon. In IEEE Security & Privacy. 2011;49-51.
https://doi:10.1109/MSP.2011.67.
17. Turton W, Riley M, Jacobs J. Colonial Pipeline Paid Hackers Nearly $5 Million in Ransom. Retrieved May 14, 2021, from
https://www.bloomberg.com/news/articles/2021-05-13/colonial-pipeline-paid-hackers-nearly-5-million-in-ransom
18. Srinivas, R. 10 IoT Security Incidents That Make You Feel Less Secure CISO Magizine. Jan. 10, 2020. Available:
https://cisomag.eccouncil.org/10-iot-security-incidents-that-make-you-feel-less-secure/
19. Chen, C.W. Drones as internet of video things front-end sensors: challenges and opportunities. Discov Internet Things. 2021..
https://doi.org/10.1007/s43926-021-00014-7.
20. Hearn M, Rix S. Cybersecurity considerations for digital twin implementations report. IIC Journal of Innovation. 2019.
21. Kim H, Ahmad A, Hwang J, Baqa H, Le Gall F, Ortega M.A.R., Song J. IoT-TaaS: Towards a Prospective IoT Testing Framework.
In IEEE Access. 2018;15480-15493. https://doi:10.1109/ACCESS.2018.2802489.
22. Fizza, K., Banerjee, A., Mitra, K. et al. QoE in IoT: a vision, survey and future directions. Discov Internet Things. 2021.
https://doi.org/10.1007/s43926-021-00006-7.
23. Motta R., de Oliveira K., Travassos G. On challenges in engineering IoT software systems. In: Proceedings of the XXXII
Brazilian Symposium on Software Engineering. ACM, NY, USA. 2018;42–51. https://doi:10.1145/3266237.3266263.
24. Grieves M, Vickers J. Digital Twin: Mitigating unpredictable, undesirable emergent behavior in complex systems, Springer
International Publishing, Cham. 2017:85–113.
25. Scheibmeir J. Code and data files. Gitlab. 2021. https://gitlab.com/jimscheibmeir/socialmediaanalyticsofiot
26. Ribeiro, E., Teixeira, A., Ribeiro, R. et al. Semantic frame induction through the detection of communities of verbs and their
arguments. Appl Netw Sci. 2020. https://doi.org/10.1007/s41109-020-00312-z
27. Hastie T, Tibshirani R, Friedman J. The elements of statistical learning: data mining, inference, and prediction. Springer,
Berlin: 2009.
28. International Labor Organization. Industries and sectors. Accessed: May 16, 2021. Available:
https://www.ilo.org/global/industries-and-sectors/lang--en/index.htm
29. Mohammad S, Turney P. Emotions evoked by common words and phrases: using mechanical turk to create an emotion
lexicon. In: Proceedings of the NAACL-HLT 2010 Workshop on Computational Approaches to Analysis and Generation of
Page 9/17Emotion in Text, LA, California. 2010.
30. Altuncu, M., Mayer, E., Yaliraki, S. et al. From free text to clusters of content in health records: an unsupervised graph
partitioning approach. Appl Netw Sci. 2019. https://doi.org/10.1007/s41109-018-0109-9
31. [@#100DaysOfCode]. Sponsored Roundtable: Artificial Intelligence Tech – SecurityInfoWatch. May 14, 2021. Twitter.
32. [@HubOfML]. Opinion: Artificial Intelligence’s Military Risks, Potential – GovTech May 14, 2021. Twitter.
33. [@#100DaysOfCode]. Artificial intelligence and the future of national security - ASU Now May 12, 2021. Twitter.
34. Dachyar M, Zagloel T, Saragih L.R. Knowledge growth and development: internet of things (IoT) research. Heliyon
2019;5:2006-2018. https://doi.org/10.1016/j.heliyon.2019.e02264.
35. Scheibmeir J, Malaiya Y.K. Multi-model security and social media analytics of the digital twin, ASTEJ. 20205:323-330.
36. Smith, K.M., Escudero, J. Normalised degree variance. Appl Netw Sci 2020;5;32. https://doi.org/10.1007/s41109-020-00273-3
37. Kolaczyk, ED, Csárdi G. Statistical Analysis of Network Data with R, vol. 65. Springer, New York. 2014
38. Goodness E, Velosa A, Friedman T, Berthelsen E, Kim S, Havart-Simkin P, Thielemann K. Magic quadrant for industrial IoT
platforms. Gartner Inc. Oct. 19, 2020 Accessed: May 16, 2021. Available: https://www.gartner.com/doc/3991952
39. Wong J, Leow A, Batchu A. Magic quadrant for multiexperience development platforms. Gartner Inc., July 7, 2020. Accessed:
May 16, 2021. Available: https://www.gartner.com/doc/3987201
40. AWS. What is AWS IoT? AWS. Accessed on: June 1, 2021, Available:
https://docs.aws.amazon.com/iot/latest/developerguide/what-is-aws-iot.html
41. Davra. IoT platform: internet of things platform - davra IoT platform. Davra, Accessed: June 1, 2021. Available:
https://davra.com/iot-platform/
42. Niu, X., Elsisy, A., Derzsy, N. et al. Dynamics of crime activities in the network of city community areas. Appl Netw Sci
2019;4:127. https://doi.org/10.1007/s41109-019-0239-8
43. Singh, K.V., Vig, L. Improved prediction of missing protein interactome links via anomaly detection. Appl Netw Sci 2017;2:2.
https://doi.org/10.1007/s41109-017-0022-7
Figures
Page 10/17Figure 1
Seven steps make up the methodology starting with an iterative collection of tweets through labeling and analysis until the
visualization of the data
Page 11/17Figure 2
Output of the Within-cluster sum of squares method to determine the proper number of clusters to be generated. The method
indicated that four clusters were appropriate for the IoT tweets dataset
Page 12/17Figure 3
Output of the Silhouette method to determine the proper number of clusters to be generated. The method indicated five clusters as
appropriate for the IoT tweets dataset
Figure 4
Page 13/17The leading trends do not include cybersecurity terms nor greatly shift whether four or five clusters of our IoT tweets were
generated as indicated by word clouds of the largest clusters
Figure 5
Term frequency is highest for data science, followed closely by machine learning
Figure 6
Only 12% of the total collection of IoT tweets had mention of common cybersecurity terms
Page 14/17Figure 7
The top ten mentioned industry within the collection of IoT tweets was healthcare followed by commerce and then financial
Page 15/17Figure 8
This network graph utilizes red arrows that depict relationships between tweets towards the healthcare industry, highlighted in
green near the top of the image, and all of the trending terms which are lighted in yellow
Page 16/17Figure 9
AWS has the most mentions and the highest sentiment among our corpus of IoT tweets while the technology company Davra
would have a lesser number of mention and a sentiment less than average
Page 17/17You can also read