CLIMATE CHANGE and EXTREME HEAT EVENTS - CDC
←
→
Page content transcription
If your browser does not render page correctly, please read the page content below

CLIMATE CHANGE and EXTREME HEAT EVENTS
1

Contents
Overview .......................................................................................................................................................2

Understanding Extreme Heat Events..............................................................................................................3

      What Is an Extreme Heat Event?.............................................................................................................3

      Health Effects of Extreme Heat Events....................................................................................................4

      Vulnerability to Extreme Heat Events......................................................................................................5

Climate Change and Extreme Heat Events.....................................................................................................6

      Climate Change and a Warming World...................................................................................................6

      Future Climate Change...........................................................................................................................7

      Extreme Heat Events Will Become More Frequent and More Severe.......................................................8

      Projected Health Impacts of Extreme Heat Events in the Future............................................................10

Responding to Extreme Heat Events............................................................................................................11

      Extreme Heat Programs: Working to Protect Public Health...................................................................11

      How Do Extreme Heat Programs Perform?...........................................................................................11

Conclusion...................................................................................................................................................13

      More Extreme Heat Events Will Increase Need for Public Health Programs..........................................13

 All scientific information in this document is derived from peer-reviewed assessments, including those
 published by the United States Global Change Research Program and the Intergovernmental Panel
 on Climate Change, from other peer-reviewed literature, or from federal government agencies.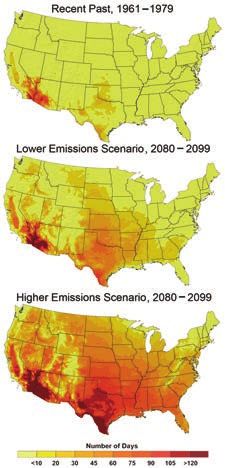
2 Climate Change and Extreme Heat Events

Overview
Extreme heat events pose a serious danger to people throughout the United States. Studies conducted by the
Centers for Disease Control and Prevention (CDC) have shown that exposure to extreme heat can increase
discomfort and fatigue, cause heat cramps, and increase emergency room visits and hospitalizations.1 It can
also kill. From 1999 through 2009, extreme heat exposure caused or contributed to more than 7,800 deaths
in the United States (Kochanek et al, 2011).

Extreme heat is a real danger to human health that will become worse with time. Experts project that as our
climate changes, extreme heat events in the United States will become more frequent, longer lasting, and
more severe.2,3 By the end of this century, extremely high temperatures that currently occur once every
20 years could happen as often as every two to four years.2

Learning about how to prepare for and respond to extreme heat events will help protect our
communities, especially the most vulnerable populations, from avoidable death and hardship.

This document
describes extreme                      RARE HEAT EVENTS WILL BECOME MORE COMMON
heat events, how
an extreme heat
event threatens
public health, and
how to prepare for
and respond to such
an event. It explains
how the frequency,
duration, and severity
of extreme heat
events are increasing
as a result of climate
change, and includes
links to local programs
and real-world
examples from across
the country.

                           By the end of this century, an extreme heat event that currently occurs
                           once every 20 years could occur every two to four years in most parts
                           of the country. This example is based on how the climate is expected
                           to change under a high greenhouse gas emissions scenario (A2; see
                           page 7 for a description of scenarios).2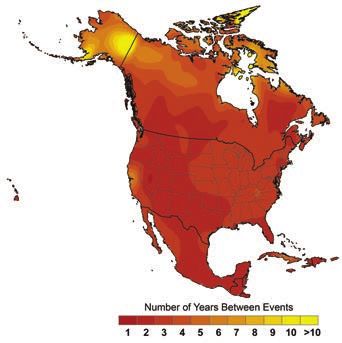
3

Understanding Extreme Heat Events
What Is an Extreme Heat Event?
While there is no single agreed upon definition of an extreme heat event, most definitions refer to an
extended period of time (several days or more) with unusually hot weather conditions that potentially can
harm human health.5

                                        The U.S. Environmental Protection Agency defines extreme
                                        heat events as “periods of summertime weather that are
                                        substantially hotter and/or more humid than typical for a given
                                        location at that time of year.”4

                                                     EXTREME HEAT EVENT: CHICAGO, JULY 1995

                              500                                                                                        110°

                              450                                                                                        105°
     NUMBER OF DAILY DEATHS

                              400                                                                                        100°

                                                                                                                                 TEMPERATURE (°F)
                              350                                                                                          95°

                              300                                                                                          90°

                              250                                                                                          85°

                              200                                                                                          80°

                              150                                                                                          75°

                              100                                                                                          70°
                                1-Jul        6-Jul         11-Jul           16-Jul          21-Jul          26-Jul    31-Jul
                                                                             DATE
                                                         Mortality, 1995     Mortality average, 1990-2000
                                                Daily max temp (°F), 1995    Daily max temp (°F) average, 1990-2000

   One of the most severe extreme heat events in recent U.S. history occurred in July 1995 in Chicago.
   During this event, the extended increase in daily maximum temperatures (black line) as compared
   to the average for 1990-2000 (blue line) had an estimated result of more than 650 deaths.3
4 Climate Change and Extreme Heat Events

Health Effects of Extreme Heat Events
                                                              DEATHS IN THE UNITED STATES ATTRIBUTED
Heat waves can be deadly. Extreme heat was the leading          TO WEATHER CONDITIONS, 2000–2009 6
cause of weather-related deaths in the United States             Winter Storm
from 2000 through 2009.6 From 1999 through 2009,                                    Cold
                                                                                             HEAT
extreme heat exposure caused more than 7,800 deaths             Lightning        7% 5%     24%
in the United States.2                                                      8%
                                                                 Wind 9%
In addition to deaths, extreme heat events cause a wide
range of other health problems such as rashes, cramps,                      11%             23%
heat exhaustion, and heat stroke. Extreme heat can also         Tornado              13%
make existing medical conditions worse. Though harder                                             Hurricane
to count than deaths, these health conditions affect far                         Flood
more people and lead to extra emergency room visits
and hospitalizations.3

                                   Extreme heat events are a
                                   problem around the world. For
                                   example, in 2003, an extreme
                                   heat event in Europe killed 14,800
                                   people in France alone.8

                        EXTREME HEAT EVENTS CAUSE A RANGE OF HEALTH PROBLEMS

                                                    Deaths

                                          Require medical attention:
                                                                        SE

                                         emergency room/emergency
                                                                          VE

                                          medical services, physician
                                                                            RIT

                                              office, clinic visit
                                                                                Y
                                                                               OF
                                                                                 EFF

                                   Heat cramps, heat exhaustion, heat stroke
                                                                                    EC
                                                                                       T

                                   Mild symptoms, discomfort, subtle effects
                                       (e.g., skin eruptions, heat fatigue)

                                 PROPORTION OF POPULATION AFFECTED
                  Extreme heat events cause health problems and can make other health problems
                  worse. Mild effects are more common, but in extreme cases, people can die.7
5

Vulnerability to Extreme Heat Events

Everyone should take steps
                                                     CERTAIN CHARACTERISTICS INCREASE RISK
to protect themselves and their                          FROM EXTREME TEMPERATURES
families’ health during an extreme                                               AL CHARACTERIST
                                                                        INDIVIDU                ICS
heat event, but some people are
                                                                          Youth       Advanced age
more vulnerable than others.                                          (age 0-4 years)  (65+ years)
Young children, people aged 65                         Physical impairments
                                                                                                                  Poverty

and older, persons with certain                      Cognitive
                                                                                                                      Use of certain
                                                                                                                       prescription
                                                   impairments
disabilities, those living in poverty                                                                                  medications

or social isolation, and the                  Social isolation
                                               (“shut-ins”)                                                                 Homelessness
                                                                        INCREASE IN HEALTH RISK
homeless have a much higher risk             Limited community         DURING EXTREME HEAT EVENT                        Lack of access to
of heat-related health problems                 partnerships                                                              air-conditioned
                                                                                                                        locations/shelters
than other people living in a                   Elevated crime rate
                                                                                                                    No extreme heat
population.4,9,10,11                                      Increase in paved                                          event program
                                                        surface areas and loss                   Poor/inappropriate
                                                         of native vegetation                   housing construction
If current population trends                                                     Urban heat
                                                                                   island
continue, the number of                                               COMM
                                                                             U N ITY C H A R A C TE RI S TI C S
vulnerable Americans aged 65
and older will continue to grow.2       Certain personal and community characteristics increase the risk of
In addition, the number of              experiencing health problems during an extreme heat event.4,9,10,11
people living in urban areas may
continue to increase exposing
more vulnerable individuals in
                                           URBAN HEAT ISLANDS: MAKING A BAD SITUATION WORSE
the future to the “urban heat                   CERTAIN CHARACTERISTICS INCREASE RISK
island” effect (see figure at                        FROM EXTREME TEMPERATURES
right).2 Changes in health care,
transportation patterns, and
urban design could either increase
or decrease the risk, but these
changes are harder to predict than
population trends.

                                        Cities can be up to 10°F warmer than surrounding rural areas and can
                                        maintain warmer temperatures throughout the night. Concrete and
                                        asphalt in cities absorb and hold heat. Tall buildings reduce potentially
                                        cooling air flows. Urban environments may lack trees and other
                                        vegetation that provide shade and increase cooling through evaporation.
                                        As a result, city-dwellers may experience longer and more severe
                                        periods of extreme heat compared to rural or suburban dwellers.2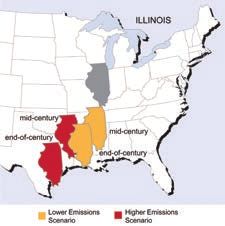
6 Climate Change and Extreme Heat Events

Climate Change and Extreme Heat Events
Climate Change and
a Warming World
The Earth is getting warmer because
people are adding greenhouse gases,
such as carbon dioxide and methane,
to the atmosphere. Most of these
gases are being released as a result
of burning fossil fuels like coal, oil,
and natural gas. As these gases build
up in the atmosphere, they trap extra
heat and cause average temperatures
to increase—a process called global
warming.2,3,13 Warmer temperatures
lead to many other changes in the
atmosphere, on land, and in the
oceans. Together, these changes are
known as climate change.

Average temperatures around the
world have become warmer since the
start of the 20th century, and they
have risen at a particularly fast rate
during the last 50 years. Nine of the
ten warmest years on record have
occurred since 2000.14                                RATE OF TEMPERATURE CHANGE IN THE
                                                            UNITED STATES, 1901–2008
Like the rest of the world, the United
States has become warmer. The U.S.
average temperature has risen more
than 2.0°F over the past 50 years,
and it is projected to rise more in the
future.2 Some parts of the country
have experienced more warming than
others (see figure).

                                           Since the early 20th century, average air temperatures have
                                           changed by different amounts in different parts of the United
                                           States.12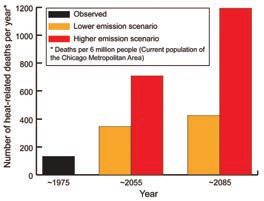
7

Future Climate Change
Scientists expect the Earth to keep getting warmer               Because it is difficult to project
in the years ahead. Their projections are based on
                                                                 far-off future emissions and other
past and current observations, trends in greenhouse
                                                                 human factors that influence
gas emissions, and computer models that show how
                                                                 climate, scientists use a range
additional greenhouse gases in the atmosphere will
                                                                 of emissions scenarios using
affect average climate conditions in different parts
of the world. Climate models project a continued
                                                                 various assumptions about future
increase in the Earth’s average temperature over                 economic, social, technological,
time. The amount of warming depends on the time                  and environmental conditions.
period under consideration, and the greenhouse gas
emissions scenarios (see box below).

             PROJECTED CHANGES IN GLOBAL AVERAGE TEMPERATURES FOR DIFFERENT
                          GREENHOUSE GAS EMISSIONS SCENARIOS

 Scientists have modeled future temperature changes based on a variety of greenhouse gas emissions
 scenarios. Each scenario is based on a set of assumptions about population trends, economic development,
 and technology—all of which affect the amount of greenhouse gases emitted over time.15 The figure shows the
 best estimate (solid line) and likely range (shaded area) of how much temperature will have changed at different
 points in time relative to the 1960–1979 average for emissions scenarios cited in various graphics throughout
 this publication.2,17
8 Climate Change and Extreme Heat Events
Extreme Heat Events Will Become More Frequent and More Severe
Scientists expect climate change
EXTREME HEAT EVENTS WILL BECOME MORE SEVERE
to lead to longer, more severe,
and more frequent extreme heat
events. Even using different INCREASE IN AVERAGE TEMPERATURE
climate models and emissions
Probability of Occurrence
scenarios, the results generally
point to extreme heat events
becoming worse in almost every More hot
weather
regard.2,3
Less cold
weather More record
Duration hot weather
Increases in average temperatures
are projected to make extreme
heat events last longer. Under
When average temperatures increase, the average temperature of “hot
an emissions scenario in which weather” and “record hot weather” will become even hotter.16
average temperatures have risen
6.3°F (IPCC A2 scenario), most
Americans could expect to see
extreme heat events lasting 10 to 20
days longer than in the past CLIMATE CHANGE PROJECTIONS GREATLY
INCREASE NUMBER OF HOT AND EXTREMELY
(see page 9 first figure).3 HOT DAYS ANTICIPATED FOR BOSTON
Severity
Another effect of higher average temperatures
is more severe heat events. The likelihood of more
hot weather and more record hot weather increases
as average temperatures increase (see upper right
figure).16 The box on the top of page 10 provides
examples of how climate is projected to change
in the United States. This particular study modeled
how summertime temperatures in New Hampshire
and Illinois could feel in the future. Under the
higher emissions scenario, by the late part of
this century, people in New Hampshire would
experience a summer climate close to the current The chart shows model projections of the number of
summer days with temperatures greater than 90°F
norm for North Carolina, while those in Illinois
in Boston, Massachusetts, under lower and higher
would experience a climate like that currently emissions scenarios. The inset shows projected days
experienced in Louisiana or Texas. with temperatures greater than 100°F.2,17
Frequency
Climate change will also cause extreme heat events
to happen more often. Studies show that by the end of this century, the number of days with temperatures
reaching 100°F or more is projected to increase dramatically across the United States as a result of climate
change. What the public now considers to be an exceptional event could become routine across much of the
country (see page 9 second figure).29
EXTREME HEAT EVENTS WILL LAST LONGER CLIMATE CHANGE PROJECTED TO INCREASE
THE NUMBER OF 100°F DAYS
Days
19.5
18
16.5
+ 1.8°F 15
13.5
12
10.5
9
+ 3.6°F 7.5
6
4.5
3
1.5
+ 6.3°F
When average temperatures increase, the longest
extreme heat events (here, defined as the longest event
occurring in a 20-year period) will become even longer
than in the past (1961–1979). In the warmest scenario,
most of the country would experience an increase
in its longest extreme heat event of 10-20 days.3
Whether using a lower or higher emissions
scenario, the number and distribution of days
per year over 100°F are expected to increase
dramatically.2,1710 Climate Change and Extreme Heat Events
CLIMATE ON THE MOVE: CHANGING SUMMERS IN NEW HAMPSHIRE AND ILLINOIS
Yellow arrows track what summers are projected to feel like under a lower emissions scenario, while red
arrows track projections for a higher emissions scenario.2,17
Projected Health Effects of Extreme Heat Events in the Future
As temperatures rise and extreme heat events become longer, more severe, and more frequent, experts expect
to see more health problems and deaths caused by heat. Researchers have looked at a variety of scenarios and
models, and consistently have reached the
same conclusions: PROJECTED INCREASE IN HEAT-RELATED
DEATHS IN CHICAGO
• With climate change, the number
of deaths due to extreme heat is expected
to keep increasing over time.
• Higher emissions scenarios project
a more dramatic rise in heat-related
deaths over time.
These projections are not precise. For
example, they assume that the death rate
associated with a particular level of extreme
heat (such as a 100°F day in Chicago) will
be similar to the patterns observed in the
past. But if the relationship between heat and
death rates changes in the future, the expected
number of deaths might increase or decrease.
For example, people might get more used Heat-related deaths are projected to increase in Chicago
to extreme heat and communities might plan during the 21st century. This graph shows the projected
and prepare for heat more effectively. Changes number of deaths per year, averaged over a three-decade
period around 1975, 2055, and 2085, under two emissions
in demographics could also affect the number
scenarios. This analysis included some measures to adapt
of heat related deaths. to the increased heat.2,1711
Responding to Extreme Heat Events
Extreme Heat Programs: ELEMENTS OF AN EFFECTIVE EXTREME HEAT PROGRAM
Working to Protect Public
Health • A written and publicly approved program plan that
identifies program partners and vulnerable populations
Many of the negative health effects
• Clear criteria that define extreme heat events and help
attributable to extreme heat events
to evaluate weather forecasts and conditions
are preventable.1,11 Many cities
throughout the United States and • Coordinated outreach to public and partners, with
abroad have successfully developed consistent messaging, information, and instructions via
and deployed extreme heat programs public broadcast, websites, email, and social media
over the past 30 years, protecting
• Strategic action plans that include formal check-in and
public health and saving lives.1,11 The
buddy systems and in-person assessments for vulnerable
most effective programs incorporate persons
a variety of elements, which are found
in federal recommendations and • Strategies and recommendations for staying cool at home
can be adapted according to local and work
conditions and needs.4,10 Protecting
• Designated public cooling shelters
the public from extreme heat events
also can be part of a broader process • Cancellation policies for outdoor activities and events
of planning for natural hazards and
• Post-season reviews of program performance by partners
disaster preparedness. These efforts
require engaging many of the same • Public input on ways to improve the program
stakeholders, affect many of the same
vulnerable populations, and call for
similar types of public outreach and
education.
How Do Extreme Heat Programs Perform?
Ideally, public health officials would evaluate the effectiveness of extreme heat programs and quantify the
number of lives saved. In reality, though, it can be difficult to judge a program’s performance, as its elements
change over time and the number and nature of extreme heat events vary from year to year. As a result, few
extreme heat programs in the United States have been studied in depth to determine if they are truly effective.
However, the limited number of studies that have taken place have concluded that extreme heat programs save
lives.3,18
Developing and implementing extreme heat programs does not have to cost a lot of money.4 Given the
potential to save many lives for a relatively small cost, communities may benefit from establishing extreme
heat programs as an adaptive response to the very real threat that climate change poses.12 Climate Change and Extreme Heat Events
KANSAS CITY, MISSOURI: 30 YEARS OF EXTREME HEAT PROGRAM
EXPERIENCE
Kansas City developed its extreme heat program after a heat event in July,
1980, which caused a number of deaths in the metropolitan area.
Kansas City’s program relies on numerous partnerships to help identify people
at risk and coordinate services. The Kansas City Health Department is the lead
agency for the city’s extreme heat program. As such, the Health Department:
• Assists the National Weather Service in determining whether to issue
heat-health notifications and notifies other program partners of extreme
heat decisions.
• Coordinates extreme heat-related response activities.
• Develops and coordinates extreme heat-related public messaging, media,
and communication strategies.
• Collects and summarizes information on the health impacts of extreme
heat and interventions undertaken during specific events.
• Suggests improvements to health surveillance systems.
The Kansas City Health Department also coordinates pre-season and end-
of-season meetings with partners to review community plans and evaluate
performance. At these meetings, the Health Department and its partners
can consider recruiting additional partners to help serve difficult-to-reach
high-risk segments of the population, such as the elderly, “shut-ins,” and the
homeless.
Over time, the Health Department’s role has shifted from providing assessment
and intervention services to its current role of declaring events, coordinating
partners, and managing public information and education efforts. This new
role keeps the program effective by leveraging partnerships to extend the
reach of information and services to the most vulnerable people during heat
events.13
Conclusion
More Extreme Heat Events Will Increase Need for Public Health Programs
Deaths and illnesses associated with extreme heat events will likely increase as more frequent, longer, and more
severe future extreme heat events occur. There is a clear need for enhanced recognition of the public health
challenges that future extreme heat events will pose.
Currently, effective programs offer hope that this health challenge can be met. Today, a wide range of creative
and resourceful partnerships in locations across the country address the challenges of extreme heat events.
As the earth continues to warm, public health officials will need to develop and implement extreme heat
programs that are flexible enough to manage under extraordinary conditions that will become increasingly
common.
Examples of materials that are available already for interested parties to incorporate in an extreme heat
program are provided below.
SPECIFIC GUIDANCE FOR RESPONDING TO EXTREME HEAT EVENTS
IS COMMON IN MANY EXTREME HEAT PROGRAMS
Many cities have developed specific tools to aid in the assessment of potential risk to populations during an extreme heat
event or to help with the response to these conditions. Source: Baltimore City Health Department, 2009.14 Climate Change and Extreme Heat Events
GENERAL GUIDANCE FOR CITIZENS TO REDUCE THEIR RISK FROM EHES
Extremely hot weather can cause
sickness or even death.
Heavy sweating STAY COOL. Stay in air-conditioned
Weakness buildings as much as possible and
Cold, pale, clammy skin avoid direct sunlight.
Fast, weak pulse
Nausea or vomiting STAY HYDRATED. Drink plenty of
water and don’t wait until you’re
Fainting thirsty to drink.
STAY INFORMED. Stay updated on
Seek medical care immediately if you have local weather forecasts so you can
or someone you know has symptoms plan activities safely when it’s hot
of heat sickness. Warning signs and outside.
symptoms vary but may include:
KNOW WHEN IT’S HOT!
High body temperature Sign up to receive free weather
(104°F or higher rectally) alerts on your phone or e-mails
Hot, red, dry or moist skin from www.weather.com/mobile
Rapid and strong pulse
Possible unconsciousness
Centers for Disease
Control and Prevention
National Center for
www.cdc.gov/nceh/extremeheat Environmental Health
CS215352
Check on the elderly, or people aged 65
years or older, to make sure they are safe eme heat even
t, check on FOR MORE INFORMATION
During an extr mily, and neighbors at
by staying cool, hydrated, and informed. , fa
at-risk friends Encourage them to:
day.
least twice a
bor, and
People with a chronic medical friend or neigh www.cdc.gov/
• Check on a th e same for you.
on e do
condition are less likely to sense and have some nceh/extremeheat
oven to cook.
respond to changes in temperature. Also, g the stove or
• Avoid usin
they may be taking medications that can light-colored
, lightweight,
intensify the • Wear loose
clothing.
WHO NEEDS SPECIAL CARE?
The elderly, people with a chronic medical condition,
children, homeless or poor, outdoor workers, and
athletes are most at-risk to heat sickness.
Athletes and people who exercise People who work outdoors are more
air-conditioned shelter to the homeless in extreme heat are more likely to become likely to become dehydrated and are more
or poor during times of extreme heat. dehydrated and are more likely to get heat likely to get heat sickness.
sickness.
• Drink from two to four cups of water
Never leave infants or
children in a parked car.
• Limit outdoor activity, especially mid-
day when it is the hottest part of the STOP every hour while working. Don’t wait
until you are thirsty to drink.
day. all activity and get
to a cool environ- • Avoid alcohol or liquids containing
Nor should pets be • Schedule workouts and practices
ment if you feel large amounts of sugar.
earlier or later in the day to avoid mid-
left in parked cars– faint or weak. • Wear and reapply sunscreen as
day heat.
they can indicated on the package.
• Pace activity. Start activities slowly and pick up
the pace gradually. • Ask if tasks can be scheduled for earlier or later
sickness too. in the day to avoid midday heat.
• Drink from two to four cups of water every hour
while exercising. Muscle cramping may be an
early sign of heat sickness.
Public health agencies are increasingly providing information on appropriate extreme heat event
responses. Source: CDC, 2011.15
Examples of Resources for Further extreme heat events-related Information
Understanding the Health Risks of Extreme Heat Events
Centers for Disease Control and Prevention: Heat Waves www.cdc.gov/climateandhealth/effects/heat.htm
National Weather Service: Heat Wave: A Major Summer weather.gov/os/brochures/heat_wave.shtml
Killer
National Weather Service Heat Safety weather.gov/om/heat/index.shtml
Excessive Heat – NOAAWatch noaawatch.gov/themes/heat.php
The Impact of Climate Change on Extreme Heat Eventss
globalchange.gov/publications/reports/scientific-
Global Climate Change Impacts in the United States assessments/us-impacts/full-report
U.S. Climate Change Science Program. Final Report,
globalchange.gov/publications/reports/scientific-
Synthesis and Assessment Product 4.6. Analyses of the Effects of
assessments/saps/sap4-6
Global Change on Human Health and Welfare and Human Systems
U.S. Climate Change Science Program. Final Report, globalchange.gov/publications/reports/scientific-
Synthesis and Assessment Product 3.3. Weather and assessments/saps/sap3-3
Climate Extremes in a Changing Climate
Climate Change Indicators in the United States epa.gov/climatechange/indicators.html
Guidance for Developing Extreme Heat Events Programs
Centers for Disease Control and Prevention: emergency.cdc.gov/disasters/extremeheat/
Extreme Heat: A Prevention Guide to Promote Your heat_guide.asp
Personal Health and Safety
Department of Health – United Kingdom: dh.gov.uk/en/Publicationsandstatistics/
Heatwave Plan for England: Protecting Health and Publications/PublicationsPolicyAndGuidance/
Reducing Harm from Extreme Heat and Heatwaves DH_114430
Health Canada: Developing Heat Resilient Communities hc-sc.gc.ca/ewh-semt/climat/adapt/
and Individuals in Canada heat-chaleur-eng.php
U.S. Environmental Protection Agency: epa.gov/heatisld/about/heatguidebook.html
Extreme Heat Events Guidebook
World Health Organization: Heat-Health Action Plans: euro.who.int/__data/assets/pdf_file/0006/95919/
Guidance E91347.pdf
Examples of Local Extreme Heat Program Resources
Baltimore City Health Department: baltimorehealth.org/coderedinfo.html
Code Red Heat Alert Information (homepage)
City of Boston: Helping the Homeless During Extremely Hot cityofboston.gov
Weather
City of Chicago: Emergency Management and
Communications: Weather Extremes – Extreme cityofchicago.org
Temperatures
City of Kansas City, Missouri: Heat Information kcmo.org/CKCMO/Depts/Health/Heatinformation/
City of Phoenix Salvation Army: Heat Relief Response:
The Salvation Army Emergency Disaster Heat Emergency usw.salvationarmy.org
Response
City of San Jose, California: Heat Wave Response sanjoseca.gov
City of Toronto: Hot Weather Response Plan toronto.ca/health/heatalerts/beatheat_program.htm
New York City Office of Emergency Management: nyc.gov/html/oem/html/hazards/heat.shtml
NYC Hazards: Extreme Heat
St. Louis, Missouri: Operation Weather Survival crh.noaa.gov/lsx/?n=ows
Washington, D.C: Heat program resources (homepage) dcema.dc.gov
U.S. EPA: Heat Island Effect epa.gov/heatislands16 Climate Change and Extreme Heat Events
References
1 CDC. 2009a. Extreme Heat: A Prevention Guide to Promote Your Personal Health and Safety. Centers for
Disease Control and Prevention. Available: http://www.emergency.cdc.gov/disasters/extremeheat/heat_guide.asp.
Accessed February 3, 2011.
2 Karl, T.R.,J.M. Melillo, and T.C. Peterson (eds.). 2009. Global Climate Change Impacts in the United States.
Cambridge University Press, New York.
3 National Research Council. 2011. Climate Stabilization Targets: Emissions, Concentrations, and Impacts over
Decades to Millennia. Washington, DC: National Academies Press.
4 U.S. EPA. 2006. Excessive Heat Events Guidebook. EPA 430-B-06-005. U.S. Environmental Protection Agency,
Washington, DC.
5 Hayhoe, K., D. Cayan, C.B. Field, P.C. Frumhoff, E.P. Maurer, N.L. Miller, S.C. Moser, S.H. Schneider, K.N.
Cahill, E.E. Cleland, L. Dale, R. Drapek, R.M. Hanemann, L.S. Kalkstein, J. Lenihan, C.K. Lunch, R.P. Neilson,
S.C. Sheridan, and J.H. Verville. 2004. Emissions pathways, climate change, and impacts on California. PNAS
101(34):12422–12427.
6 NOAA. 2010. Natural Hazard Statistics: Weather Fatalities. National Oceanic and Atmospheric Administration.
Available: http://www.weather.gov/om/hazstats.shtml. Accessed January 10, 2011 – data adapted for presentation.
7 Bassil, K., D.C. Cole, K. Smoyer-Tomic, and M. Callaghan. 2007. What Is the Evidence on Applicability and
Effectiveness of Public Health Interventions in Reducing Morbidity and Mortality During Heat Episodes? A
Review for the National Collaborating Centre for Environmental Health. April 30. Vancouver, BC. – original
figure adapted.
8 Confalonieri, U., B. Menne, R. Akhtar, K.L. Ebi, M. Hauengue, R.S. Kovats, B. Revich, and A. Woodward. 2007.
Human health. In Climate Change 2007: Impacts, Adaptation and Vulnerability. Contribution of Working Group
II to the Fourth Assessment Report of the Intergovernmental Panel on Climate Change.
9 Basu, R. and J.M. Samet. 2002. Relation between elevated ambient temperature and mortality: A review of the
epidemiologic evidence. Epidemiologic Reviews 24(2):190–202.
10 Matthies, F., G. Bickler, N.C. Marin, and S. Hales (eds.). 2008. Heat-Health Action Plans: Guidance. World
Health Organization, Copenhagen.
11 CDC. 2009b. Heat Waves. Centers for Disease Control and Prevention. Available: http://www.cdc.gov/
climatechange/effects/heat.htm. Accessed November 11, 2010.
12 U.S. EPA. 2010. Climate Change Indicators in the United States. EPA 430-R-10-007. U.S. Environmental
Protection Agency, Washington, DC.
13 IPCC. 2007. Summary for Policymakers. Climate Change 2007: The Physical Science Basis. Contribution of Working
Group I to the Fourth Assessment Report of the Intergovernmental Panel on Climate Change, S. Solomon, D. Qin, M.
Manning, Z. Chen, M. Marquis, K.B. Averyt, M. Tignor, and H.L. Miller (eds.). Cambridge University Press,
Cambridge, UK.
14 NOAA. 2011. State of the Climate, Global Analysis: Annual 2010. National Oceanic and Atmospheric
Administration. Available: http://www.ncdc.noaa.gov/sotc/global/2010/13. Accessed March 13, 2011.
15 IPCC. 2000. IPCC Special Report, Emissions Scenarios: Summary for Policy Makers. A Special Report
of IPCC Working Group III.
16 IPCC. 2001. Climate Change 2001: Synthesis Report. A Contribution of Working Groups I, II, and III to the Third
Assessment Report of the Intergovernmental Panel on Climate Change, R.T. Watson and the Core Writing Team
(eds.). Cambridge University Press, Cambridge, UK.
17 The lower emissions scenario = B1; the higher emissions scenario = A2.
18 Ebi, K.L., T.J. Teisberg, L.S. Kalkstein, L. Robinson, and R.F. Weiher. 2004. Heat watch/warning systems save lives:
Estimated costs and benefits for Philadelphia 1995–98. Bulletin of the American Meteorological Society 85(8):1067–
1073.CS237796-A
You can also read