Barclays Americas Select Conference 2018 - John F. Woods Chief Financial Officer May 15, 2018 - Investor Relations

Page created by Roland Ayala
 
CONTINUE READING
Barclays Americas Select Conference 2018 - John F. Woods Chief Financial Officer May 15, 2018 - Investor Relations
Barclays Americas Select Conference 2018

John F. Woods
Chief Financial Officer

May 15, 2018
Barclays Americas Select Conference 2018 - John F. Woods Chief Financial Officer May 15, 2018 - Investor Relations
Forward-looking statements and use of key performance metrics and non-GAAP financial measures
This document contains forward-looking statements within the Private Securities Litigation Reform Act of 1995. Statements regarding potential future share repurchases and future dividends are forward-looking statements.
Also, any statement that does not describe historical or current facts is a forward-looking statement. These statements often include the words “believes,” “expects,” “anticipates,” “estimates,” “intends,” “plans,”
“goals,” “targets,” “initiatives,” “potentially,” “probably,” “projects,” “outlook” or similar expressions or future conditional verbs such as “may,” “will,” “should,” “would,” and “could.”
Forward-looking statements are based upon the current beliefs and expectations of management, and on information currently available to management. Our statements speak as of the date hereof, and we do not assume
any obligation to update these statements or to update the reasons why actual results could differ from those contained in such statements in light of new information or future events. We caution you, therefore, against
relying on any of these forward-looking statements. They are neither statements of historical fact nor guarantees or assurances of future performance. While there is no assurance that any list of risks and uncertainties or
risk factors is complete, important factors that could cause actual results to differ materially from those in the forward-looking statements include the following, without limitation:
       Negative economic and political conditions that adversely affect the general economy, housing prices, the job market, consumer confidence and spending habits which may affect, among other things, the level of
         nonperforming assets, charge-offs and provision expense;
       The rate of growth in the economy and employment levels, as well as general business and economic conditions, and changes in the competitive environment;
       Our ability to implement our business strategy, including the cost savings and efficiency components, and achieve our financial performance goals;
       Our ability to meet heightened supervisory requirements and expectations;
       Liabilities and business restrictions resulting from litigation and regulatory investigations;
       Our capital and liquidity requirements (including under regulatory capital standards, such as the U.S. Basel III capital rules) and our ability to generate capital internally or raise capital on favorable terms;
       The effect of changes in interest rates on our net interest income, net interest margin and our mortgage originations, mortgage servicing rights and mortgages held for sale;
       Changes in interest rates and market liquidity, as well as the magnitude of such changes, which may reduce interest margins, impact funding sources and affect the ability to originate and distribute financial
         products in the primary and secondary markets;
       The effect of changes in the level of checking or savings account deposits on our funding costs and net interest margin;
       Financial services reform and other current, pending or future legislation or regulation that could have a negative effect on our revenue and businesses, including the Dodd-Frank Act and other legislation and
         regulation relating to bank products and services;
       A failure in or breach of our operational or security systems or infrastructure, or those of our third party vendors or other service providers, including as a result of cyber-attacks; and
       Management’s ability to identify and manage these and other risks.
In addition to the above factors, we also caution that the amount and timing of any future common stock dividends or share repurchases will depend on our financial condition, earnings, cash needs, regulatory constraints,
capital requirements (including requirements of our subsidiaries), and any other factors that our Board of Directors deems relevant in making such a determination. Therefore, there can be no assurance that we will
repurchase shares or pay any dividends to holders of our common stock, or as to the amount of any such repurchases or dividends.
More information about factors that could cause actual results to differ materially from those described in the forward-looking statements can be found under “Risk Factors” in our Annual Report on Form 10-K for the year
ended December 31, 2017, filed with the United States Securities and Exchange Commission on February 22, 2018.

Key Performance Metrics and Non-GAAP Financial Measures and Reconciliations
Key Performance Metrics:
Our management team uses key performance metrics (KPMs) to gauge our performance and progress over time in achieving our strategic and operational goals and also in comparing our performance against our peers. We
have established the following financial targets, in addition to others, as KPMs, which are utilized by our management in measuring our progress against financial goals and as a tool in helping assess performance for
compensation purposes. These KPMs can largely be found in our periodic reports which are filed with the Securities and Exchange Commission, and are supplemented from time to time with additional information in
connection with our quarterly earnings releases.
Our key performance metrics include:
           Return on average tangible common equity (ROTCE);
           Return on average total tangible assets (ROTA);
           Efficiency ratio;
           Operating leverage; and
           Common equity tier 1 capital ratio.

In establishing goals for these KPMs, we determined that they would be measured on a management-reporting basis, or an operating basis, which we refer to externally as “Adjusted” or “Underlying” results. We believe that
these “Adjusted” or “Underlying” results provide the best representation of our financial progress toward these goals as they exclude items that our management does not consider indicative of our ongoing financial
performance. KPMs that contain “Adjusted” or “Underlying” results are considered non-GAAP financial measures.
Non-GAAP Financial Measures:
This document contains non-GAAP financial measures. The appendix presents reconciliations of our non-GAAP measures. These reconciliations exclude “Adjusted” or “Underlying” items, which are included, where
applicable, in the financial results presented in accordance with GAAP. “Adjusted” or “Underlying” results, which are non-GAAP measures, exclude certain items, as applicable, that may occur in a reporting period which
management does not consider indicative of on-going financial performance.
The non-GAAP measures presented in the appendix include reconciliations to the most directly comparable GAAP measures and are: “noninterest income”, “total revenue”, “noninterest expense”, “pre-provision
profit”, “total credit-related costs”, “income before income tax expense”, “income tax expense”, “effective income tax rate”, “net income”, “net income available to common stockholders”, “other income”, “salaries and
employee benefits”, “outside services”, “amortization of software expense”, “other operating expense”, “net income per average common share”, “return on average common equity” and “return on average total assets”.
We believe these non-GAAP measures provide useful information to investors because these are among the measures used by our management team to evaluate our operating performance and make day-to-day operating
decisions. In addition, we believe our “Adjusted” or “Underlying” results in any period reflect our operational performance in that period and, accordingly, it is useful to consider our GAAP results and our “Adjusted” or
“Underlying” results together. We believe this presentation also increases comparability of period-to-period results.
Other companies may use similarly titled non-GAAP financial measures that are calculated differently from the way we calculate such measures. Accordingly, our non-GAAP financial measures may not be comparable
to similar measures used by other companies. We caution investors not to place undue reliance on such non-GAAP measures, but instead to consider them with the most directly comparable GAAP measure. Non-GAAP
financial measures have limitations as analytical tools, and should not be considered in isolation, or as a substitute for our results as reported under GAAP.
                                                                                                                                                                                                                                 2
Barclays Americas Select Conference 2018 - John F. Woods Chief Financial Officer May 15, 2018 - Investor Relations
Solid franchise with leading positions in attractive markets

                                                                                                                                                                                                                      Franchise highlights
                                                                                                                                                                                                Top 5 deposit market share in 9 of
                                                                                                                                                                                                       our 10 largest MSAs(1)

                                                                                                                                                                                                #2 deposit market share in
                                                                                                                                                                                                       New England(2)

                                                                                                                                                                                                Top 5 rank HELOC in 9/9 markets(3)

                                                                                                                              CFG corporate headquarters
                                                                                                                                                                                                Top 4 rank in Education(4)
                                                                                                                              Providence, RI
                                                                                                                              CFG branch location
                                                                                                                              CFG non-branch location
                                                                                                                                                                                                Ranked #7 Overall Middle Market
                                                                                                                                                                                                       lead/joint lead bookrunner(5)
     $ Billions

                    Assets                                                    Deposits                                                            Loans                                         Consumer customer experience
                                                                                                                                                                                                       ranked #1 among banks(6)
                     $153.5                                                        $115.7                                                         $111.4
                   Rank #13                                                      Rank #11                                                       Rank #12                                        Top 2 Box Score and overall
                                                                                                                                                                                                       commercial customer satisfaction
                                                                                                                                                                                                       rating of 94%(7)
Note: Period-end balances as of March 31, 2018, loan balances exclude loans held for sale. Ranking based on 4Q17 data, unless otherwise noted; excludes non-retail depository institutions, includes U.S. subsidiaries of foreign banks.
1) Source: FDIC, June 2017. Excludes “non-retail banks” as defined by SNL Financial. The scope of “non-retail banks” is subject to the discretion of SNL Financial, but typically includes: industrial bank and non-depository trust charters, institutions with more than 20% brokered deposits (of total deposits),
   institutions with more than 20% credit card loans (of total loans), institutions deemed not to broadly participate in the banking services market and other non-retail competitor banks.
2) Source: FDIC June 2017 and SNL Financial. Top MSAs determined by retail branch count. Branches with ≥$500 million in deposits excluded. Excludes “non-retail banks” as defined by SNL Financial. The scope of “non-retail banks” is subject to the discretion of SNL Financial, but typically includes: industrial
   bank and non-depository trust charters, institutions with more than 20% brokered deposits (of total deposits), institutions with more than 20% credit card loans (of total loans), institutions
3) According to Equifax; origination volume as of 4Q17.
4) CFG estimate, based on published company reports, where available; private student loan origination data as of 1Q18.
5) Thomson Reuters LPC, Loan syndication league table ranking for the prior twelve months as of 1Q18 based on number of deals for Overall U.S. Middle Market (defined as Borrower Revenues < $500 million and Deal Size < $500 million).
6) 2018 Temkin Experience Rating, U.S. March 2018.
7) Barlow Research 2017 Voice of the Customer Survey (Top 2 Box Score).                                                                                                                                                                                                                                                 3
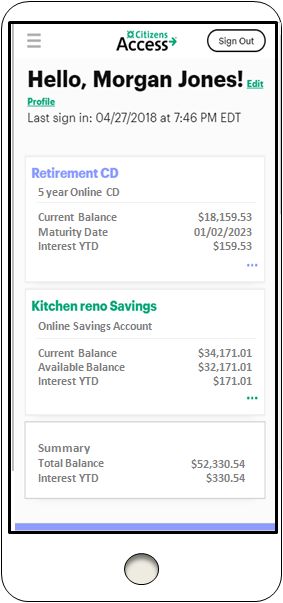
Barclays Americas Select Conference 2018 - John F. Woods Chief Financial Officer May 15, 2018 - Investor Relations
Business Overview

                                  Consumer                                                                Loans and Leases                                        Commercial
                                  In Footprint                                                             $111.4 billion(2)                                          National
  Retail Deposit Services                                                                                                                           Coverage
  Mobile/Online Banking                                                                                                                              Commercial & Industrial Banking
                                                                                                            55%
  Mortgage(1)                                                                                                                           45%          Commercial Real Estate

  Home Equity Loans/Lines                                                                                                                            Corporate Verticals

  Wealth Management                                                                                                                                      ─   Healthcare
                                                                                                                                                          ─   Technology
  Business Banking                                                                                            Deposits
                                                                                                            $115.7 billion(2)                             ─   Oil & Gas
  PERL(1)                                                                                                                                                ─   Franchise Finance
                                      National                                                                                                       Products
                                                                                                               72%
  Auto                                                                                                                                               Core, Equipment & Asset Based Lending
  Education Finance                                                                                                                                  Capital Markets
                                                                                                                                      28%
  Unsecured                                                                                                                                          Global Markets

                                                                                                                                                      M&A Advisory
                                                                                                       Consumer                         Commercial
                                                                                                                                                      Treasury Payment Solutions

Note: Period-end balances as of March 31, 2018 excludes held for sale.
1) Includes select originations outside the traditional branch banking footprint.
2) Consumer/Commercial deposit and loan mix percentages exclude non-core loans and leases of $2.6 billion and deposits of $7.1 billion in Other.                                          4
Barclays Americas Select Conference 2018 - John F. Woods Chief Financial Officer May 15, 2018 - Investor Relations
Strong execution and consistent progress
                                           Entering a new phase focused becoming a top-performing bank

                                                    ROTCE(1)                                                 Medium-term                                                 Efficiency ratio(1)                                Medium-term
                       (Return on average tangible common equity)                                               target                                                                                                         target

                                                                                                                  ~13-15%                                                                                                    mid-50%’s
                                                                                                                                             68.5%            68.7%
                                                                                                                                                                              67.6%
                                                                               12.3%           11.7%
                                                                                                                                                              68.1%                           63.9%
                                                                                                                                                                              66.5%
                                                                7.7%
                               6.7%            6.7%                             9.8%                                                                                                          63.8%            60.9%     60.4%
               4.3%                                             7.6%
                               6.1%            6.4%                                                                                                                                                            60.0%

              3Q13 (2) 2014                    2015            2016             2017            1Q18                                          3Q13 (2) 2014                    2015            2016             2017     1Q18
                                                      CET1        (4)
                                                                                                             Medium-term                                                               EPS      (1)

                                     (Common equity tier 1 ratio)                                               target                                                            (Diluted EPS)                          $3.44
                                                                                                                                                                                                                $3.25
              13.9%
                              12.4%                                                                                                                                                                                       FY18
                                               11.7%           11.2%           11.2%           11.2% ~10.0-10.25%
                                                                                                                                                                                                $1.97                   consensus
                                                                                                                                                                               $1.61                            $2.58
                                                                                                                                                               $1.55
                                                                                                                                               $1.04                                            $1.93
                                                                                                                                                               $1.42           $1.55                                     $0.78

               3Q13 (2) 2014                   2015             2016            2017            1Q18                                       3Q13 (2,3) 2014                      2015            2016            2017     1Q18
                                                                                                                                        annualized

                       Outlook remains positive to drive continued improvement for all stakeholders
            Reported results                              Adjusted/Underlying results (1)
1) Please see important information on Key Performance Metrics and Non-GAAP Financial Measures at the end of this presentation for an explanation of our use of these metrics and non-GAAP financial measures and
   their reconciliation to GAAP financial measures. Where there is a reference to “Adjusted”, “Underlying” or “Adjusted/Underlying” results in a paragraph, all measures that follow these references are on the same
   basis, when applicable. CAGR is calculated from annualized 3Q13-2017.
2) Commencement of separation effort from RBS.
3) Earnings per share for 3Q13 is the annualized calculation of earnings per share of $0.26 multiplied by 4.
4) Common equity tier 1 ("CET1") capital under Basel III replaced tier 1 common capital under Basel I effective January 1, 2015.                                                                                                          5
How we will stand out from the competition

                  Customer-centric focus reflecting:
                    Expertise and deep knowledge of customers
     Strong
                    High-quality advice
     Culture        Team approach
                    Insights from data analytics

                   Selective in how and where we play
   Operating &     Seeking to self-fund investments through efficiency enhancements; mindset of
    Financial       continuous improvement
    Discipline     Utilizing new technologies to deliver more effective outcomes at lower costs
                   Good stewards of our capital

                  Consumer                    Commercial
                    Banking products           Quality coverage bankers
  Excellence in     Wealth advice              Capital and global markets
    key areas       Data analytics             Treasury solutions
                    Personalized solutions     Team-based approach
                    Business partnering

                                                                                                   6
Medium-term targets

                                                      Medium-term ROTCE outlook
                                                                                                                                                                                       Medium-term targets

                                                                                             ~1.3%               ~(0.8)%                                                                     ROTCE ~13-15%
                                                                       ~0.6%                                                          ~(1.1)%
                                                  ~1.5%
                             ~2.5%
                                                                                                                                                                                  Efficiency ratio mid-50%’s
                                                                                                                                                             ~14%
        ~10%                                                                                                                                                                             CET1 ~10.0-10.25%

      FY 17
                 (1)                       (2)
                        Revenue net Yield curve                      Efficiency              Taxes             Credit     Capital net Medium-term
                                                                                                                                                    (3)
                                                                                                                                                                                  Dividend
    Underlying          of required   impact                         Initiatives                            normalization              FY target                                                                    ~35-40%
                                                                                                                                                                                  payout ratio
                        investment

                                                                                         Operational assumptions

       Loan growth target of ~nominal GDP +1%                                                                              Expect to continue to pursue formal efficiency
                                                                                                                                 initiatives to fund expanded strategic investments
       Asset sensitivity moderates as rates normalize
                                                                                                                            CET1 ratio annual reduction of ~30-40 bps
       Operating leverage target of ~3-5%
                                                                                                                            Initial benefit of tax reform declines modestly
                                                                                                                                 with time

Note: Medium-term financial targets assume real GDP growth of ~2.5–3.0% annually with no recession, increase in fed funds rate with ~2.25 bps rate moves per annum (25 bps each move), and unemployment rate ~3.5-4.0%.
1) Please see important information on Key Performance Metrics and Non-GAAP Financial Measures at the beginning and end of this presentation for an explanation of our use of these metrics and non-GAAP financial measures and their
   reconciliation to GAAP financial measures. Where there is a reference to “Adjusted”, “Underlying” or “Adjusted/Underlying” results in a paragraph, all measures that follow these references are on the same basis, when applicable.
2) Includes volume driven credit costs unrelated to credit normalization.
3) Capital net includes the impact of risk-weighted asset growth net of targeted capital actions: retained earnings growth of ~(3.0)% partially offset by common stock repurchases of ~1.5% and the impact of rising rates on other
   comprehensive income of ~0.4%.                                                                                                                                                                                                         7
Keys to delivering higher medium-term returns
    Tapping Our
      Potential        Enterprise-wide initiatives to drive improvement in performance
    (“TOP”) and          — Rigorous efficiency program to allow self-funding of investments
   Balance Sheet         — Recycle capital into more accretive growth and relationship categories; grow
   Optimization             higher risk-adjusted return asset portfolios, optimize deposit
      (“BSO”)

                    Consumer
                     Grow and deepen primary household relationships
                     Wealth – Leverage investments in FCs and sales, product and technology platforms

   Drive growth      Mortgage – Channel and product remix toward direct-to-consumer and conforming;
                      purchase MSRs to increase scale economies
       in fee
    businesses      Commercial
                     Continue to broaden Capital Markets capabilities; leverage new Global Markets
                      platform and capabilities
                     Treasury – Replatform cash management; capture value from recent product
                      investments

   Active capital      Prudently grow balance sheet while driving strong returns of capital
   management           to shareholders

     Capture
      asset            Leverage asset sensitivity to benefit as rates rise
    sensitivity

                                                                                                          8
Opportunities to improve returns: TOP programs

               Current TOP program targeting run-rate pre-tax benefit of
                          ~$95-$110 million by end of 2018

               Revenue initiatives                            Efficiency initiatives
                        (examples)                                      (examples)

      New channels: Digital as a sales engine,       Organization simplification: Spans and
       direct to consumer mortgage, call center        layers, centralization/ centers of excellence,
       ‘service to solutions’                          role clarity
      Expanding into growth areas: Corporate         Lean/Process improvement: Redesigning
       partnerships, Commercial growth markets         end-to-end processes and leveraging
      Build-out fee income and broader                automation
       capabilities: M&A advisory, Commercial asset-  Customer journeys (revenue + efficiency):
       backed finance, MSR purchases                   Simplifying and streamlining external
                                                       customer-centric processes

                                                                                                        9
BSO: Rigorous program to improve returns while driving growth
       1Q18 YoY NIM expansion of 20 bps reflects 7 bps contribution from BSO efforts
                    Assets                                   Liabilities
  Investment portfolio                                  Deposits
     Reinvest to support liquidity                       Optimize deposit loan mix with a focus
     Cash collateral management                           on lower-cost categories
  Loan portfolio
    Reposition/optimize loan mix across categories  Borrowings
      ─ Improve returns while maintaining relatively   Normalize funding profile
        stable stress losses
    Reallocate capital within loan categories with a
     focus on deepening relationships
       ─ Refine appetite for credit-only and out-of-
          footprint relationships
                                                 Actions
    Consumer                                            Utilize data and analytics and expanded product
    — Grow education & unsecured                           sets to mitigagte competitive pricing dynamics
    — Strategic reduction of auto
                                                         Consumer
    Commercial
                                                         — Improve effectiveness of promotional
    — Prudently grow CRE                                   depository activity
    — Exit low-return relationships                      — Increase investments in digital channels
    — Reposition Asset Finance                           Commercial
                                                         — Focus on operational deposits
                                                         — Further enhance product suite

                                                                                                            10
Deposit cost growth remains in line with overall deposit growth
                                         Deposit growth vs. Deposit cost growth
                                                                 (1Q18 vs. 3Q15)

                                                                                                                                 Consumer
  30 bps                                                                                                             R²= 0.70       Continuing to invest in data analytics
                                                                                             CFG                                     to drive personalized targeting across
                                                                                                                   USB
                                                                                                                                     products
 Deposit cost growth

                                                                     KEY                                                               — Targeted branch, digital and
                       20                              FITB
                                                                                               STI                                         direct mail offerings
                                               MTB                                                                                     — Extending duration
                                                                                      PNC
                                                                          BBT                                                          —   Extend into digital channel
                       10
                                               RF                                                                                   Moving away from one-size fits all
                                                                                                                                     pricing to attract more stable deposits
                                           CMA
                                                                                                                                 Commercial
                       0
                           -10           -5             0                 5                 10                15           20%      Dedicated liquidity specialist team
                                                                 Deposit growth                                                      focused on growing client deposits

                                               Noninterest-bearing deposit growth                                                   Upgraded escrow platform and added
                                                                 (1Q18 vs. 1Q17)                                                     specialized resources
                                 3.4%
                                        2.6%
                                                                                                                                    Targeted 4Q18/1Q19 launch of
                                               0.1%
                                                                                                                                     upgraded cash management platform
                                                        -0.2%
                                                                  -1.2%       -1.3%
                                                                                        -2.9%
                                                                                                     -3.5%    -3.7%

                                                                                                                       -7.2%
                                 BBT    CFG      STI        RF     PNC        KEY        CMA            USB   FITB       MTB

Note: Represents total deposit costs and noninterest-bearing deposit growth based on period end data.
Source: SNL Financial, 10-Qs, 10-Ks, Earning Releases and Supplements.                                                                                                         11
Citizens Access - a new direct-to-consumer digital channel

                                            The Citizens Access platform
                                             A nationwide direct-to-consumer platform for digitally-savvy
                                              consumers who value the flexibility and convenience of an
                                              online offering
                                              ─ Initially offering FDIC-insured online savings accounts and
                                                certificates of deposit with attractive rates and no fees
                                              ─ Targeting consumers that are willing to forego services
                                                typically offered by a traditional branch channel in
                                                exchange for better rates and lower fees
                                              ─ Delivered with simplicity and security that meets
                                                consumers’ rapidly changing preferences towards digital
                                                channels
                                             Launch targeted for early third quarter 2018

                                             Expected to generate ~$2 billion in deposits by year-end 2018

           For illustrative purposes only

                                                                                                              12
Citizens Access – A complement to Citizens’ digital strategy

                   Platform to acquire growing segment of nationwide customers actively seeking to
 Gain access to     do business with a digitally-led direct bank
 new customers
                   Extends and diversifies Citizens’ deposit franchise using a lower-cost-to-serve
  and expands       digital platform with minimal risk of impacting existing deposit base
  distribution
     reach         Complements Citizens’ highly accretive retail lending initiatives such as
                    education refinance, merchant finance and home equity

                   Provides opportunity to leverage our investments in data and analytics
                    capabilities that enhance our ability to understand and react to changing
    Enhances        consumer preferences
     digital       Facilitates opportunity to innovate
   capabilities     ─ Nimble, real-time bank platform
  and leverage
                   Enables piloting of new digital-only customer journeys and capabilities
    analytics
                   Creates synergies as best practices are developed in meeting customer
                    expectations between digital and branch channels

     Improves
  efficiencies,    Allows for improved efficiencies towards optimizing deposit costs
      further      Contributes to funding diversification and balances activities/investment with
   strengthens      traditional brick and mortar channel
  liquidity and    Launch of Citizens Access was contemplated in previous Citizens statements
    diversifies     regarding 2018 financial outlook and deposit betas
      funding
                                                                                                      13
Remain rate sensitive

                                Interest rate sensitivity trend                                                                                                     Highlights

                                                                                                                                       Net interest income positioned to
                                                                                                                                           continue to benefit from rising rates
            6.0%                                                                                                                           ─ Our asset sensitivity has
                                   5.5%                    5.4%                   5.1%                    5.0%                                remained relatively stable
                                                                                                                                              at 5.0%
            3.9%                                                                                                                       Given our current positioning, 25 bp
                                                           3.5%                                           3.2%
                                   3.0%                                           3.1%                                                  increase in rates would generate
                                                                                                                                        ~$15 million of NII per quarter
           1Q17                    2Q17                   3Q17                    4Q17                   1Q18                              ─ ~75% of our sensitivity is to the
                                                CFG              Peer median
                                                                                                                                              short-end of the curve;~25% to
                                                                                                                                              the long-end of the curve

                                                                                                                                                                                      Estimated
                                                           (1)                                                                                                           (2)
                     Fixed vs. floating loans                             Fixed           Floating               Deposit betas                Cumulative beta                   through-the-cycle beta
            Commercial                                                        27%             73%                Commercial                                56%                         ~70-75%
            Consumer                                                          68              32                 Consumer                                   8                          ~35-40
            Total CFG                                                         48%             52%                Total CFG                                 24%                          ~60%

                Cumulative loan betas through 1Q18 ~60%(1)

Note: CFG Data and Peer data as of 1Q18. Peer banks include BBT, CMA, FITB, KEY, MTB, PNC, RF, STI and USB. Peer estimates based on the public disclosures as of the most recent
quarter available and utilizes a 200 basis point gradual increase above 12-month forward curve except PNC, which is based on a 100 basis point gradual increase and STI, which is
based on a 200 basis point shock. PNC and STI excluded from peer median. Deposit and Loan betas based on 1 month LIBOR.
1) Includes hedges.
2) Deposit betas calculated for the period of 3Q15-1Q18.                                                                                                                                                 14
Plans to adjust capital structure but remain above peers
                 Common equity tier 1 comparison(1)                                                                                  Highlights

                                                                                                        Strong CET1 capital position relative to peers
        CMA                                                                 11.7%
                                                                                                            ─ Expect annual normalization of ~40 bps given both
        CFG                                                               11.2%                               capital return and strong loan growth
                                                                                                            ─ Expect peers to move towards 8%–10% over time
           RF                                                           11.1%
                                                                                                              CFG medium-term CET1 target              ~10.0-10.25%
        MTB                                                             11.0%                                            Peer publicly-stated   CET1 targets(2)
                                                                                                              BBT             ~10.0%            PNC        ~8.0-9.0%
        FITB                                                          10.6%                                   FITB             ~9.5%            RF            ~9.5%
                                                                                                              KEY          ~9.0% - 9.5%         STI
Further opportunities to improve returns: Growth in fee income businesses

                                                                   Fee Income

                                                        Consumer                        Commercial
                     Wealth                                               Capital & Global Markets
                      Investments in FCs and sales, technology            Broaden capabilities in DCM, M&A, CRE
                          platforms and products with shift toward
                          managed money                                    New FX options/currency swaps platform
                                                                            and capabilities
                      SpeciFi™ robo-advisor product
                                                                           Western Reserve Partners acquisition
                     Business Banking                                       closed May 2017; added 30+ M&A
                                                                            professionals(1)
                      Fundation FinTech partnership to
                          automate small business underwriting            Treasury Solutions
                     Mortgage                                              Replatforming cash management system

                      Remix toward direct-to-consumer and                 Investments in trade finance, merchant
                          conforming product                                services and commercial card

                      Further leverage servicing platform

                          Organic growth orientation, with potential for selective fee-based acquisitions

1) Includes employees affiliated with WRP Valuations.                                                                16
Building an ecosystem of FinTech partnerships to accelerate our path to market

        Launched innovative solutions and new
                                                                          Investing in additional capabilities that leverage
      capabilities that offer flexibility and speed for
                                                                                         FinTech relationships
                       our customers

                            Selected examples                                               Selected examples

                                                                              New digital (mobile-first) platform
 Consumer

                                                                      

                                                                             Simple and fast account opening experience
              Automated investing           Digital lending
              platform for Wealth         capability for small               Digitized home buying process
                   customers                  businesses
                                                                             Digitized HELOC application process
 Commercial

                                                                              Liquidity management portal
                  Digital invoice and        End-to-end workflow              Accounts payable and payments automation
                 payment collection        tool to improve speed of
               solution for Commercial       customer onboarding              Digital trade finance capabilities
                      customers                and collaboration
                    To launch in 2Q18              Early in 2019

                                                                                                                               17
Delivering for our customers

                    Ranked #1 in Temkin                                                                 Citizens Bank awarded Best                                  Zelle®, our P2P payments
                  Customer Experience for                                                                    Treasury and Cash                                         system launched in
                       U.S. Banks(1)                                                                     Management provider for                                    December registered more
                                                                                                        the Northeast, Mid-Atlantic                                   than 100,000 Citizens
                                                                                                            and Midwest regions                                      customers through 1Q18

                               Citizens Bank
                                 SpeciFiSM

             First large regional bank to                                                             Top 2 Box Score and overall                                    37 point increase in J.D.
              roll out a fully integrated                                                                commercial customer                                              Power branch
              digital investment advisor                                                              satisfaction rating of 94%(3)                                    satisfaction score(2)
                 platform – SpeciFiSM

1) 2018 Temkin Experience Rating, U.S. March 2018.
2) J.D. Power 2017 U.S. Retail Rankings Satisfaction Study, April 2017. Top 5 reflects wait times and in-person best practices for J.D. Power-surveyed footprint.
3) Barlow Research 2017 Voice of the Customer Survey (Top 2 Box score).                                                                                                                          18
Citizens has delivered consistent EPS growth….

                                                                                                                              $1.35

                                                                                                                                                         $0.85        $0.88           $0.92
                                                                                                                                           $0.78
                                                                                              $0.61       $0.63   $0.68
                                                                         $0.56     $0.55
                                                   $0.41     $0.46
                                                                                                                              $0.71
                                                                         $0.52                $0.57

                                                                                                                                                         consensus estimates(3)
                                                   1Q16      2Q16        3Q16      4Q16       1Q17     2Q17       3Q17        4Q17         1Q18        2Q18E 3Q18E 4Q18E
                                                                                  CFG GAAP EPS                CFG Adjusted/Underlying EPS(2)

                                                                                  …though valuation has fallen off
                                   16.0 x
                                                                                                                                                                       FY2018E/FY2016         2018 P/E
                                                                           MTB
                                                                                                                                                             Adj EPS growth(2,3) Ratio(2,3)
   2018E Price/Earnings ratio(3)

                                                                                                           CMA
                                                                    PNC                                                                            CMA              129%          14.4 x
                                   14.0 x
                                                             BBT                   RF                                                              CFG               81%          12.2 x
                                                                           FITB
                                                                                                                                                   RF               63%           13.7 x
                                                                     STI
                                                  USB                                                                                              Peer Avg.         57%          13.5 x
                                                                                                    CFG
                                   12.0 x                                  KEY                                                                     KEY               55%          11.8 x
                                                                                                                                                   FITB              54%          13.3 x
                                                                                                                                                   MTB              54%           15.0 x
                                                                                                                                                   STI               49%          13.1 x
                                   10.0 x
                                                                                                                                                   PNC               48%          14.2 x
                                            20%   30%      40%     50%      60%         70%   80%     90%130%
                                                                                                            100%
                                                                                                                                                   BBT               40%          13.6 x
                                            2018E/2016 EPS Adj growth rate(3)                       Peer Average                                   USB               25%          12.5 x
1) Compound annual growth rate.
2) Please see important information on Key Performance Metrics and Non-GAAP Financial Measures at the beginning and end of this presentation for an explanation of our use of these
   metrics and non-GAAP financial measures and their reconciliation to GAAP financial measures, as applicable.
3) Source: Bloomberg, as of 5/9/2018.                                                                                                                                                                    19
Key messages

  Solid franchise with leading positions in attractive markets

  Achieved IPO-based objectives and elevated our targets

  Citizens results highlight disciplined execution and continued momentum

  Robust balance sheet position
     ─   Credit quality and key coverage metrics remain strong
     ─   Remain focused on growing more attractive risk-adjusted return portfolios and
         controlling deposit costs
  Continued strong execution against all strategic initiatives
     ─   Keen focus on continuous improvement
     ─   Focused on delivering enhanced customer experience
     ─   Continue to self-fund significant investments in technology, digital capabilities,
         talent and growth initiatives

  Focused on becoming a top performing bank
  On track to deliver well for all stakeholders in 2018

                                                                                              20
Appendix

           21
Our vision and credo guide us

     Mission     To help our customers, colleagues and communities reach their potential

                 To be a top-performing bank distinguished by its customer-centric culture, mindset
      Vision     of continuous improvement and excellent capabilities

                 We perform our best every day so we can do more for our customers, colleagues,
                 communities and shareholders

      Credo      We strive to always exceed customer expectations, do the right thing, think
                 long-term, work together

                 We are citizens helping citizens reach their potential

                                                                                                      22
Making consistent progress against our financial goals
                                                                                                                                                                                                                                    Medium-term
 Key Indicators                                                                                                                                                                                                                       targets

                                                                                                                          10.4% 11.7%
                                                                                                                                                                                                                                     ~13 - 15%
       Adjusted/                                                                                8.0% 8.4% 9.0% 9.6% 10.1%
       Underlying                                  6.3% 6.2% 6.8% 6.7% 6.7% 6.6% 6.8% 6.6% 7.3%
                                    4.3% 5.2% 5.2%
        ROTCE(1)

       Adjusted/
       Underlying                                 68%     69%       70%
                                     68%                                       68%       67%        68%       67%        66%       66%       66%        65%
       efficiency                                                                                                                                                 63%        62%
         ratio(1)
                                                                                                                                                                                       62%        62%       59%         59%   60%    Mid-50%’s
                                                                                                                                                                                                  60%

                                   13.9% 13.5% 13.4% 13.3% 12.9%                                                                                   ~10.0                                                                                – 10.25%
   Common equity                                                 12.4% 12.2% 11.8% 11.8% 11.7% 11.6% 11.5% 11.3% 11.2% 11.2% 11.2%
                                                                                                                                   11.1% 11.2% 11.2%
    tier 1 ratio(2)

          EPS                                                                                                         $0.68 $0.71 $0.78
  Adjusted/Underlying                                                                   $0.46 $0.52 $0.55 $0.61 $0.63
                                        $0.37 $0.36 $0.39 $0.39 $0.40 $0.40 $0.42 $0.41
     diluted EPS(1)   $0.26 $0.30 $0.30
                                                                                                                                                                                      $0.57

                                    3Q13 4Q13 1Q14 2Q14 3Q14 4Q14 1Q15 2Q15 3Q15 4Q15 1Q16 2Q16 3Q16 4Q16 1Q17 2Q17 3Q17 4Q17 1Q18
                                            (3)

                                                                Adjusted results(1)                               Reported results(1)                             Underlying results(1)

1) Please see important information on Key Performance Metrics and Non-GAAP Financial Measures at the beginning and end of this presentation for an explanation of our use of these metrics and non-GAAP financial
   measures and their reconciliation to GAAP financial measures. Where there is a reference to “Underlying” results in a paragraph, all measures that follow these references are on the same basis, when applicable.
2) Common equity tier 1 ("CET1") capital under Basel III replaced tier 1 common capital under Basel I effective January 1, 2015.
3) Commencement of separation effort from RBS.                                                                                                                                                                                               23
Delivered attractive balance sheet and revenue growth in 1Q18
1Q18 vs. 1Q17
                                                       A strong platform well-positioned to drive value
              Strong loan growth                                                            Revenue growth                                                      Higher NIM expansion
               (Average total loan growth)                                                   (Total revenue growth)                                                (Net interest margin change)

                 2.8%                                                                                                                                                              `
                                                                                                                      7.2%
                                                           vs Peers                                                                   vs Peers                                                        vs Peers
                                                                                             5.6%                                                               20 bps
                                                          212 bps                                                                   152 bps                                             19 bps       1 bps
                                                                                                                                      98 bps
                                                                                                                      4.7%

                                          0.7%

                  CFG               Peer average                                             CFG               Peer average                                       CFG                  Peer average

               Robust NII growth                                                    Fee income performance                                               Asset-sensitive balance sheet
               (Net interest income growth)                                            (Noninterest income performance)                                (+200 bps gradual increase over forward curve(2))
                                                                                                                                                            Peer data as of most recent 10-Q filing

                 8.6%                                      vs Peers                                                   8.3%            vs Peers                                                        vs Peers
                                                                                                                                                               5.0%
                                                          181 bps                                                                   1037 bps                                                        180 bps
                                          6.9%
                                                          165 bps                                                                   292 bps
                                          6.8%                                                                                                                                            3.2%
                                                                                                                     0.8%

                                                                                            -2.1%
                  CFG               Peer average                                             CFG               Peer average                                     CFG               Peer average

                                                                                  CFG GAAP                     Peer average GAAP
                                                                                                               Peer average Adjusted(1)
Source: CapIQ and Company filings. Peers include CMA, BBT, FITB, MTB, PNC, RF, STI and USB. As a result of KEY's 3Q16 acquisition of First Niagara, KEY's results have been excluded
from the Peer average and Peer median.
1) Where disclosed, peer results adjusted for unusual or special revenue, expense and acquisition items.
2) Reflects net interest income sensitivity to forward yield curve changes. Peer data based on public disclosures as of 1Q18 10-Q filing. Peer data utilizes a +200 basis point gradual
   increase above the 12-month forward curve except PNC and STI, which disclose +100 basis point gradual increase and +200 basis point shock. PNC and STI estimated based on the
   disclosed data.                                                                                                                                                                                               24
With continued focus on expense control and improving returns
1Q18 vs. 1Q17

            Well-controlled expenses;                                             Positive operating leverage                                               Efficiency improvement
                                                                                      (YoY Positive operating leverage(1))                                         (Efficiency ratio(1) change)
              investing for growth
                  (Noninterest expense change)
                                                            vs Peers                                                                vs Peers                    CFG               Peer average          vs Peers
                     3.4%                                                                                            5.7%
                                                           194 bps                                                                 352 bps                                                            237 bps
                                             2.9%
                                                            57 bps                                                                  35 bps                                           (103) bps        22 bps

                                             1.5%                                                                                                           (125) bps
                                                                                            2.1%

                                                                                                                     1.8%

                     CFG               Peer average                                          CFG               Peer average                                                            (362) bps

                              PPNR                                             Improving ROA as assets grow                                                           Return on equity
                   (Pre-provision Net Revenue)                                    (Return on average total assets change)                              (Return on average tangible common equity(1) change)

                                            21.8%          vs Peers                                                               vs Peers                                                              vs Peers
                                                                                                                 40 bps                                                                    489 bps
                                                         1262 bps                                                                23 bps                                                               286 bps
                                                          164 bps                                                                8 bps                                                                102 bps
                                                                                        23 bps                   31 bps                                           273 bps                  375 bps
                    9.2%
                                            7.5%
                                                                                        17 bps                                                                    203 bps

                    CFG               Peer average                                        CFG               Peer average                                             CFG                Peer average
                                                                                  CFG GAAP                        Peer average GAAP
                                                                                  CFG Underlying(1)               Peer average Adjusted(2)

Source: CapIQ and Company filings. Peers include CMA, BBT, FITB, MTB, PNC, RF, STI and USB. As a result of KEY's 3Q16 acquisition of First Niagara, KEY's results have been excluded
from the peer average and peer median.
1) Please see important information on Key Performance Metrics and Non-GAAP Financial Measures at the beginning and end of this presentation for an explanation of our use of
   these metrics and non-GAAP financial measures and their reconciliation to GAAP financial measures, as applicable. Where disclosed, peer results adjusted for unusual or special
   revenue, expense and acquisition items.                                                                                                                                                                         25
Citizens Access – Consumers rapidly adopting digital/direct platforms
                      Direct Bank market growing in absolute
                         terms and as % of total deposits(1)
                                                                                              Direct Banks
                                   $2.0T                               $3.8T                      CAGR
        Direct Banks                    3%                                                                                              Digital/Direct is the fastest growing channel in
                                                                          19%                      18%
                                                                                                                                             the industry
                                                                                                                                             ─ Direct bank retail deposits grew at a ~18%
                                                                                              Traditional
                                                                                              Banks CAGR
                                                                                                                                               CAGR from 2002 to 2017 compared with a
                                       97%                                                                                                     ~3% CAGR for traditional bank retail deposits
        Traditional                                                                                 3%
                                                                          81%
                                                                                                                                        Our objective is to provide an exceptional
                                                                                                                                             digital experience
                                                                                                                                             ─ Accessible on a mobile device, tablet, or
                                      2002                               2017                                                                  computer at CitizensAccess.com
              Digital banking customers have very favorable                                                                                  ─ Available through sites such as Google,
                               experiences(2)                                                                                                  Bankrate and NerdWallet
                                                                                               87%
                                                                                   82%
                                 72%
                                                                76%                                                                          ─ Provides ability to further leverage robust
                                                                                                                                               data analytics capabilities to improve the
                     56%                            57%
                                                                                                                                               efficiency of reaching the right customers,
                                                                                                                                               at the right time, with the right offering, to
                                                                                                                                               meet their needs
                                                                                                             Direct Banks

                                                                                                             Traditional Banks

              Definitely Will Reuse               Definitely Will            Overall Satisfaction
                                                   Recommend

1) Source: SNL Financial, FDIC Flow of Funds. Includes Charles Schwab, Capital One, USAA, ALLY, Amex, Synchrony Bank, Discover, E*TRADE, Barclays, Marcus, CIT and Others.
2) Source: J.D. Power 2017 Direct Banking Satisfaction StudySM
                                                                                                                                                                                                26
Citizens Access expands distribution to reach new customers

 Citizens Access provides a winning combination of simplicity, security and attractive rates

     Target customer
      Profile: Opportunistic and digitally-savvy, affluent or mass-affluent consumers, large
        balances ($75k-$100K)
      Preferences: Opportunity to receive consistently better rates with little or no effort,
        security of deposits, simplicity, fee avoidance
      Behaviors: Seeks improved rates in return for a lower-cost service model on aggregator sites
        or search engines, separates savings from transactions, often maintains separate primary
        checking account at a traditional bank

     Channel offering
      Online & Mobile – primary sales and service channel

      Paperless banking – all documents delivered electronically

      Initially offering online savings accounts and certificates of deposit

      Supported by professional call center

                                                                                                      27
Future oriented digital services and technology platforms
                      Building capabilities to better serve our customers

      Modernize Strategic                   Data analytics                 Adaptive Security
          Platforms
  Minimize manual processes;        Enabling a data environment      Prepare for emerging
   Partners & FinTechs to                                               threats through trusted,
                                     Deliver fast access to high
   contribute new functionality                                         simple and secure
                                      quality data
                                                                        capabilities
  FinTech partnerships to
   accelerate our path to                                              Deliver a platform that can
   market                                                               adapt to future threats

      Open Architecture                           Cloud                           Agile

  Continuing to open up             Adoption of Cloud delivery       Company-wide Agile delivery
   architecture with Middleware        model                            model; provide early,
   & APIs                                                               predictable delivery, lower
                                     ‘Cloud First’ approach to
                                                                        cost, better quality
  Develop an App Store-like           deliver agile, flexible, and
   ‘marketplace’ for secure            low-cost solutions
   collaboration

                                                                                                      28
Appendix / Key performance metrics,
Non-GAAP financial measures and reconciliations

                                                  29
Key performance metrics, Non-GAAP financial measures and reconciliations
$s in millions, except share, per share and ratio data

                                                                            30
Key performance metrics, Non-GAAP financial measures and reconciliations
$s in millions, except share, per share and ratio data

                                                                            31
Key performance metrics, Non-GAAP financial measures and reconciliations
$s in millions, except share, per share and ratio data

                                                                            32
Key performance metrics, Non-GAAP financial measures and reconciliations
$s in millions, except share, per share and ratio data

                                                                            33
You can also read