2020 FOOD & HEALTH SURVEY - International Food Information Council - International Food Information ...
←
→
Page content transcription
If your browser does not render page correctly, please read the page content below
2020 FOOD &
HEALTH SURVEY
International Food Information Council
This year’s Food and Health Survey marks the 15th time the
             International Food Information Council (IFIC) has surveyed
             American consumers to understand their perceptions, beliefs,
             and behaviors around food and food purchasing decisions.
             This year, the survey continues an examination of issues related
             to health and diet, food components, food production, and food
             safety. It also explores new topics, such as how food and health
             behaviors have changed in the past decade (2010-2020) and how
             health monitoring devices and apps impact habits.
             As we are all too aware, the 2020 survey (conducted between
             April 8 and April 16) also takes place against the backdrop of one
             of the deadliest and most life-disrupting pandemics in recent

Background   world history.
             Of course, it cannot be underestimated how impactful this
             context is on the results of a survey about food and health.
             While many beliefs and actions on these topics have not shifted
             in the short-term, the widespread lockdowns of non-essential
             businesses and activities, the safety precautions we incorporate
             into our lives, and the new quarantined lifestyle in which we find
             ourselves is a major disruption to life as normal. As you interpret
             the results of this report, it is essential that this context be kept
             in mind as part of the broader setting for how American
             consumers in 2020 think and act.

                                                              foodinsight.org | 2
Online survey of 1,011 Americans
                      ages 18 to 80. Fielding took place
                      between April 8 to April 16, 2020.

                      The survey took approximately 23
                      minutes to complete on average.
Methodology   The results were weighted to ensure that they are reflective
              of the American population ages 18 to 80, as seen in the
              2019 Current Population Survey. Specifically, they were
              weighted by age, education, gender, race/ethnicity and
              region.
              The survey was conducted by Greenwald & Associates, using
              Dynata’s consumer (formerly the Research Now) panel.
              Note: significant changes in trend vs. 2019 (or in some cases
              2010) are indicated where appropriate with up and down
              arrows or call-out boxes.

                                                           foodinsight.org | 3
The 2020 Food and Health Survey seeks to understand
            consumers’ perceptions and behaviors around food and
            food purchasing decisions.
            The findings from this year’s online survey of 1,011
            Americans ages 18 to 80 focuses on:
            ▪ How the COVID-19 crisis has impacted food and diet
              habits
            ▪ Views on food safety, especially in the context of the
              COVID-19 crisis

Executive   ▪ Changes in food and health attitudes and behaviors over
              the past decade

Summary     ▪ Food and beverage purchase drivers
            ▪ Plant-based foods and eating patterns generally
            ▪ The link between food and desired health outcomes
            ▪ Beliefs about food production and food technologies
            Findings are presented for all respondents. Additional
            insights are provided based on how findings vary by
            different types of demographic groups such as by age,
            race, gender and income.
Executive Summary         Key Findings

This year, some of the more compelling findings of the       The pandemic has significantly
Food and Health Survey include:
                                                             changed Americans’ concerns and
  The vast majority of Americans have                        beliefs about food safety, at least for
  altered their food habits as a result of                   now.
  the COVID-19 pandemic.                                  While consumers’ top food safety issues have been
                                                          stable in recent years, this year concerns about food
More than 8 in 10 Americans say they have experienced
some change to their habits surrounding eating or food    handling and preparation related to the risk of COVID-19
preparation. Cooking more at home is, not surprisingly,   has shot up to the second most important issue for
the biggest change, but many are also snacking more,      Americans (or the top issue if looking at what people
washing produce more than usual, and thinking about       rank as number 1 only). More than a third of Americans
food in general. Consumers under age 35 are most likely   also say that they actively avoid foods and beverages as a
to have made changes, both in terms of healthier and      result of their concerns about the food safety issues.
less healthy choices.
                                                          In addition, roughly half of Americans are concerned
Grocery shopping is also impacted, naturally. The         about eating food prepared outside the home, whether
amount of in-person shopping is down, especially among
those in poorer health. Meanwhile, online grocery         in a restaurant or delivered. Interestingly, while more
shopping has increased. That said, the changes have not   than a third of consumers also express concern about
been entirely drastic – the biggest shift for in-person   shopping for groceries in-person (especially parents),
shopping is that fewer Americans are making multiple      there is still more overall concern with food safety when
trips a week.                                             shopping for groceries online.
                                                                                                  foodinsight.org | 5
Executive Summary         Key Findings

   The factors that drive food purchasing                    Nearly 6 in 10 Americans also say the emphasis they
                                                             place on their overall health when making decisions
   decisions have remained quite stable                      about what to eat and drink has increased,
   over the past decade, but when you ask                    surpassing the emphasis placed simply on one’s
   consumers themselves how their                            weight (although not by a lot).
   decision-making compares, more than
   half say healthfulness matters more to
   them now.
                                                               The amount of people who are actively
Taste and price are not surprisingly still the top factors     following a diet is up significantly in
for decisions, and while there has been movement year          comparison to 2019.
to year in the degree to which purchase drivers impact
consumers, the comparison of 2010 results to 2020            While there are fewer Americans making general
shows almost no change. Yet, Americans have a different      changes to improve the healthfulness of their diet in
view of themselves and their own evolving purchasing         2020 vs. what was observed a decade ago, dieting is up
decisions: 54% of all consumers, and 63% of those age        vs. 2019. 43% of Americans followed a specific diet or
50+, care more about the healthfulness of their choices      eating pattern in the last year (up from 38% in 2019 and
than they did in 2010. Of course, taste and price are        36% in 2018), with intermittent fasting taking the lead as
more impactful for 4 in 10 consumers as well, which may      most common. Clean eating, last year’s top diet, has
account for the lack of overall change in trend, but         dropped to 2nd place.
healthfulness is the biggest mover.
                                                                                                      foodinsight.org | 6
Executive Summary        Key Findings

  Nearly 3 in 4 judge their own diet to be                  Familiarity with the government’s
  healthier than that of the average                        Dietary Guidelines for Americans has
  American.                                                 increased dramatically since 2010.

On a scale of 0 to 100, where 100 represents an          In 2010, only 23% of Americans said they knew at least a
excellent diet, consumers give themselves an average     fair amount about the Dietary Guidelines. This year, 41%
score of 59 and give the “average American” a score of   said the same, an increase of 18 percentage points.
42. Overall, 73% rank their own score higher than the    Unfortunately, there is a huge gap in awareness by health
average American and only about 1 in 6 see themselves
                                                         status: 49% in excellent/very good health know at least a
as below average. This view may be why consumers also
see the biggest changes in the average American’s diet   fair amount about the Guidelines vs. just 29% who are in
over the past decade as being an increase in fast        poorer health. Related to the increase in familiarity with
food/eating out and an increase in consumption of        the Dietary Guidelines, familiarity with the MyPlate
processed foods.                                         graphic has also increased vs. 2019.

                                                                                                 foodinsight.org | 7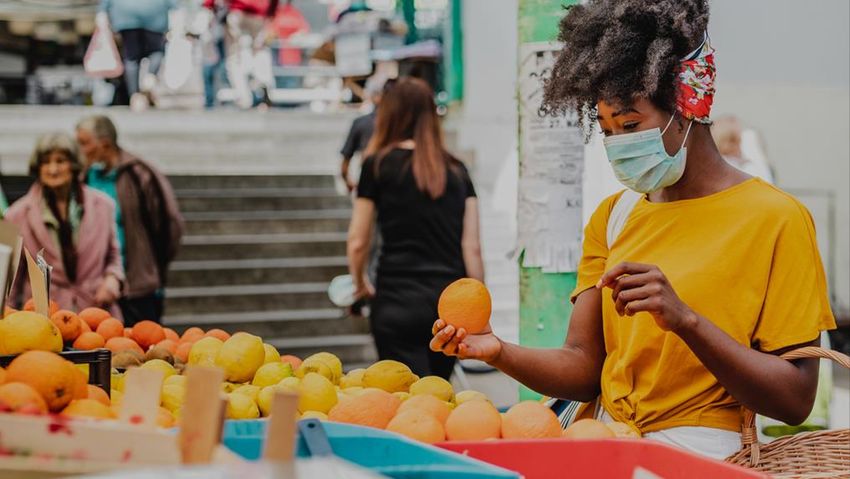
Executive Summary          Key Findings

   Nearly 1 in 5 Americans are using a                          A quarter of Americans snack multiple
   mobile health monitoring device or app,                      time a day and nearly 4 in 10 at least
   and two-thirds of those who are say it                       occasionally replace meals by snacking.
   has led them to make healthy changes in
   their life.                                               Consistent with 2019, 26% say they snack multiple times a
                                                             day and another third snack at least daily. Most often,
                                                             snacking happens because people simply feel hungry or
18% of consumers are using some sort of health
                                                             thirsty, but the 2nd most common reason is snacks are
monitoring device or app, whether it be related to
                                                             viewed as a treat for themselves. 38% say they at least
diet/food consumption, exercise/physical activity, or
                                                             occasionally replace meals by snacking (lunch being the
their overall health. It is more common amongst women,
                                                             meal most often replaced) and another quarter of
parents, those with higher income and education, those
                                                             Americans sometimes skip meals entirely.
in urban areas, and those following a diet. Of those using
one, nearly all feel more aware of their health status,
with 45% saying it helps greatly. And 66% say it has led
to healthy changes they otherwise wouldn’t have made.

                                                                                                   foodinsight.org | 8
Executive Summary          Key Findings

   Consumption of protein from plant                            Fewer Americans are trying to limit or
   sources and plant-based meat and dairy                       avoid sugars in 2020, although this is still
   alternatives have increased in the past                      very common.
   year.
                                                             Three-quarters of consumers (74%) are trying to
According to consumers reflecting on their own habits        limit/avoid sugars in their diet this year, which falls slightly
over the past year, 28% are eating more protein from         from the 80% doing so in 2019. The most common tactic
plant sources, 24% are eating more plant-based dairy,        for those who are trying to limit/avoid sugars remains
and 17% are eating more plant-based meat alternatives.       opting for water instead of caloric beverages. That said,
Those following a specific diet or eating pattern are huge   there has been no change to consumers’ overall
drivers of these numbers: 41% of dieters say they            preferences for sugars vs. low-/no-calorie sweeteners vs.
increased consumption of protein from plant sources (vs.     using neither.
18% of those not following a diet) and 28% say they eat
more plant-based meat alternatives (vs. just 9%).

                                                                                                         foodinsight.org | 9
Executive Summary         Key Findings

   Half of Americans say that whether a                    Nearly 6 in 10 consumers say it is important that the
                                                           food products they purchase or consume are produced
   food is processed impacts their                         in an environmentally sustainable way (similar to the
   purchasing decision, a factor that has                  54% who said the same in 2019). 43% also say it is
   gained traction over the past decade.                   important that a food manufacturer “has a
                                                           commitment” to sustainability and 40% say the same
49% of consumers say that whether they consider a          about knowing food was produced using farming
product to be processed is a factor in their decision to   technologies that seek to reduce the impact on natural
buy foods and beverages, landing it just below             resources.
convenience but ahead of environmental sustainability in
terms of considerations. More than 4 in 10 also say that   Most critically, the share who say environmental
the importance of this factor has increased for them       sustainability has a real impact on their purchases is up
personally over the past decade.                           from 27% in 2019 to 34%. Yet, it remains difficult for
                                                           many consumers to truly know whether their choices
                                                           are in fact supportive of sustainability. “Sustainably
   Although the overall perceived                          sourced” labels and recyclable packaging are common
   importance of environmental                             signals for this, but over 6 in 10 find it hard to know
   sustainability has remained stable, there               whether their food choices are environmentally
                                                           sustainable. Of those who agree with this sustainability
   has been an uptick in the impact of this                confusion, 7 in 10 say it would influence their decisions
   factor on purchase decisions.                           more if it was easier to know.
                                                                                                   foodinsight.org | 10
Executive Summary Key Findings
More than 4 in 10 consumers would Caffeine consumption differs by gender
assume that a product that is described and for those with and without children.
as plant-based would be healthier than
Not surprisingly, caffeine is consumed most often when
one that is not, even if it had the exact people wake up or with breakfast. Men are much more
same Nutrition Facts label. likely than women to consume caffeine with breakfast,
while parents are much more likely to need caffeine with
When asked about a hypothetical comparison of two food lunch in comparison to those without children.
products with the same Nutrition Facts label, 43% say the
one that is “plant-based” would likely be healthier. This
ranks just below “all natural,” which 44% of consumers
believe would be healthier than the alternative, even with
the same nutritional information on the packaging.
foodinsight.org | 11The COVID-19 Pandemic &
Americans’ Food Behaviors
foodinsight.org | 12More than 8 in 10 Americans have altered their food habits as a
result of the COVID-19 pandemic
Women, those under age 35, and parents are among some of the most likely to
have made changes
41% of consumers under 35 say
they are snacking more than normal
(vs. 26% who are age 50+). Younger
Changes to Eating and Food Preparation Due to COVID-19 consumers are also more likely to
have changed their behavior in
Cooking at home more many of these ways, both in terms
Snacking more of healthy and less healthy choices.
Washing fresh produce more
Thinking about food more than you usually do
Eating healthier than you usually do
Eating more than you usually do
85% 41% of parents with children
Eating more pre-made meals from my pantry or freezer Any Change under 18 are snacking more (vs. 29%
Getting more meals delivered/take-out without children)
Eating less healthy than you usually do
Eating less than you usually do Women are more likely than men to
Snacking less
report that they are thinking about
Thinking about food less than you usually do
Other
food more than usual (31% vs. 22%)
None of the above and eating more than usual (24% vs.
N/A 17%)
0% 20% 40% 60% 80%
Q13b: Has there been any change to food you eat or how you prepare food as a result of the coronavirus (COVID-19) crisis? Select all that apply. (n=1,011) foodinsight.org | 13In-person shopping is down, online shopping is up,
67% of consumers
but overall shopping patterns have not changed in very good health
grocery shop in person
drastically at least once a week
(vs. 50% in fair/poor
The decrease in in-person shopping is from those making multiple trips in a week (down from 28% to health)
20%); those in poorer health are much less likely to be making regular in-person trips
Grocery Shopping Patterns 20% of consumers
with childrenIn the context of the pandemic, roughly half are 53% of consumers who
grocery shop online at least
at least somewhat concerned about eating food once a month are concerned
about food prepared outside
prepared outside the home their home (vs. 43% who
never do). Similarly, 41% are
Food safety concern is still greater for online grocery shopping than it is for in-person concerned about in-person
grocery shopping (vs. 31%).
How Context Impacts Concern
56% and 55% of
5 - Very concerned 4 3 2 1 - Not at all concerned Hispanic and African
When eating food prepared outside your home (e.g., American consumers,
takeout/delivery from a restaurant) respectively, are concerned
about eating away from the
When eating away from home (e.g., at a restaurant) home (vs. 43% of non-
Hispanic whites)
When shopping for groceries online
43% of parents with
When shopping for groceries in a store children under 18 are
concerned about in-person
When preparing meals at home
grocery shopping (vs. 33% of
those without children)
0% 20% 40% 60% 80% 100%
Q55: How concerned are you about food safety in each of the following contexts? (n=1,011) foodinsight.org | 15Despite COVID-19, nearly 7 in 10 are at least somewhat confident
in the safety of the U.S. food supply
Those in very good health, those with a spouse/partner, and older consumers are more likely than their counterparts
to be confident in the U.S. food supply
Confidence in the Safety of the U.S. Food Supply
72% of consumers who are in
excellent/very good health are
confident (vs. 60% in fair/poor
health)
Very confident
67% No change
Somewhat confident 74% of those with a
from 2019 (68%) spouse/partner are confident
Very/Somewhat Not too confident
Confident
(vs. 59% of single consumers)
Not at all confident
Not sure 72% of those age 65+ are
confident (vs. 56% of those under
age 35)
Q54 (TREND): Overall, how confident are you in the safety of the U.S. food supply? (n=1,011) foodinsight.org | 16The top 4 food safety issues in 2019 have all decreased, due to the
rise in concerns related to COVID-19
More than a third of consumers avoid certain foods/beverages due to their top food safety issue
Most Important Food Safety Issues Today Avoidance of Foods/Beverages Due
Foodborne illness from bacteria
to Top Food Safety Issue
Food handling/food preparation related to risk of COVID-19*
Chemicals in food
Carcinogens or cancer-causing chemicals in food
Pesticides/pesticide residues 36%
Food additives and ingredients avoid
foods/beverages
Antibiotics** due to top food
The presence of allergens in food safety issue
Ranked 1 Ranked 2-3
Bioengineered food/Food that contains bioengineered ingredients*
GMOs**
Other Yes No Not sure
*New in 2020 0% 20% 40% 60%
**Revised in 2020
Q56 (REVISED TREND): What in your opinion are the three most important food safety issues today? Please rank from 1 to 3, with 1=Most Important. (n=1,011)
Q57: In the previous question, you identified [INSERT TOP CONCERN] as your #1 food safety issue today. Do you ever avoid specific foods and/or beverages when foodinsight.org | 17
shopping because of this concern? (n=1,011)Changes in the Past Decade
foodinsight.org | 18The drivers of purchase decisions have remained largely stable
since 2010, with taste and price still on top
The importance of environmental sustainability as a purchase driver has increased since 2019
Purchase Drivers Over Time (% 4-5 Impact out of 5) 2020
100%
Taste 88
90% Taste Price 70
Healthfulness 60
80% Convenience 52
Environmental 34
70% Price
Sustainability
60% Healthfulness
50% Convenience
40% Environmental
30% Sustainability *
20%
10%
0%
2010 2011 2012 2013 2014 2015 2016 2017 2018 2019 2020
Q10 (TREND): How much of an impact do the following have on your decision to buy foods and beverages? (n=1,011)
*Prior to 2019, Environmental Sustainability was asked simply as “Sustainability”
foodinsight.org | 19Half of Americans say that whether a food is processed impacts
their purchasing decision
4 in 10 also view processing as having more of an impact on their purchasing decisions than it did 10 years ago
Current Impact of Whether a Product is 10 Year Change in Impact of Whether a
Considered to be Processed Product is Considered to be Processed
53% of consumers in
very good health consider
processing to be
49% 43% impactful (vs. 43% of
those in poorer health)
Impacts More of an
Decision Impact Now
(4-5) 58% of those who have
followed a diet consider
processing to be
5-A great impact Much more of an impact now impactful (vs. 42% who
4 Somewhat more of an impact now haven’t)
3 Same impact
2 Somewhat less of an impact now
1-No impact Much less of an impact now
Q11: How much of an impact does the following have on your decision to buy foods and beverages? “Whether you consider the product to be processed” (n=1,011)
Q12: For each of the following, how has the impact on your decision to buy foods and beverages changed over the last 10 years? “Wh ether you consider the foodinsight.org | 20
product to be processed” (n=1,011)When consumers consider their own habits over the past
decade, more than half say healthfulness impacts food
shopping more now
Taste and price have also become more impactful for 4 in 10
63% of consumers ages 50+
indicate healthfulness has more of
Self-Reported Change in Purchase Drivers Over the Last 10 Years an impact now (vs. 46% under age
50)
Much more of an impact now Somewhat more of an impact now Same impact
Somewhat less of an impact now Much less of an impact now
Healthfulness
47% of women indicate price
has more of an impact now (vs.
Taste
37% of men)
Price 60% of those with
spouses/partners indicate that
Environmental Sustainability healthfulness has more of an
impact now (vs. 48% of single
Convenience consumers)
0% 10% 20% 30% 40% 50% 60% 70% 80% 90% 100%
Q12: For each of the following, how has the impact on your decision to buy foods and beverages changed over the last 10 years? (n=1,011) foodinsight.org | 21When it comes to choosing what to eat/drink, overall health
matters more to Americans than weight, but not by much
Over half say they emphasize both equally, while 29% place greater emphasis on
overall health and 16% place greater emphasis on their weight
74% of women indicate they
Emphasis Placed When Making Decisions About What to Eat and Drink emphasize their weight a great
deal/some (vs. 66% of men)
Emphasize a great deal Emphasize some Emphasize only a little No emphasis
76% of those who are
overweight/obese indicate they
emphasize their weight a great
Your weight deal/some (vs. 62% with a normal
to low BMI)
85% of consumers with a
Your overall
college degree indicate they
health emphasize their overall health a
great deal/some (vs. 78% with less
than a college degree)
0% 20% 40% 60% 80% 100%
Q19: When making decisions about what to eat and drink, how much emphasis do you put on the following? (n=1,011) foodinsight.org | 22Nearly 6 in 10 place more emphasis on their overall health now
in comparison to how they made decisions a decade ago
At the same time, over half of Americans say they put a greater emphasis on their weight now compared to 10 years
ago
Change in Emphasis Placed When Making Decisions About
What to Eat and Drink in the Last 10 Years
Much more emphasis now Somewhat more emphasis now Same emphasis
Somewhat less emphasis now Much less emphasis now Not sure
59% of those who are obese
indicate they emphasize their
Your weight weight more now (vs. 47% with a
normal to low BMI)
58% of consumers who have
followed a diet say they
Your overall health
emphasize their weight more now
(vs. 49% who haven’t)
0% 20% 40% 60% 80% 100%
Q20: Now think back to 10 years ago (the year 2010). When making decisions about what to eat and drink, how has the emphasis you put towards the
following changed versus 10 years ago? (n=1,011) foodinsight.org | 23Consumers see increases in fast food/eating out and processed
food as the biggest changes to the average diet
Meanwhile, about 1 in 8 say healthier food options have been the biggest trend this decade
Biggest Changes to the Average American’s Diet in the Last 10 Years
(2010-2020) (Open-ended Response)
Greater amounts of fast food/eating out
More processed food
Healthier food options (organic)
More sugar in diets
Overeating/unhealthy portion sizes
27% of consumers with
a college degree believe
More dieting (vegan, keto)
that more processed food
Increase in convenience
consumption has been one
More knowledge
of the biggest changes
More fat in diets
(vs. 17% with less than a
Unhealthy food is cheaper
college degree)
Less sugar in diets
Less exercise
Negative influence of ads/social media
Other
Don't know
0% 10% 20% 30%
Q8: What do you think have been the biggest changes to the average American’s diet in the last 10 years (2010-2020)? Please give as much detail as possible. (n=1,011)
Response options in the chart above are themes that were coded from open-ended comments. They do not represent direct quotes or options provided directly in the foodinsight.org | 24
survey.When it comes to projecting a decade into the future, Americans
are decidedly varied on how diets will change
Interestingly, parents are more pessimistic about the next decade than their counterparts
Biggest Changes to the Average American’s Diet Over the Next 10 years
(2020-2030) (Open-ended Response)
Generally worse
Generally better
More organic/healthy food
No change
More processed food
Increase in fast food
More education about what goes into food/healthy diets
More plant-based food and plant-based food substitutes
22% of parents with
More diets/dieting
children under 18 think the
Increase in food cost average American’s diet will
Less sugar be generally worse over the
Less meat next decade (vs. 12% without
Consumers will be lazier/want more convenience children under 18)
Availability of healthy foods, more choice
More awareness/accommodation of environmental/sustainability issues
Change in portion size
More exercising
More DIY (people growing/eating/cooking at home)
More awareness of GMOs
Other
Don't know
0% 10% 20% 30%
Q9: What do you think will be the biggest changes to the average American’s diet over the next 10 years (2020 -2030)? Please give as much detail as possible. (n=1,011) foodinsight.org | 25
Response options in the chart above are themes that were coded from open-ended comments. They do not represent direct quotes or options provided directly in the survey.The share of people making changes to improve the healthfulness
of their diet is down significantly since 2010
In terms of motivators, weight loss is down from 2010 and maintaining weight is up
Changes to Improve Healthfulness Reasons for Improving Healthfulness of Diet
of Diet in the Past 6 Months (Of those who made changes to diet over past 6 months)
To improve my overall well-being
To improve my physical health
69% of consumers
55% Down from
To lose weight
with an income of
2010 (64%) Down from 2010
YesOf those who made a dietary change over the past six months, 7
in 10 are changing the types of foods eaten
The second most popular change was to change the amount of food eaten
Changes Made to Improve Healthfulness of Diet
(Of those who made changes to diet over past 6 months)
74% of parents
without children under
Changing the types of foods and/or food components I eat Down from 2010 (76%)
18 who made a change
indicate they changed
Changing the amount of food I eat Down from 2010 (70%)
the types of food they
eat (vs. 62% with
Changing how often I eat
children under 18)
Counting calories
56% of Hispanics who
Changing my use of dietary supplements made a change indicate
they changed how
Other often they eat (vs. 39%
of non-Hispanic whites)
0% 20% 40% 60% 80%
Q18 (TREND): Which of the following changes have you made in the past six months to improve the healthfulness of your diet? Select all that apply.
foodinsight.org | 27
(Of those who made changes to diet, n=556)Little change in beliefs about sources of weight gain vs. 2019
A quarter of consumers believe that all sources of calories are equally likely to cause weight gain
Source of Calories Most Likely to Cause Weight Gain
Sugars
24% No change since 2019
Carbohydrates
24% 30% of consumers with a
college degree believe
Fats calories from sugars are most
Protein 16% likely to cause weight gain (vs.
4% 22% with less than a college
All sources same degree)
24%
Not sure 8%
2012 2013 2014 2015 2016 2017 2018 2019 2020
Q3 (TREND): What source of calories is the most likely to cause weight gain? (n=1,011) foodinsight.org | 28Familiarity with Dietary Guidelines
foodinsight.org | 29Familiarity and knowledge about the Dietary Guidelines for
Americans has increased significantly since 2010
There is a huge gap in awareness by health status: 49% in excellent/very good health know at
least a fair amount about the guidelines vs. just 29% who are in poorer health
47% of consumers with a
college degree know a lot/fair
amount about the guidelines (vs.
Familiarity with Dietary Guidelines for Americans 37% with less than a college
degree)
2010 2020
50% Dietary Guidelines 49% of consumers in
NET familiarity: 41% excellent/very good health know a
40%
lot/fair amount about the
Up from 2010 (23%) guidelines (vs. 29% in poorer
30%
health)
20%
10%
52% of consumers who grocery
shop online at least once a month
0% know a lot/fair amount about the
I know a lot about them I know a fair amount about I have heard of them, but I have never heard of them guidelines (vs. 33% who never
them know very little about them shop online)
Q15 (TREND): Which of the following best describes your familiarity with the “Dietary Guidelines for Americans”, which are the US govern ment-
approved food and nutrition guidelines? (n=1,011) foodinsight.org | 30Familiarity with the MyPlate graphic has increased
since 2019
Younger consumers, parents, those with a lower BMI, those in good health, and those
who followed a diet are more likely to know about the graphic
62% of consumers ages 18-34
Familiarity with the MyPlate Graphic know a lot/fair amount about the
2020 2019 2018 2017 2016 graphic (vs. 37% ages 35+)
I have seen it and know a lot about it 52% of consumers with a
45% know a lot/fair normal to low BMI know a lot/fair
I have seen it and know a fair amount amount amount about the graphic (vs.
(vs. 38% in 2019)
about it 39% who are overweight or
obese)
I have seen it but know very little about it
59% of parents with children
I have never seen it beforeDiets and Eating Patterns
foodinsight.org | 32More than half of Americans consider themselves to be in
excellent or very good health
As has been the case in previous years, the health disparity by income is immense: only 39% of those with income of
less than $35K view their health as excellent/very good
69% of consumers ages 18-34
Self-Reported Health Status describe their health as
excellent/very good (vs. 51% ages
57% Excellent/ Very good 35+)
Excellent
70% of consumers with a
Very good college degree describe their
health as excellent/very good (vs.
Good 2020 50% with less than a college
degree)
2019
Fair 2018
2017
63% of consumers with an
income of $35k+ describe their
Poor 2016 health as excellent/very good (vs.
39% with an income ofNearly 3 in 4 judge their own diet to be healthier than that of the
average American
Those with higher income and education, as well as urban and suburban consumers,
are more likely to consider their diet healthier than the average American 86% of consumers with a
college degree believe their diet is
Healthfulness of Consumers’ Overall Diet healthier than average (vs. 67%
with less than a college degree)
Compared to the Average Americans Overall Diet
Healthfulness of your overall diet 59.0 76% of consumers with an
income of $35k+ believe their diet
is healthier than average (vs. 64%
0 50 100 withNearly 1 in 5 Americans are using a mobile 25% of consumers with a
college degree use a device/app
health monitoring device or app (vs. 15% with less than a college
degree)
Women, parents, those with higher income and education, those in urban areas,
and those following a diet are all more likely to use one 22% of women use a
device/app (vs. 14% of men)
Health Monitoring Devices or Apps Used
Yes, devices/apps related to Most common 25% of consumers with an
examples: income of $75k+ use a device/app
diet/food consumption Apple Health app
(vs. 15% of those withTwo-thirds of those using health monitoring devices/apps say
they have led to healthy changes in their life
Nearly all feel more aware of their health status, with 45% saying it helps greatly
Increased Awareness due to Health Healthy Changes due to Health
Monitoring Devices/Apps Monitoring Devices/Apps
(Of those who used any devices/apps) (Of those who used any devices/apps)
Yes, greatly
95% Yes, greatly/
Yes, somewhat 66%
Yes, somewhat Yes
No
Yes No Not sure
0% 20% 40% 60%
Q22: Have these health monitoring devices/apps made you more aware of your health status than you otherwise would have been? (Of those who used any
devices/apps, n=183) foodinsight.org | 36
Q23: Have these health monitoring devices/apps resulted in healthy changes that you otherwise wouldn’t have taken? (Of those who used any devices/apps, n=183)More Americans are following a diet in 2020 than in 2019
Intermittent fasting has edged out clean eating as the most common diet followed
Followed A Diet in Type of Diet Followed
Past Year? Intermittent fasting
Clean eating
Ketogenic or high-fat diet
58% of consumers age Low-carb diet
Carb-cycling*
18-34 report trying a diet Gluten-free diet
(vs. 37% ages 35+) Plant-based diet
43% Mediterranean diet
Weight-loss plan
Yes 57% of consumers with Flexitarian
Vegetarian diet**
children under 18 report Whole 30
trying a diet (vs. 38% A personalized diet based on DNA test results*
without kids) DASH diet
Cleanse
Macronutrient counting*
Paleo diet
Up from
Vegan diet**
2019 (38%) *New in 2020
Other
**Revised in 2020
0% 5% 10% 15% 20%
Q30 (REVISED TREND): Have you followed any specific eating pattern or diet at any time in the past year? Select all that apply. (n=1,011) foodinsight.org | 37Wanting to lose weight is the top motivator for adopting a new
diet, especially for Americans over age 35
Women are significantly more likely to diet to protect long-term health than men
Motivators for Adopting a New Diet
(Of those who followed a specific eating pattern in past year) 56% of consumers ages 35+ say
I wanted to lose weight their motivation was to lose
weight (vs. 36% under age 35)
I wanted to feel better and have more energy
I wanted to improve my physical appearance
I wanted to protect my long-term health/prevent future health
45% of women say their
conditions motivation was to protect their
I wanted to prevent weight gain long-term health/prevent future
I wanted to better manage a health condition*
health conditions (vs. 29% of men)
A conversation with a friend, family member, or coworker
A news article, blog post, or study that discussed the effects of my 44% of single consumers say
selected eating patterns
their motivation was to prevent
I was incentivized by my employer*
weight gain (vs. 28% with a
Other spouse/partner)
*New in 2020
0% 20% 40% 60% 80%
Q31 (REVISED TREND): Which of the following motivated you to make an effort to adopt a new eating pattern/diet? Select all that apply.
(Of those who tried a diet in the past, n=417) foodinsight.org | 38Two-thirds have heard of both mindful eating and intuitive eating,
although mindful eating is more known
Those in very good health and those who grocery shop online at least once a month
are more likely than their counterparts to be familiar with mindful eating
Familiarity and Interest in Mindful Eating & Intuitive Eating
No change
Mindful eating Intuitive Eating in familiarity and
interest for both
50%
Mindful Eating Intuitive Eating since 2018
68% 40%
NET familiarity: 42%
NET interest: 58%
NET familiarity: 28%
NET interest: 55%
Heard
30%
of both
20%
10%
Heard of mindful eating only
Heard of intuitive eating only 0%
I have heard of it, I have heard of it, I have not heard of it, I have not heard of it,
Heard of both
and I am interested but I do not want but I am interested in and I do not want to
Heard of neither in learning more to learn more learning more learn more
Q28 (TREND): Which of the following best describes your familiarity and interest in the practice of “mindful eating”? (n=1,011)
Q29 (TREND): Which of the following best describes your familiarity and interest in the practice of “intuitive eating”? (n=1,011) foodinsight.org | 39Half of Americans stop eating when full and listen 65% of consumers
to hunger cues for when to eat ages 65+ stop eating
when they’ve had
enough to eat but
Those who have followed a diet are more likely to pay close attention to their food’s flavors and
textures and to limit distractions when eating, but are also more likely to feel guilt and emotionally eat not too much (vs.
50%Consistent with 2019, a quarter of Americans snack multiple
times a day
Younger consumers, those with lower income and education, those who are single, those with a higher BMI, and
African Americans are all more likely to snack multiple times a day
Frequency of Snacking Reasons for Snacking
I am hungry or thirsty
Snacks are a treat for me**
Multiple times a day
I want sweet snacks**
I want salty snacks**
Snacks are easily available to me/convenient
Once a day
Out of boredom
It is too long until my next meal
It is a habit of mine
A few days a week
I need energy
I want something nutritious
No change in In response to negative emotions like feeling sad or anxious
Once a week or less
In response to positive emotions like feeling happy or excited
frequency
As a way to procrastinate
since 2019 Other
Never
*New in 2020 No reason*
**Revised in 2020
Don’t know why*
0% 20% 40%
0% 10% 20% 30% 40% 50%
Q25 (TREND): In a typical week, how often do you snack in addition to your main meals? (n=1,011)
foodinsight.org | 41
Q26 (REVISED TREND): Which of the following are the most common reasons why you choose to snack? Please select your top 3 reasons. (Of those who snack n=982)Nearly 4 in 10 at least occasionally replace meals by snacking
A quarter skip meals entirely; Lunch is the most common meal that Americans replace by
snacking
Replacing Meals with Snacks/Smaller Meals
44% of women indicate they
Yes, I regularly replace meals by snacking/smaller meals regularly/occasionally replace
meals by snacking (vs. 31% of
men)
Yes, I occasionally replace meals by snacking/smaller meals
No, although I sometimes skip meals entirely
49% of consumers in the
Midwest indicate they
regularly/occasionally replace
No, I rarely skip meals meals by snacking (vs. 34% from
the South, 35% from the West,
Not sure and 36% from the Northeast)
0% 20% 40%
Q27: Do you ever replace traditional meals (breakfast, lunch, dinner) by snacking or eating smaller meals instead? (n=1.011) foodinsight.org | 42Nutrients and Desired
Health Benefits
foodinsight.org | 43Consumption of plant-based meat and dairy
37% of consumers
alternatives has increased in the past year, but 3 ages 18-34 indicate they
in 10 still report never consuming them eat more protein from
plant sources (vs. 24%
Those under age 35 are especially likely to have increased consumption of plant-based ages 35+)
products
Change in Consumption of Protein Sources in the Past 12 Months
31% of consumers
Eat much more now Eat somewhat more now Eat the same amount Eat somewhat less now Eat much less now Never consume Not sure with childrenA similar share seek health benefits from foods vs. 2019 and for
similar reasons
Those in very good health are more likely than their counterparts to actively seek out foods or follow a diet for the
health benefits
Top Sought After Health Benefits
Seek Health Benefits from Foods?
(Of those who seek health benefits from foods)
Weight loss/weight management
Energy
Yes, I actively seek out foods Digestive health
or follow a diet for health Heart/Cardiovascular health
benefits Muscle health/strength
Immune function
No, but I try to eat healthy in
general 25% Improved sleep*
Bone health
Yes Brain function (memory, focus, cognition)
Emotional/mental health
No, health benefits are not a
factor in my food choices Lowering inflammation
Cancer protection/prevention
Diabetes management/blood sugar control
Not sure Athletic/sports performance
Other
No change None of the above
*New in 2020
from 2019 (23%) 0% 20% 40% 60%
Q32 (TREND): Do you seek out certain foods or follow a particular diet because of the health benefits that those foods/diet provide? (n=1,011)
Q35 (REVISED TREND): Which of the following health benefits are you seeking to get from foods or nutrients? Select all that apply. (Of those who seek health benefits foodinsight.org | 45
from foods, n=232)Fiber, whole grains, and protein from plant sources are viewed as
healthiest
The perceived healthfulness of fiber and omega-3s are down from 2019; animal protein is up
Perceived Healthfulness of Foods
Healthy Neither healthy nor unhealthy Not sure Unhealthy
Fiber
Whole grains
Protein from plant sources
Probiotics
Omega-3 fatty acids (such as DHA)**
Dairy
Enriched refined grains
Prebiotics
Animal protein
Unsaturated fats**
Fortified foods
*New in 2020 Saturated fats*
**Revised in 2020 Sodium
0% 20% 40% 60% 80% 100%
Q33 (REVISED TREND): How would you rate the healthfulness of each of the following? (n=1,011) foodinsight.org | 46In line with what is considered healthiest, fiber, whole grains, and
protein from plant sources are the most sought after
Consumers age 50+ are more likely to try to consume fiber, whole grains, and omega-3 fatty
acids
Consume or Avoid the Following
Try to consume Neither - Just try to be aware Don't consider Not sure Try to limit or avoid
Fiber
Whole grains
Protein from plant sources
Omega-3 fatty acids (such as DHA)**
Dairy
Probiotics
Animal protein
Enriched refined grains
Prebiotics
Fortified foods
Unsaturated fats**
*New in 2020 Saturated fats*
**Revised in 2020 Sodium
0% 20% 40% 60% 80% 100%
Q34 (TREND): Do you generally try to consume or avoid the following? (n=1,011) foodinsight.org | 47Sugars and Sweeteners
foodinsight.org | 48Fewer are trying to limit/avoid sugars in their diet in 2020
Consumers with a spouse/partner are more likely to say that they are limiting/avoiding sugars
Actions Taken to Limit/Avoid Sugars
Limiting/Avoiding Sugars in Diet
(Of those limiting/avoiding sugars)
Avoid Limit No Drinking water instead of caloric beverages
Limiting certain foods and beverages in my diet*
Eliminating certain foods and beverages from my diet
Reducing the amount of carbs I consume
74% Choosing reduced-sugar foods*
Consuming smaller portions
Are trying to Using the Nutrition Facts label to choose products with less total sugars**
limit/avoid Using low-calorie sweeteners instead of adding sugar
sugars No longer adding table sugar to foods and beverages
Using the Nutrition Facts label to choose products with less added sugars**
Ordering or purchasing "sugar-free" options when available
Switching from full calorie beverages to low and no-calorie options
OtherPreferences for sugar vs. low/no calorie sweeteners has
remained stable
Men and single consumers are more likely than women or those with a spouse/partner to use sugar
Perceived Benefits of Using Low/No-Calorie Sweeteners
Sweeteners Likely to Use
(Of those who use low/no-calorie sweeteners)
Lose weight
Consume less sugar No change
34% Reduce carbohydrate intake
since 2019
No change Use low/no Maintain my weight
from 2019 calorie Manage diabetes or control blood sugar
sweeteners Consume fewer total calories
Consume an appropriate amount of total calories
Consume an appropriate amount of sugar
Any type of sugar (table sugar, honey, maple syrup) Improve or maintain dental health
Low/no calorie sweeteners (aspartame, sucralose, stevia) None of the above
I don't use any type of sugar or low/no-calorie sweeteners
0% 10% 20% 30%
Q39 (TREND): Which of the following are you more likely to use to sweeten foods and/or beverages? (n=1,011)
Q42 (TREND): Which of the following, if any, do you believe consuming low/no-calorie sweeteners helps you do? Select top answer. (Of those who foodinsight.org | 50
consume sweeteners, n=342)Those who don’t use sugar are most likely to not want the extra
calories or to think sugar is unhealthy
Women are more likely to avoid sugar to prevent extra calories, lose weight, and to reduce carb
intake
Reasons For Not Using Sugar
(Of those more likely to use low/no calories sweeteners or who do not
use any type of sugar or low/no calorie sweeteners)
I don’t want the extra calories “I think it helps me
I think sugar is unhealthy lose/maintain weight” is
I think it helps me lose/maintain weight down from 70% in 2019
I don’t need to add sweetness
Only asked of those who don’t use any
sugar or low/no calorie sweeteners
to 60% in 2020
To reduce my carbohydrate intake
I consume sugar in packaged products, but don’t add more myself “I don’t need to add
sweetness” is down from
Only asked of those who use
I prefer the taste of low or no-calorie sweeteners* low/no calorie sweeteners
To manage diabetes or control blood sugar 79% in 2019 to 71% in
Improve or maintain my dental health 2020
Advice from my healthcare professional
I follow a diet that forbids sugar Major Reason Minor Reason
Trend vs. 2019
Of those who don’t use either sugar
*New in 2020 I don’t like the taste of sugar or low/no calorie sweeteners:
0% 20% 40% 60% 80% 100%
Q40 (REVISED TREND): Why (don't you use/do you not prefer to use) any type of sugar (ex. table sugar, honey, maple syrup) to sweeten your foods and/or beverages?
(Of those more likely to use low/no calories sweeteners or do not use any type of sugar or low/no calorie sweeteners, n=634)
foodinsight.org | 51Those not favoring low/no-cal sweeteners primarily point to
reasons related to taste
Of those who don’t use either sugar or low/no-cal sweeteners, there has been a decrease in “not wanting to add
sweetness or thinking that sweeteners are unhealthy
Reasons For Not Using Low/No-Calorie Sweetener
(Of those less likely to use low or no calorie sweeteners)
“I don’t need to add
I prefer the taste of sugar* Only asked of those who use sugar
sweetness” is down from
Only asked of those who don’t use
78% in 2019 to 64% in
I don’t need to add sweetness any sugar or low/no calorie sweeteners
2020
I don’t like the taste of low-calorie sweeteners
“I think low-calorie
I think low-calorie sweeteners are unhealthy sweeteners are
unhealthy” is down from
I consume low- or no-calorie sweeteners in packaged products, but
don’t add more myself 73% in 2019 to 63% in
2020
Advice from my healthcare professional
Major Reason Minor Reason Trend vs. 2019
I follow a diet that forbids low and no calorie sweeteners Of those who don’t use either sugar
or low/no calorie sweeteners:
*New in 2020 0% 20% 40% 60% 80% 100%
Q41 (REVISED TREND): Why (don't you use/do you not prefer to use) any type of low or no calorie sweeteners (ex. aspartame, sucralose, stevia leaf extract) to
sweeten your foods and\or beverages? (Of those less likely to use low or no calorie sweeteners, n=669) foodinsight.org | 524 in 10 consumers consider total sugars and added sugars equally
important information on labels
More consumers say they would consider total sugars than do added sugars specifically
Information Most Likely to Consider
Related to Sugar Content When Shopping
Total sugars
Added sugars
48% of women say total
sugars and added sugars are
Both are equally important to me equally important when
shopping for packaged
I don't consider the sugar content products (vs. 39% of men)
when shopping
Not sure
0% 20% 40%
Q44: One of the changes on the new Nutrition Facts label is that “added sugars” is identified separately from “total sugars.” When shopping for packaged foods and
beverages, which information on the Nutrition Facts label are you most likely to consider related to sugar content? (n=1,011) foodinsight.org | 53More consumers see added sugars as having a significant impact
on their health vs. naturally-occurring sugars
While 37% see added sugars as having a major impact (5 of 5) on their health, 49% of consumers who have
only close to 1 in 5 (18%) say the same about naturally occurring sugars tried a diet in the past year say
the amount of naturally-occurring
Level of Impact on Health sugars consumed has an impact
on health (vs. 38% who haven’t)
5 - A major impact on health 4 3 2 1 - No impact Not sure
68% of non-Hispanic whites say
the amount of added sugars
The amount of naturally-occurring sugars consumed has an impact on
consumed health (vs. 55% of African
Americans)
71% of consumers with a
The amount of added sugars consumed college degree say the amount of
added sugars consumed has an
impact on health (vs. 62% with
0% 20% 40% 60% 80% 100% less than a college degree)
Q43: How much of an impact do you think the following have on your health? (n=1,011) foodinsight.org | 54Food Production
foodinsight.org | 55The influence of these food production factors has
remained stable from 2019
51% of parents with
More than half say knowing where the food comes from is an important factor childrenThe importance of sustainability has remained the same vs.
2019, even though it is slightly more of a factor for purchases
Those who are following a diet are more likely to also consider environmental sustainability
important
Perceived Factors to Know if a Product is Produced in an
Importance of Environmental Sustainability
Environmentally Sustainable Way (Of those who say it’s
in Food Products Purchased
important their food be produced sustainably)
Labeled as sustainably sourced
Recyclable packaging
Labeled as non-GMO*
No change 59% Labeled as being locally grown
from 2019 Important Labeled as organic
Minimal packaging
Labeled as bioengineered/containing bioengineered
ingredients*
Very important Somewhat important Other
Neither important nor unimportant Not very important
None of the above
Not at all important Don’t know enough to form an opinion
*New in 2020
0% 20% 40% 60%
Q46 (TREND): How important is it to you that the food products you purchase or consume are produced in an environmentally sustainable wa y? (n=1,011)
Q47 (REVISED TREND): You mentioned that it is important to you that food products are produced in an environmentally sustainable way. When shopping for foods and
beverages, which of the following do you look for as a way to know that a product is produced in an environmentally sustainab le way? Select all that apply. (Of those foodinsight.org | 57
who say it’s important their food be produced sustainably, n=565)As in 2019, more than 6 in 10 find it hard to know whether
their food choices are environmentally sustainable
Of those who agree with this sustainability confusion, 7 in 10 say it would influence their decisions more if
it was easier to know
Agree or Disagree: No change Agree or Disagree:
“It is hard for consumers to know whether the food in agreement for
either statements “If it was easier to know whether my food choices were
choices they make are environmentally sustainable”
since 2019 environmentally sustainable, it would have a greater influence
on the choices I make” (Of those who agree it is hard to know)
63%
Strongly/ 69%
Somewhat
Agree strongly agree
Agree strongly Strongly/
Somewhat
agree
Somewhat agree
67% of women agree Somewhat agree
(vs. 59% of men)
Neither agree nor disagree Neither agree nor disagree
68% of consumers with 76% of those who
Somewhat disagree Somewhat disagree
have tried a diet
12% spouses/partners agree (vs. 11%
agree (vs. 62% who
Somewhat/ Somewhat/
Strongly 57% of single consumers) Strongly
haven’t)
disagree disagree
Disagree strongly Disagree strongly
0% 20% 40% 60% 0% 20% 40% 60%
Q4 (TREND): Do you agree or disagree with the following statement? It is hard for consumers to know whether the food choices they make are
environmentally sustainable.” (n=1,011)
Q5 (TREND): Do you agree or disagree with the following statement? “If it was easier to know whether my food choices were environmentally sustainable, it foodinsight.org | 58
would have a greater influence on the choices I make.” (Of those who agree is it hard to know, n=646)Familiarity with regenerative agriculture is up significantly
Younger consumers are much more likely to have heard of the concept
Familiarity and Interest in Regenerative Agriculture
Familiarity is up
60%
from 2019 (22%)
Regenerative
50% Agriculture
NET familiarity: 36% 71% of consumers ages 50+
40% NET interest: 57% have not heard of regenerative
agriculture (vs. 57% under age 35)
30%
20%
44% of consumers who grocery
shop online at least once a month
10%
have heard of regenerative
agriculture (vs. 29% who never
0%
shop online)
I have heard of it, and I am I have heard of it, but I do not I have not heard of it, but I am I have not heard of it, and I do
interested in learning more want to learn more interested in learning more not want to learn more
Q48 (REVISED TREND): Which of the following best describes your familiarity and interest in the practices of “regenerative agriculture” (e.g., a gricultural
practices that seek to maintain and enhance the health of the soil)? (n=1,011) foodinsight.org | 59“Natural” label is most influential both when shopping and when
purchasing food prepared outside the home
The influence of each label has remained stable vs. what was observed in 2019
Shopping for food and beverages
Labels That Influence Purchasing Eating away from home
0% 10% 20% 30% 40% 50% 0% 10% 20% 30% 40% 50%
Natural Clean ingredients*
No added hormones or steroids Environmentally friendly
Plant-based*
Non-GMO
Sustainably sourced
Organic
Bioengineered/containing bioengineered ingredients*
Raised without antibiotics
Made using regenerative agriculture*
Locally-sourced N/A
Being made in a way that minimizes food waste
Pesticide-free Other*
Recyclable packaging None of the above
N/A
*New in 2020
Q49 (REVISED TREND): Which of the following, if any, do you do on a regular basis (that is, most times when you shop for foods and beverages)? Select all that apply.
Buy foods and beverages because they are advertised on the label as…(Split Sample A, n=498)
Q50 (REVISED TREND): Which of the following, if any, do you do on a regular basis (that is, most times when you eat away from home)? Select all that apply. Buy food foodinsight.org | 60
prepared outside your home (such as at a restaurant or ordered for takeout/delivery) because they advertised their foods and beverages as… (Split Sample B, n=513)Confidence as a result of antibiotics regulation has not changed
since 2019
Nearly 6 in 10 feel more confident as a result of prohibiting growth-promotion uses of antibiotics
Change in Confidence Since Regulation of Antibiotics
Three years ago, the US Food and Drug Administration
prohibited growth-promotion uses of antibiotics and
now only allows antibiotics to fight illness in animals 65% of consumers with a
producing food. college degree feel more
confident (vs. 55% with less than a
How does this change impact your level of confidence
in purchasing meat, poultry, egg, and milk products?
58% college degree)
Are you…? More
Confident
A lot more confident 65% of consumers who have
Somewhat more confident tried a diet in the past year feel
No change more confident (vs. 53% who
Somewhat less confident haven’t)
A lot less confident No change from
2019 (57%)
Q51 (TREND): Three years ago, the US Food and Drug Administration prohibited growth-promotion uses of antibiotics and now only allows antibiotics to fight illness
foodinsight.org | 61
in animals producing food…How does this change impact your level of confidence in purchasing meat, poultry, egg, and milk pro ducts? Are you…? (n=1,011)Veterinarian oversight also increases confidence for over half
Dieters are more likely to express greater confidence as a result of the oversight
Change in Confidence Regarding Veterinarian Oversight
As part of this US Food and Drug Administration
regulation on the use of antibiotics in animals
producing food, it is required that a veterinarian 64% of consumers who have
oversee the usage of antibiotics to fight illness in the tried a diet in the past year feel
animals.
more confident (vs. 53% who
How does this veterinarian oversight on the usage of
antibiotics to fight illness impact your level of
58% haven’t)
confidence in purchasing meat, poultry, egg, and milk More
products? Are you…?
Confident 24% of parents with children
A lot more confident
under 18 indicate that they are
Somewhat more confident
less confident (vs. 11% without
No change
children)
Somewhat less confident
A lot less confident
Q52: How does this veterinarian oversight on the usage of antibiotics to fight illness impact your level of confidence in purchasing meat, poultry, egg, and
milk products? Are you…? (n=1,011) foodinsight.org | 62Consumers are split on whether a BE label would affect their
decision to purchase a product they had previously enjoyed
Consumers under age 50 are significantly more likely to continue purchasing the product vs. those 50+
Reaction to Seeing a Bioengineered Label on a Previously Purchased Product
Would definitely continue purchasing the product 33% 40% of consumers under 50
Would Continue
Purchasing indicate that they would continue
Would likely continue purchasing the product purchasing the product (vs. 25%
ages 50+)
Would likely stop purchasing the product
35%
Would Stop 39% of consumers with a
Would definitely stop purchasing the product Purchasing
college degree indicate that they
would continue purchasing the
Not sure/it depends product (vs. 30% with less than a
college degree)
0% 20% 40%
Q53: Over the next year you may see new labeling on foods and beverages indicating that it is bioengineered or contains bioen gineered
ingredients. If you saw this label on a product that you have previously purchased and enjoyed, what would be your reaction? (n=1,011)
foodinsight.org | 63Consumers perceive health differences in products even if they
have the same Nutrition Facts Panel Highly likely that Product A healthier
Fresh and “all natural” products garner healthier images, as does “plant-based foods”
Somewhat likely that Product A
healthier
If Two Products Have the Same Nutrition Facts Highly likely that Product B healthier
Panel, Which is Healthier? Somewhat likely that Product B
healthier
Product A is a fresh product and Product B is frozen
Product A is described as "all natural" on the label and Product B is not
Product A is described as a "plant-based food" on the label
and Product B is not*
Product A is produced in a more environmentally sustainable
way than Product B
Product A is produced using newer technology than Product B
Product A has a longer list of ingredients than Product B*
Product A is described as a "bioengineered food/containing bioengineered
ingredients" on the label and Product B is not**
Product A contains artificial ingredients and Product B does not*
-60%
60% -40%
40% -20%
20% 0%0% 20%20% 40% 40% 60% 60%
*New in 2020
**Revised in 2020
Q14 (TREND): Please consider the following food purchasing situation: Imagine you came across two food products that had the exact same Nutrition Facts panel (see
below). Would any of the following details lead you to believe that one of the products was more likely to be healthier? (n=1 ,011)
foodinsight.org | 64You can also read