Application of skimmed milk freeze concentrated in production of ice cream: physical, chemical, structural and rheological properties - SciELO
←
→
Page content transcription
If your browser does not render page correctly, please read the page content below
a ISSN 0101-2061 (Print) Food Science and Technology ISSN 1678-457X (Online) DOI: https://doi.org/10.1590/fst.12221 Application of skimmed milk freeze concentrated in production of ice cream: physical, chemical, structural and rheological properties Callebe CAMELO-SILVA1 , Eulália Lopes da Silva BARROS1, Maria Helena Machado CANELLA2, Silvani VERRUCK2, Amanda Alves PRESTES1, Maryella Osório VARGAS2, Bruna Marchesan MARAN3, Erick Almeida ESMERINO4, Ramon SILVA4, Celso Fasura BALTHAZAR4, Veronica Maria de Araujo CALADO5, Elane Schwinden PRUDÊNCIO1,2* Abstract Freeze concentration process was used to concentrate milk until the third stage of freeze concentration. Thus, two samples of ice creams were manufacture, one with milk and the other with concentrated milk from the first stage of block freeze concentration, and denominated ice cream 1 and ice cream 2, respectively. Both ice creams were characterized according to physicochemical characteristics, overrun, microscopy, melting rate, texture, color, and rheological properties. The use of concentrated milk influenced the physicochemical properties of ice cream 2, promoting an increase in the total solids, protein, carbohydrates, and ashes content. Moreover, it was noted that ice cream 2 had a higher overrun, lower firmness, smaller ice crystals, and tended to color greenish and yellowish, however had a higher melting rate and larger hysteresis area. The models of the Power Law and Casson satisfactorily described the rheological behavior of ice creams, which proved to be a Newtonian fluid. Keywords: concentrated milk; ice cream; physical properties; rheology; power law model; casson model. Practical Application: The potential use of concentrated skimmed milk in the manufacture of ice cream. 1 Introduction Ice cream is considered the most known milk dessert 2009). The principle of this method is based on the complete worldwide, reaching a global consumption of 2 L per person/ freezing of a solution, followed by a partial thawing process. With year (Góral et al., 2018). This food is a complex aerated emulsion this method, it is possible to obtain two fractions: the first is a containing milk proteins and fats that have an important role concentrated solution (feed solution) and the second is an ice in stabilizing its structure. This matrix is formed by a frozen fraction with minimum solids content. In addition, the process phase containing air bubbles, fat particles, and ice crystals can be repeated in successive stages to increase the concentration (Balthazar et al., 2017; Ayed et al., 2018; Grigio et al., 2019). efficiency. Therefore, the efficiency of the process depends mainly According to Góral et al. (2018), the primary ingredient in ice on the purity of the ice fraction (Aider et al., 2009). cream is cow’s milk, which contains several beneficial substances It has been verified by Balde & Aider (2016) that the process for the human body, such as protein, fat, lactose, vitamins, and of freeze concentration was able to modify the availability of milk mineral compounds. components, such as proteins, fats, ashes, and carbohydrates. To concentrate these milk substances, the technology of Thus, it is hypothesized that the use of concentrated influences freeze concentration stands out, since it is known as the best the physical and physicochemical properties of ice cream. concentration method in terms of preserving the original quality Thus, it is important to determine these properties for a better of the product. Therefore, this technology uses low temperatures understanding of the changes that occur in the product due to during the process, avoiding undesirable chemical, physical the interaction between milk components and the ingredients and biological changes that occur in other types of processing used in the formulation. In addition, the determination of these (Gunathilake et al., 2014). There are different methods of freeze properties will serve as support to researchers and industries that want to employ concentrated milk in the production of ice cream. concentration, such as progressive, suspension, and block freeze concentration (Ding et al., 2019; Henao-Ardila et al., 2019), In this context, in order to produce ice cream with higher however, the first and second are more complex systems. Thus, nutritional value and better physical properties, the method it favors the use of block freeze concentration, because it has of block freeze concentration was used. Thus, the objective of easier handling and also, is economically more viable (Aider et al., this work was to employ the concentrated milk obtained from Received 01 Mar., 2021 Accepted 02 Mar., 2021 1 Programa de Pós-graduação em Engenharia de Alimentos, Universidade Federal de Santa Catarina – UFSC, Florianópolis, SC, Brasil 2 Departamento de Ciência e Tecnologia de Alimentos, Universidade Federal de Santa Catarina – UFSC, Florianópolis, SC, Brasil 3 Departamento de Engenharia Química e Engenharia de Alimentos, Universidade Federal de Santa Catarina – UFSC, Florianópolis, SC, Brasil 4 Faculdade de Veterinária, Universidade Federal Fluminense – UFF, Niterói, RJ, Brasil 5 Escola de Química, Universidade Federal do Rio de Janeiro – UFRJ, Rio de Janeiro, RJ, Brasil *Corresponding author: elane.prudencio@ufsc.br Food Sci. Technol, Campinas, Ahead of Print, 2021 1/9 1
Concentrated skimmed milk ice cream the process of block freeze concentration to produce ice cream, for 30 minutes, followed by cooling at 8 ± 2 °C for 24 h. The ice as well as to evaluate its chemical, physical, rheological, and creams were subjected to a stirring operation realized in an microstructural properties. ice cream maker (Cuisinart ICE 21, New Jersey, USA). In the sequence, the formulations were distributed in polyethylene 2 Material and Methods packages with a capacity of 500 mL and subjected to freezing at −20 ± 2 ºC until the analyses. 2.1 Material For the production of concentrated milk it was used skimmed 2.4 Physicochemical analysis milk (Tirol, Treze Tílias, SC, Brazil) with carbohydrate, protein, The total solids content (g/100 g) of skimmed milk, concentrated lipid and total solids contents of 4.5, 3.15, 0.0, and 8.05 g per milk (1, 2, 3), concentrated ice (1, 2, 3), and in the ice creams 100 mL of skimmed milk, respectively. This same milk was used were obtained by the oven drying method until constant weight to manufacture the ice creams, besides other ingredients like at 105 ± 2 ºC (Association of Official Analytical Chemists, sucrose (União, São Paulo, SP, Brazil), milk cream (45% fat, 2019). The skimmed milk, the best performing concentrate, Tirol, Treze Tílias, SC, Brazil), and sodium chloride (Cristalino, and ice creams were analyzed in relation to the protein content Mossoró, RN, Brazil) were used. All the chemicals used were (g/100 g) by the Kjeldahl method (N x 6.38) (Association of of analytical grade. Official Analytical Chemists, 2019), fat content (g/100 g) by the soxhlet method (Association of Official Analytical Chemists, 2.2 Freeze concentration procedure 2019), ashes (g/100 g) by the gravimetric method (Association The block freeze concentration technology was used for the of Official Analytical Chemists, 2019), total carbohydrate skimmed milk concentration, according to the methodology content (g/100 g) obtained by difference (Association of Official established by the research group. This method is based on the Analytical Chemists, 2019), total titratable acidity (g/100 g lactic total freezing of a solution and its subsequent partial thawing acid) (Association of Official Analytical Chemists, 2019) and pH using a pHmeter (PHS−3 BW, BEL, Piracicaba, São Paulo, by simple gravitational separation. With this, at the end of SP, Brazil). All physicochemical analyzes were done in triplicate. each stage it is possible to obtain two fractions denominated concentrated fluid (Cn) and concentrated ice (In), respectively (Figure 1). Firstly, the skimmed milk was distributed in batches 2.5 Physical measurements of 1 L, which were divided into 250 mL containers and subjected 2.5.1 Overrun analysis to freezing −20 ± 2 °C in a freezer (Electrolux, FE 18, São Carlos, SP, Brazil). Once the initial solution was completely frozen, 50% Ice cream overrun was determined according to the of its initial volume was thawed at a controlled temperature of methodology described by Marshall et al. (2003). For this, 120 g 20 ± 2 °C. The thawed liquid constitutes the concentrated of the of ice cream mixture and another of ice cream were weighed first freeze concentration stage, which was distributed again in 250 mL containers, frozen −20 ± 2 °C, and subsequently used Table 1. Ingredients used to produce the ice cream from skimmed milk as feed solution in the second stage of freeze concentration. (Ice cream 1) and concentrated milk (Ice cream 2). This procedure was performed until the third stage of freeze Ingredients (g/100 g) Ice cream 1 Ice cream 2 concentration. At the end of each stage of the freeze concentration Skimmed milk 61.70 - process, an aliquot of the remaining concentrates and the ice Concentrated milk - 61.70 were collected and stored at −20 ± 2 °C for future analyzes. Sucrose 22.20 22.20 The efficiency of the freeze concentration process (PE) was Milk cream 16.04 16.04 determined taking into account the increase in the total solids Sodium chloride 0.06 0.06 content (TS) in the concentrated (Cn) (g/100 g) in relation to the Total of ingredients 100.00 100.00 total solids (TS) remaining in the concentrated ice (In) (g/100 g) of each freeze concentration stage according to Equation 1. The concentrated milk used to produce the ice cream was chosen from the results of PE. TS no Cn − TS no I n =PE ( % ) ×100 (1) TS no Cn 2.3 Ice cream manufacture Two ice creams were manufactured and denominated as ice cream 1 and ice cream 2. Ice cream 1 was prepared with skimmed milk, and ice cream 2 was prepared with concentrated milk. Both formulations were added with sucrose, milk cream, and sodium chloride, as showed in Table 1. Firstly, the ingredients were mixed and submitted to the thermal treatment at 70 ± 2 °C Figure 1. Diagram of the process of freeze concentration of skimmed milk. 2 2/9 Food Sci. Technol, Campinas, Ahead of Print, 2021
Camelo-Silva et al. and the overrun was calculated using Equation 2. The analysis ∆E* = ( ∆L* ) 2 + ( ∆a * ) 2 + ( ∆b* ) 2 (3) was performed in triplicate. Where ΔL* is the luminosity difference, while Δa* represents the weight of the ice cream mix − weight of the ice cream Overrun ( % ) = weight of the ice cream x100 (2) intensity of the red color and Δb* the intensity of the yellow color. 2.5.6 Rheological analysis 2.5.2 Distribution of ice crystals, fat particle, and air bubbles size The rheological analysis of ice creams were determined on a Brookfield rotational rheometer with concentric cylinders The ice crystals, fat particles, and air bubbles size were (Brookfield Engineering Laboratories, model DVIII Ultra, determined according to the Balthazar et al. (2017), using optical Stoughton, USA) and spindle ULA. The measurements were light microscopy (AXIO Image. A2m, Carl Zeiss, Germany) collected using Rheocalc 32 software version 3.2 (Brookfield at −4 ± 2 °C using 50 × magnification. Samples were moved Engineering Laboratories, Inc., Middleboro, MA, USA). directly from the freezer to the glove box (−4 ± 2 °C) for The rheometer was thermostatically controlled by a water bath sample preparation. A drop of chilled kerosene was added to (TECNAL model TE−184, São Paulo, SP, Brazil) at 4.0 ± 0.1 ºC. aid in dispersing the ice crystals and to increase the resolution Two rheological measurements were taken to obtain the flow of the generated image. Ice crystals, fat particles, and air curves: the first with increasing shear rate from 125 s−1 to 269 s−1 in bubbles images were captured by a digital camera (Axio Cam the first 4 minutes (rising curve), and the second with decreasing MRc 5, Zeiss, Germany) and edited using the AXIO Vision shear rate returning to 125 s−1 the over the following 4 minutes Rel. 4.8 software (Microscope Software AxioVision LE, Zeiss, (downward curve). The speed of rotation was increased from Germany). For each sample, 20 structures were measured (μm) 2 rpm to 62 rpm, increasing at 2 rpm per 30 s. The behavior in 10 microscope spots. of the flow was described by Power Law and Casson models, according to Equations 4 and 5, respectively: 2.5.3 Melting properties The melting of the ice creams was determined according to σ =K ( γ ) n (4) the methodology of Granger et al. (2005), with modifications. Approximately 50 g of sample, initially at −18 ± 2 ºC were allowed to melt at 25 ± 2 ºC cover a 2 mm aperture wire mesh σ 0.5 = σ 00.5 + (ηc γ )0.5 (5) screen, above a graduated cylinder, which was about an analytical balance. The mass of drained ice cream (g) was recorded every where σ is the shear stress (Pa); K the consistency index (Pa s−1); five minutes. From the data obtained, the melting rate was γ is the rate of deformation (s−1); n is the flow behavior index measured as the mass of the drip versus the time. The analysis (dimensionless); σ 0 is the Casson yield stress (Pa) and is the was performed in triplicate. Casson viscosity (Pa.s). 2.5.4 Texture analysis 2.6 Statistical analysis Ice creams texture analyss were measured using a TA.HD. Statistical analysis was performed using STATISTICA plus model texturometer (Stable Micro System, Texture 13.3 software (TIBCO Software Inc., Palo Alto, CA). Tukey test Expert, Surrey, UK), operating with the Exponent program was realized to determine the significant differences (p < 0.05) version 6.1.1.0. Ice cream samples were stored at –18 ± 2 °C for between the samples. Data were presented as mean ± standard 24 h before texture analysis. The operation parameters of the deviation. analysis were: test speed of 2.0 mm/s; a distance of 10.0 mm, and height of 20 mm. The parameters obtained were: firmness 3 Results and discussion (N), adhesiveness (N.s), and gumminess (N). The analysis was repeated five times for each sample. 3.1 Freeze concentration procedure The total solids content and the efficiency of the skimmed 2.5.5 Color analysis milk freeze concentration process are shown in Table 2. It was verified an increase (p < 0.05) of total solids for concentrated The color analysis of the ice creams were determined using milk and concentrated ice fractions as a function of the evolution the Minolta Chroma Meter CR−400 colorimeter (Konica Minolta, of the freeze concentration stage. On the other hand, it was Osaka, Japan), adjusted to operate with illuminant D65 and observed that the process efficiency was higher (p < 0.05) in the 10° angle observation. Firstly, the colorimeter was calibrated first freeze concentration stage, indicating higher total solids with a standard whiteboard, and to measure the parameters content in the concentrated milk fraction. These results are in L*, a*, and b* was used the CIELab color scale. The total color accordance with those of Canella et al. (2019), which obtained difference (ΔE*) between ice creams was determined according higher separation efficiency of total solids goat milk in the first to Okpala et al. (2010), as described in Equation 3. The analysis freeze concentration stage, resulting in a high quality concentrated. was performed in triplicate. These results indicated a greater recovery of solids content in the Food Sci. Technol, Campinas, Ahead of Print, 2021 3/9 3
Concentrated skimmed milk ice cream Table 2. Total solids content of skimmed milk, concentrated milks (C1, C2 and C3) and concentrated ices (I1, I2 and I3) from each stage of the freeze concentration process and the efficiency of the process (PE) in relation to the total solids content. Total solids (g/100 g) PE (%) Skimmed milk 8.05 ± 0.22dB - Stage 1 C1 10.27 ± 0.10c 90.84 ± 0.03⁎ I1 0.94 ± 0.01C - Stage 2 C2 20.28 ± 0.15b 60.62 ± 2.07◊ I2 7.99 ± 0.41B - Stage 3 C3 21.52 ± 0.18a 23.05 ± 0.28• I3 16.56 ± 0.12A - Results expressed as mean ± standard deviation; a-d Within a column, different superscript lowercase letters denote significant differences (p < 0.05) between skimmed milk and concentrated milks at each stage of freeze concentration; A-C Within a column, different superscript uppercase letters denote significant differences (p < 0.05) between skimmed milk and concentrated ice at each stage of freeze concentration; (⁎ ◊ •) Within a column, different symbols denote significant differences (p < 0.05) in the PE of each stage of freeze concentration. Table 3. Physicochemical properties of skimmed milk, concentrated milk, and of the ice creams produced from skimmed milk (Ice cream 1) and concentrated milk (Ice cream 2). Analyzes Skimmed milk Concentrated milk Ice cream 1 Ice cream 2 Total solids (g/100 g) 8.05 ± 0.22 10.27 ± 0.01 33.82 ± 0.07b 37.30 ± 0.6a Protein (g/100 g) 3.15 ± 0.02 7.07 ± 0.40 2.43 ± 0.1b 4.92 ± 0.1a Fat (g/100 g) 0.16 ± 0.01 0.18 ± 0.05 6.80 ± 0.61a 7.13 ± 0.06a Ashes (g/100 g) 0.39 ± 0.03 1.29 ± 0.19 0.61 ± 0.02b 1.09 ± 0.01a Carbohydrates (g/100 g) 4.35 ± 0.01 1.73 ± 0.01 23.98 ± 0.01b 24.16 ± 0.02a pH 6.81 ± 0.02 6.66 ± 0.01 6.72 ± 0.02a 6.65 ± 0.01b Total titratable acidity (g/100 g lactic acid) 0.20 ± 0.01 0.53 ± 0.01 0.17 ± 0.01b 0.29 ± 0.03a Results expressed as mean ± standard deviation; a-b Within a line, different superscript lowercase letters denote significant differences (p < 0.05) between the ice cream samples. first freeze concentration stage. However, the process efficiency ice cream 2 was higher (p < 0.05) than ice cream 1 (Table 3), in the second and third freeze concentration stage decreased which is the typical range reported for ice creams in many studies significantly, indicating that a relatively large content of total (Cruxen et al., 2017; Senaka Ranadheera et al., 2013; Silva et al., solids was retained in the concentrated ice fraction. Sánchez et al. 2015). A higher value in protein content in ice cream 2 contributes (2011) and Raventós et al. (2007) affirmed that with the total significantly to the development of the structure of ice cream solids content increases, the viscosity of the concentrated since milk proteins contribute to air stabilization at the ice cream solution also increases, and due to the increased viscosity of the interface, emulsification, and water holding capacity, as verified concentrated solution, solids tend to accumulate at the ice-liquid by Patel et al. (2006). The ash content for both ice creams was interface (concentration polarization) and the diffusion of these similar to Cruxen et al. (2017) when worked with probiotic solids between the interface is slower, causing these solids being ice cream added with butiá pulp. The carbohydrate content retained in the ice fraction and thus contributing to reducing was similar to those of Di Criscio et al. (2010) when studying the efficiency of the freeze concentration process. Therefore, symbiotic ice cream added inulin and Lacticaseibacillus casei and the concentrated milk of the first stage of freeze concentration Lacticaseibacillus rhamnosus. The pH value w as higher (p < 0.05) was used in the manufacture of ice cream, as it presented higher for ice cream 1. Thus, Marshall et al. (2003) mentioned that the process efficiency. total titratable acidity and pH value of ice cream are related to the total solids content because an increase in total solids 3.2 Physicochemical analysis promotes an increase in acidity, and decreases pH, as verified in the present work. Mostafavi et al. (2017) confirmed that the Table 3 shows the results of the physicochemical properties total titratable acidity of milk depends on the nitrogen values o f of skimmed milk, concentrated milk, and ice creams. It was casein, albumin, phosphates, citrates, carbon dioxide, and when observed that ice cream 2 had a higher (p < 0.05) content of the protein content of ice cream increases, the nitrogen content total solids, proteins, ashes, and carbohydrates than ice cream increases causing an increase in the value of total titratable acidity, 1. However, there was no difference (p > 0.05) in lipid content confirming the higher value of total titratable acidity (p < 0.05) between the ice creams. This behavior could be explained by for the ice cream 2 determined in this study. the use of skimmed milk in the manufacture of the ice creams, and the amount of fat added during the formulation was the 3.3 Overrun analysis same in both ice creams. The higher value of total solids content, proteins, ashes, and carbohydrates for ice cream 2 was expected Table 4 shows that ice cream 2 had a higher (p < 0.05) due to the concentration method used in the milk. The total solids overrun value than ice cream 1. This event can be attributed to contents found in this work for ice creams are in agreement with the physicochemical composition of the ice cream 2, especially those obtained by Mostafavi et al. (2017) for low-fat ice creams the protein content, which was higher (p < 0.05) for the ice containing milk protein concentrated. The protein content of cream produced with the concentrated milk of the first stage of 4 4/9 Food Sci. Technol, Campinas, Ahead of Print, 2021
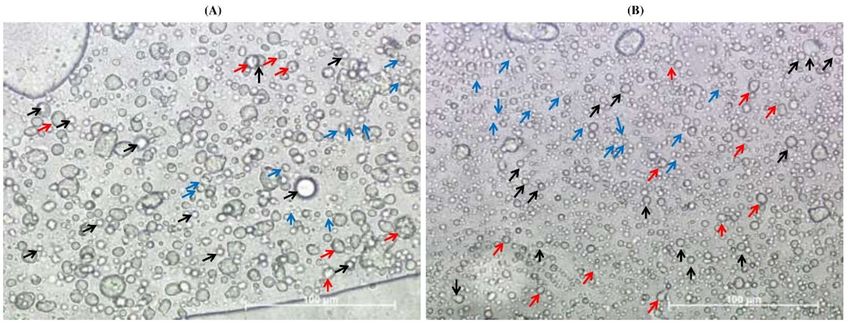
Camelo-Silva et al.

Figure 2. Distribution of ice crystals, fat particles, and air bubbles of the ice creams produced from skimmed milk (Ice cream 1) and concentrated
milk (Ice cream 2). (A) = Ice Cream 1. (B) = Ice Cream 2. Black arrows represent air bubbles; Blue arrows represent fat particles; Arrows in red
represent ice crystals.

 freeze concentration. It was noted by Huppertz (2010) that milk
 proteins have high air retention capacity, thus providing a greater
 overrun. Góral et al. (2018) verified that the low overrun in the
 ice cream was due to the low protein content in the samples.
 On the other hand, the overrun is also related to the melting
 rate, since was confirmed by Senanayake et al. (2013) that fruit
 ice creams with a low percentage of overrun tend to have a lower
 melting rate, as confirmed in the present work. Similar results
 were observed by Soukoulis et al. (2008) for vanilla ice cream
 added with hydrocolloids and their blends with κ-carrageenan.

 3.4 Distribution of ice crystals, fat particle, and air bubbles
 size
Figure 3. Melting rate of the ice creams produced from skimmed milk Table 4 and Figure 2 show the size and distribution of ice
(Ice cream 1) and concentrated milk (Ice cream 2). ◊ = Ice cream 1. crystals, fat particles, and air bubbles, respectively. It can be
□ = Ice cream 2. observed that ice cream 1 presented a larger size of ice crystals
 (p < 0.05). According to Kamińska-Dwórznicka et al. (2019), ice
 crystals should be less than 50 μm to avoid consumer rejection,
Table 4. Physical properties and parameter color (L*, a*, b*, and
ΔE) of ice creams produced from skimmed milk (Ice cream 1) and thus, sizes smaller than this value were observed for both ice
concentrated milk (Ice cream 2). creams. This difference in ice crystal size can be attributed to the
 protein content because it was verified by Lomolino et al. (2020)
 Ice cream 1 Ice cream 2 that ice cream samples which contain a higher amount of milk
 Overrun (%) 26.96 ± 0.85b 63.71 ± 6.89a protein, either in powdered or concentrated form and combined
 Ice crystals (μm2) 43.75 ± 16.45a 16.99 ± 7.37b with a polysaccharide-rich stabilizer, favored the development of
 Fat particle (μm) 2.52 ± 0.71a 1.82 ± 0.32a smaller ice crystals in ice cream during freezing. Balthazar et al.
 Air bubbles (μm) 3.90 ± 1.40a 3.24 ± 0.94a (2017) noted similar ice crystal sizes for sheep milk ice cream.
 Firmness (N) 29.55 ± 6.16a 5.88 ± 1.46b Concerning fat particle size and air bubble diameter, there was
 Adhesiveness (N s) –1.55 ± 0.47a –1.39 ± 0.50a no difference (p > 0.05) between the samples.
 Gumminess (N) 1.21 ± 0.20a 0.55 ± 0.07b
 L* 83.77 ± 0.43b 84.95 ± 0.63a 3.5 Melting properties
 a* –2.87 ± 0.03b –3.79 ± 0.04a
 b* 14.31 ± 0.11b 15.90 ± 0.39a It was observed that ice cream 2 showed a higher (p < 0.05)
 ΔE 2.17 melting rate than ice cream 1 (Figure 3). Kalicka et al. (2019)
Results expressed as mean ± standard deviation; a-b Within a line, different superscript defined that the melting is the degree to which the sample resists
lowercase letters denote significant differences (p < 0.05) between the ice cream samples. flow under an applied force in the mouth. Sofjan & Hartel

Food Sci. Technol, Campinas, Ahead of Print, 2021 5/9 5
Concentrated skimmed milk ice cream (2004) affirmed that ice cream melting rate could be influenced parameters, statistical differences were detected between ice creams by many factors including the overrun, total solids, ice crystal 1 and 2, being that their negative and positive values indicated a size, lipid, and protein content. Muse & Hartel (2004) reported tendency to green and yellow, respectively. Nozière et al. (2006) that initially the ice melts outside the ice cream and there is a cited that the green color is due to riboflavin (vitamin B2), a green local cooling effect. Melted ice water diffuses into the viscous compound present in the aqueous phase of milk and that the phase, and this diluted solution flows down (due to gravity) fat-soluble pigments, especially β-carotene, are responsible for through the structural elements (destabilized fat particles, air the yellowish coloration of milk. Balde & Aider (2016) verified cells, and remaining ice crystals). Senanayake et al. (2013) also this same coloration trend in all parameters for skimmed milk attributed the higher melting rate due to the high total solids obtained from the freeze concentration process. Therefore, it content and lower pH value, which favored the destabilization of was perceptible that the block freeze concentration process had the foam in fruit ice cream. Thus, this event may have occurred a great influence on the concentration of the compounds that in this work, since ice cream 2 had higher total solids content are responsible for the color change of the ice cream since all the and lower pH value. color parameters of ice cream 2 were statistically different to ice cream 1. Despite the differences between a* and b* parameters, 3.6 Texture analysis it is important to highlight that both ice creams displayed low ΔE* values. Martínez-Cervera et al. (2011) reported that when Table 4 shows that the firmness of ice cream 1 was higher the value of the total color difference (ΔE*) is lower than 3 it (p < 0.05) than the ice cream 2. Mehditabar et al. (2019) and cannot be visually perceived by the human eye. Thus, it was Acu et al. (2021) stated that many ingredients adding in the possible to verify (Table 4) that the color of ice cream samples composition can modify the viscosity values of the ice creams. was not affected. According to Muse & Hartel (2004), several factors could affect the ice cream firmness parameter, such as the ice crystal size. 3.8 Rheological analysis Soukoulis et al. (2008) affirmed that instrumental firmness can be used as a measure of ice crystal growth since the number Figure 4 shows the viscosity versus shear rate for ice cream and size of ice crystals formed from the water available during 1 and 2. It was found that the viscosity remains constant with freezing influences the formation and growth of these crystals increasing shear rate in ice cream, demonstrating a Newtonian during storage. Akalin et al. (2018) attributed the higher firmness behavior for all samples. Newtonian behavior can also be evaluated to ice cream produced with different fibers due to the larger ice using data from the flow behavior index (n) (Table 5), since crystals and lower overrun. On the other hand, ice cream samples (n ≅ 1) it is characterized as Newtonian behavior. Ice cream showed no difference (p > 0.05) for the parameter adhesiveness. 2 had a higher (p < 0.05) viscosity (Figure 4; Table 5), this fact However, ice cream 1 showed a higher (p < 0.05) gumminess. is due to its higher (p < 0.05) total solids content. This behavior Dar & Light (2014) verified that increasing this parameter has is in accordance with those verified by Akin et al. (2007) and an undesirable effect on the appearance and texture of the ice cream, since after melting the ice cream in the mouth, there is a viscous sensation in the consumer’s taste. Knowing this and according to the results obtained in this study (Table 4), ice cream 2 presented a gumminess lower than ice cream 1, which is interesting to the consumer. 3.7 Color analysis Table 4 shows that the parameters L*, a*, and b* were all higher (p < 0.05) for the ice cream 2. The higher luminosity (L*) for ice cream 2 can be explained by having a higher (p < 0.05) protein content in the product. Balthazar et al. (2015) verified that casein micelles have an affinity with fat particles and when Figure 4. Viscosity versus deformation rate of the ice creams produced they interact, they are responsible for the diffusion of incident from skimmed milk (Ice cream 1) and concentrated milk (Ice cream 2). light with a consequent increase in L* values. Regarding a* and b* ◊ = Ice cream 1. □ = Ice cream 2 Table 5. Rheological parameters obtained using the Power Law (σ = K ( ̇)N) and Casson model ( 0.5 = 00.5+ ( ̇)0.5), viscosity and hysteresis area of the ice creams produced from skimmed milk (Ice cream 1) and concentrated milk (Ice cream 2). Models Viscosity Hysteresis area Sample Power Law Casson (mPa s) (unit) K (Pa sn) n R2 σ0 (Pa) ηc (Pa s) R2 Ice cream 1 0.0159 ± 0.0086 0.9815 ± 0.0577 a a 0.9982 0.0040 ± 0.0030 0.0111 ± 0.0008 b b 0.9979 11.00± 0.1866b 1.9863 ± 0.3587b Ice cream 2 0.0279 ± 0.0019a 0.9357 ± 0.0117a 0.9942 0.0188 ± 0.0037a 0.0169 ± 0.0003a 0.9923 20.00 ± 0.1208a 16.1921 ± 0.6701a Results expressed as mean ± standard deviation; a-b Within a column, different superscript lowercase letters denote significant differences (p < 0.05) between the ice cream samples. K, consistency index; n, flow behavior index; R2, determination coefficient; σ0, Casson yield stress; ηc, Casson viscosity. 6 6/9 Food Sci. Technol, Campinas, Ahead of Print, 2021
Camelo-Silva et al.

Dogan et al. (2013) for ice creams with different sugar levels data adjusted well into the Power Law and Casson models and
and xanthan gum, respectively. the ice creams showed a Newtonian fluid behavior.
 It was observed that the Power Law and Casson models Therefore, block freeze concentration showed to be a
described the rheological behavior of the ice cream satisfactorily, promising technology and can have the potential for use in the
since the correlation coefficient R2 > 0.99, in all cases (Table 5). ice cream producing industries, because it is a method of easy
When the Power Law model was used, there was no difference manipulation and low cost, resulting in a final product with good
(p > 0.05) between the ice cream for the consistency index (K) chemical, physical, rheological, and microstructural properties.
and flow behavior index (n). These results demonstrated that
the freeze concentration process did not alter the flow behavior Acknowledgements
and neither affected K and n parameters. Aime et al. (2001) also
mentioned that the consistency index (K) is strongly related to The authors are grateful to CAPES (Coordination of
the fat content of ice cream, once the increase in fat provides an Improvement of Higher Education Personnel, Finance code 001)
increase in the K value. No difference (p > 0.05) was founded in by scholarship and the CNPq (National Counsel of Technological
the fat content of both ice creams manufactured in the present and Scientific Development, process number 405965/2016-8)
study, confirming consistency index behavior. The rheological by the financial support.
parameters from the Casson model, Casson yield stress (σ0) and
Casson viscosity (ηc), were higher (p < 0.05) for ice cream 2. This References
result also can be explained because ice cream 2 has a higher Acu, M., Kinik, O., & Yerlikaya, O. (2021). Probiotic viability, viscosity,
(p < 0.05) viscosity. Similar behavior was verified by Pinto et al. hardness properties and sensorial quality of synbiotic ice creams
(2012) for frozen yogurt added inulin, which affirmed that the produced from goat’s milk. Food Science and Technology (Campinas),
increase in the value of the Casson parameters may have been 41(1), 167-173. http://dx.doi.org/10.1590/fst.39419.
caused by the increase of apparent viscosity of samples, which Aider, M., De Halleux, D., & Melnikova, I. (2009). Skim milk whey
probably occurred due to water retention by inulin. cryoconcentration and impact on the composition of the concentrated
 and ice fractions. Food and Bioprocess Technology, 2(1), 80-88. http://
 Ice cream 2 presented a higher (p < 0.05) hysteresis area,
 dx.doi.org/10.1007/s11947-007-0023-0.
indicating a change in the system structure, by the structural
break down in a dispersion under shear. This difference can Aime, D. B., Arntfield, S. D., Malcolmson, L. J., & Ryland, D. (2001).
 Textural analysis of fat reduced vanilla ice cream products. Food
be explained by the higher (p < 0.05) viscosity and total solids
 Research International, 34(2–3), 237-246. http://dx.doi.org/10.1016/
content of ice cream 2. Hernández (1996) emphasized that a S0963-9969(00)00160-5.
higher viscosity in a thixotropic fluid can demonstrate a larger
 Akalin, A. S., Kesenkas, H., Dinkci, N., Unal, G., Ozer, E., & Kinik, O.
hysteresis area than a less viscous fluid, even when occurs (2018). Enrichment of probiotic ice cream with different dietary
rupture in the less viscous fluid structure. Pinto et al. (2012) fibers: structural characteristics and culture viability. Journal of
affirmed that the increase in the hysteresis area may be related Dairy Science, 101(1), 37-46. http://dx.doi.org/10.3168/jds.2017-
to the increase in apparent viscosity of these samples for frozen 13468. PMid:29103712.
yogurt added inulin. Akin, M. B., Akin, M. S., & Kirmaci, Z. (2007). Effects of inulin and sugar
 levels on the viability of yogurt and probiotic bacteria and the physical
4 Conclusions and sensory characteristics in probiotic ice-cream. Food Chemistry,
 104(1), 93-99. http://dx.doi.org/10.1016/j.foodchem.2006.11.030.
 The freeze concentration process proved to be an alternative
 Association of Official Analytical Chemists – AOAC. (2019). Official
for milk concentration. The highest process efficiency was methods of analysis of the Association of Official Analytical Chemists.
verified in the first stage of freeze concentration. However, a Washington: AOAC
drastic reduction was noted in the second and third stages,
 Ayed, C., Martins, S. I. F. S., Williamson, A. M., & Guichard, E. (2018).
respectively. From the process efficiency results, the concentrated Understanding fat, proteins and saliva impact on aroma release from
milk from the first stage of freeze concentration was used in the flavoured ice creams. Food Chemistry, 267, 132-139. http://dx.doi.
manufacture of the ice cream. Ice cream 2, which was prepared org/10.1016/j.foodchem.2017.10.127. PMid:29934147.
with concentrated milk, had higher total solids, protein, ash, Balde, A., & Aider, M. (2016). Impact of cryoconcentration on casein
and carbohydrate content. On the other hand, there was no micelle size distribution, micelles inter-distance, and flow behavior
significant difference between samples for fat content. The use of skim milk during refrigerated storage. Innovative Food Science
of concentrated milk promoted an increase in acidity and a & Emerging Technologies, 34, 68-76. http://dx.doi.org/10.1016/j.
decrease in pH of ice cream 2, respectively. Higher luminosity ifset.2015.12.032.
and color tendency towards yellow and green were observed Balthazar, C. F., Gaze, L. V., Azevedo da Silva, H. L., Pereira, C. S.,
in ice cream 2. Franco, R. M., Conte-Júnior, C. A., de Freitas, M. Q., & de Oliveira
 Silva, A. C. (2015). Sensory evaluation of ovine milk yoghurt with
 Moreover, ice cream 2 had higher overrun, lower ice crystals, inulin addition. International Journal of Dairy Technology, 68(2),
lower firmness, and lower gumminess. However, ice cream 2 had 281-290. http://dx.doi.org/10.1111/1471-0307.12189.
a higher melting rate. Adhesiveness parameter, air bubble size, Balthazar, C. F., Silva, H. L. A., Vieira, A. H., Neto, R. P. C., Cappato,
and fat of ice cream showed no significant difference. The use L. P., Coimbra, P. T., Moraes, J., Andrade, M. M., Calado, V. M.
of concentrated milk caused an increase in the viscosity and A., Granato, D., Freitas, M. Q., Tavares, M. I. B., Raices, R. S. L.,
hysteresis area of ice cream 2. The rheological measurements Silva, M. C., & Cruz, A. G. (2017). Assessing the effects of different

Food Sci. Technol, Campinas, Ahead of Print, 2021 7/9 7
Concentrated skimmed milk ice cream

 prebiotic dietary oligosaccharides in sheep milk ice cream. Food Kalicka, D., Znamirowska, A., Pawlos, M., Buniowska, M., & Szajnar, K.
 Research International, 91, 38-46. http://dx.doi.org/10.1016/j. (2019). Physical and sensory characteristics and probiotic survival
 foodres.2016.11.008. PMid:28290325. in ice cream sweetened with various polyols. International Journal
Canella, M. H. M., Muñoz, I. B., Barros, E. L. S., Silva, C. C., Ploêncio, of Dairy Technology, 72(3), 456-465. http://dx.doi.org/10.1111/1471-
 L. A. S., Daguer, H., & Prudêncio, E. S. (2019). Block freeze 0307.12605.
 concentration as a technique aiming the goatmilk concentration: Kamińska-Dwórznicka, A., Gondek, E., Laba, S., Jakubczyk, E., &
 fate of physical, chemical, and rheological properties. International Samborska, K. (2019). Characteristics of instrumental methods
 Journal of Engineering Sciences & Research Technology, 8(5), 87-104. to describe and assess the recrystallization process in ice cream
 http://dx.doi.org/10.5281/zenodo.2836603. systems. Foods, 8(4), 117. http://dx.doi.org/10.3390/foods8040117.
Cruxen, C. E. S., Hoffmann, J. F., Zandoná, G. P., Fiorentini, Â. M., PMid:30987379.
 Rombaldi, C. V., & Chaves, F. C. (2017). Probiotic butiá (Butia Lomolino, G., Zannoni, S., Zabara, A., Da Lio, M., & De Iseppi, A. (2020).
 odorata) ice cream: Development, characterization, stability of Ice recrystallisation and melting in ice cream with different proteins
 bioactive compounds, and viability of Bifidobacterium lactis during levels and subjected to thermal fluctuation. International Dairy
 storage. Lebensmittel-Wissenschaft + Technologie, 75, 379-385. http://
 Journal, 100, 104557. http://dx.doi.org/10.1016/j.idairyj.2019.104557.
 dx.doi.org/10.1016/j.lwt.2016.09.011.
 Marshall, R. T., Goff, H. D., & Hartel, R. W. (2003). Ice cream. In R. T.
Dar, Y. L., & Light, J. M. (2014). Food texture design and optimization.
 Marshall, H. D. Goff & R. W. Hartel (Eds.), Calculation of ice cream
 In A. Kilara (Ed.), Low fat ice cream. Chicago: IFT Press. http://
 mixes (6th ed.). New York: Springer Science+Business Media. http://
 dx.doi.org/10.1002/9781118765616.
 dx.doi.org/10.1007/978-1-4615-0163-3
Di Criscio, T., Fratianni, A., Mignogna, R., Cinquanta, L., Coppola,
 R., Sorrentino, E., & Panfili, G. (2010). Production of functional Martínez-Cervera, S., Salvador, A., Muguerza, B., Moulay, L., & Fiszman,
 probiotic, prebiotic, and synbiotic ice creams. Journal of Dairy S. M. (2011). Cocoa fibre and its application as a fat replacer in
 Science, 93(10), 4555-4564. http://dx.doi.org/10.3168/jds.2010- chocolate muffins. Lebensmittel-Wissenschaft + Technologie, 44(3),
 3355. PMid:20854989. 729-736. http://dx.doi.org/10.1016/j.lwt.2010.06.035.
Ding, Z., Qin, F. G. F., Yuan, J., Huang, S., Jiang, R., & Shao, Y. (2019). Mehditabar, H., Razavi, S. M. A., & Javidi, F. (2019). Influence of pumpkin
 Concentration of apple juice with an intelligent freeze concentrator. puree and guar gum on the bioactive, rheological, thermal and sensory
 Journal of Food Engineering, 256, 61-72. http://dx.doi.org/10.1016/j. properties of ice cream. International Journal of Dairy Technology,
 jfoodeng.2019.03.018. 73(2), 447-458. http://dx.doi.org/10.1111/1471-0307.12658.
Dogan, M., Kayacier, A., Toker, Ö. S., Yilmaz, M. T., & Karaman, S. Mostafavi, F. S., Tehrani, M. M., & Mohebbi, M. (2017). Rheological
 (2013). Steady, Dynamic, Creep, and Recovery Analysis of Ice Cream and sensory properties of fat reduced vanilla ice creams containing
 Mixes Added with Different Concentrations of Xanthan Gum. milk protein concentrate (MPC). Journal of Food Measurement
 Food and Bioprocess Technology, 6(6), 1420-1433. http://dx.doi. and Characterization, 11(2), 567-575. http://dx.doi.org/10.1007/
 org/10.1007/s11947-012-0872-z. s11694-016-9424-y.
Góral, M., Kozłowicz, K., Pankiewicz, U., Góral, D., Kluza, F., & Muse, M. R., & Hartel, R. W. (2004). Ice cream structural elements
 Wójtowicz, A. (2018). Impact of stabilizers on the freezing process, that affect melting rate and hardness. Journal of Dairy Science,
 and physicochemical and organoleptic properties of coconut milk- 87(1), 1-10. http://dx.doi.org/10.3168/jds.S0022-0302(04)73135-5.
 based ice cream. Lebensmittel-Wissenschaft + Technologie, 92, 516- PMid:14765804.
 522. http://dx.doi.org/10.1016/j.lwt.2018.03.010.
 Nozière, P., Graulet, B., Lucas, A., Martin, B., Grolier, P., & Doreau, M.
Granger, C., Leger, A., Barey, P., Langendorff, V., & Cansell, M. (2005). (2006). Carotenoids for ruminants: From forages to dairy products.
 Influence of formulation on the structural networks in ice cream. Animal Feed Science and Technology, 131(3–4), 418-450. http://
 International Dairy Journal, 15(3), 255-262. http://dx.doi.org/10.1016/j. dx.doi.org/10.1016/j.anifeedsci.2006.06.018.
 idairyj.2004.07.009.
 Okpala, C. O. R., Piggott, J. R., & Schaschke, C. J. (2010). Influence of
Grigio, M. L., Durigan, M. F. B., & Chagas, E. A. (2019). Different high-pressure processing (HPP) on physico-chemical properties
 formulations of camu-camu popsicle: characterization, vitamin C of fresh cheese. Innovative Food Science & Emerging Technologies,
 and sensorial analysis of an opportunity to family agroindustry.
 11(1), 61-67. http://dx.doi.org/10.1016/j.ifset.2009.10.003.
 Food Science and Technology (Campinas), 39(1, Suppl 1), 93-97.
 http://dx.doi.org/10.1590/fst.38417. Patel, M. R., Baer, R. J., & Acharya, M. R. (2006). Increasing the protein
 content of ice cream. Journal of Dairy Science, 89(5), 1400-1406. http://
Gunathilake, M., Dozen, M., Shimmura, K., & Miyawaki, O. (2014).
 dx.doi.org/10.3168/jds.S0022-0302(06)72208-1. PMid:16606711.
 An apparatus for partial ice-melting to improve yield in progressive
 freeze-concentration. Journal of Food Engineering, 142, 64-69. http:// Pinto, S. S., Fritzen-Freire, C. B., Muñoz, I. B., Barreto, P. L. M., Prudêncio,
 dx.doi.org/10.1016/j.jfoodeng.2014.05.023. E. S., & Amboni, R. D. M. C. (2012). Effects of the addition of
Henao-Ardila, A., Quintanilla-Carvajal, M. X., & Moreno, F. L. (2019). microencapsulated Bifidobacterium BB-12 on the properties of
 Combination of freeze concentration and spray drying for the production frozen yogurt. Journal of Food Engineering, 111(4), 563-569. http://
 of feijoa (Acca sellowiana b.) pulp powder. Powder Technology, 344, dx.doi.org/10.1016/j.jfoodeng.2012.03.016.
 190-198. http://dx.doi.org/10.1016/j.powtec.2018.12.015. Raventós, M., Hernández, E., Auleda, J., & Ibarz, A. (2007). Concentration
Hernández, M. J. (1996). Caracterización reológica de hidrogeles de of aqueous sugar solutions in a multi-plate cryoconcentrator. Journal
 MCC-NaCMC + almidón Tixotropía y sinergismo (Phd thesis). of Food Engineering, 79(2), 577-585. http://dx.doi.org/10.1016/j.
 Universidade de València, València, Spain. jfoodeng.2006.02.017.
Huppertz, T. (2010). Foaming properties of milk: A review of the Sánchez, J., Hernández, E., Auleda, J. M., & Raventós, M. (2011). Freeze
 influence of composition and processing. International Journal of concentration of whey in a falling-film based pilot plant: Process
 Dairy Technology, 63(4), 477-488. http://dx.doi.org/10.1111/j.1471- and characterization. Journal of Food Engineering, 103(2), 147-155.
 0307.2010.00629.x. http://dx.doi.org/10.1016/j.jfoodeng.2010.10.009.

8 8/9 Food Sci. Technol, Campinas, Ahead of Print, 2021
Camelo-Silva et al.

Senaka Ranadheera, C., Evans, C. A., Adams, M. C., & Baines, S. K. conditions. Lebensmittel-Wissenschaft + Technologie, 62(1), 452-457.
 (2013). Production of probiotic ice cream from goat’s milk and effect http://dx.doi.org/10.1016/j.lwt.2014.02.055.
 of packaging materials on product quality. Small Ruminant Research, Sofjan, R. P., & Hartel, R. W. (2004). Effects of overrun on
 112(1-3), 174-180. http://dx.doi.org/10.1016/j.smallrumres.2012.12.020. structural and physical characteristics of ice cream. International
Senanayake, S. A., Fernando, S., Bamunuarachchi, A., & Arsekularatne, Dairy Journal, 14(3), 255-262. http://dx.doi.org/10.1016/j.
 M. (2013). Application of Lactobacillus acidophilus (LA 5) strain idairyj.2003.08.005.
 in fruit-based ice cream. Food Science & Nutrition, 1(6), 428-431. Soukoulis, C., Chandrinos, I., & Tzia, C. (2008). Study of the functionality
 http://dx.doi.org/10.1002/fsn3.66. PMid:24804052. of selected hydrocolloids and their blends with κ-carrageenan on
Silva, P. D. L., Bezerra, M. F., Santos, K. M. O., & Correia, R. T. P. (2015). storage quality of vanilla ice cream. Lebensmittel-Wissenschaft
 Potentially probiotic ice cream from goat’s milk: characterization and + Technologie, 41(10), 1816-1827. http://dx.doi.org/10.1016/j.
 cell viability during processing, storage and simulated gastrointestinal lwt.2007.12.009.

Food Sci. Technol, Campinas, Ahead of Print, 2021 9/9 9
You can also read