2020 CAPE FEAR AREA THE ECONOMICS OF HOUSING - Cape Fear REALTORS

Page created by Grace Swanson
 
CONTINUE READING
2020 CAPE FEAR AREA THE ECONOMICS OF HOUSING - Cape Fear REALTORS
2020
CAPE
FEAR
AREA
THE ECONOMICS
OF HOUSING
2020 CAPE FEAR AREA THE ECONOMICS OF HOUSING - Cape Fear REALTORS
RECORD-BREAKING. HISTORY-MAKING.
                                                                                                                        HELPING
                                                                                                                        YOU TURN
                                            Coldwell Banker company in the nation

                                                                                                                        A HOUSE
                                                in Eastern North Carolina for 21 years

                      in Closed Volume and 9,820 closed sales in 2020                                                   INTO A
                                                 We’ve been the firm you’ve trusted for more than 30 years and we
                                                 know our local markets better than anyone. Our regional network
                                                                                                                        HOME.
                                                                                                                        CORNINGCU.ORG
                                                 of offices and professionally trained Realtors® continue to list and
                                                 sell more homes in Eastern North Carolina than any other firm.

                                                 While utilizing the marketing resources and technology tools of
                                                 Coldwell Banker, the nation’s leading real estate brand, we are
                                                 proud to be locally owned and operated and we are committed to
                                                 giving back to the communities where we live and work.

                                                                                                                        Providing the highest level of service
                                                                                                                        from application through the life of the
                                                                                                                        loan. Get in touch with CCU’s reliable
                                                                                                                        mortgage team today!

                                                                                                                        VOTED BEST CREDIT UNION THREE YEARS RUNNING BY READERS OF WILMINGTON MAGAZINE.
                                                                                                                        FEDERALLY INSURED BY NCUA. Membership eligibility required. Approval for financing subject to lending guidelines and credit qualifications. Equal housing lender.

                                                     SeaCoastRealty.com
*Source: Coldwell Banker Real Estate LLC 2020
2020 CAPE FEAR AREA THE ECONOMICS OF HOUSING - Cape Fear REALTORS
SNAPSHOT                                                               A COLLABORATIVE EFFORT
    An analysis of the residential   CONTENTS
     real estate market and land                                                    Cape Fear REALTORS® (CFR) is a professional REALTOR®
     development conditions in                                                      alliance working together for our communities and
      the counties served by the     MSA                                            members to protect, advocate, and promote real property
                                                                                    ownership and investment.
     Cape Fear REALTORS® and         Definition | Outlook				             4
     the Wilmington - Cape Fear                                                     We strive to be the premier resource for technology,
     Home Builders Association.                                                     services and information for REALTORS® in our region so
                                     ECONOMICS                                      that they may better serve their clients. CFR serves the
                                     The Economic Impact			               5         interests of the public by:
                                     Economic Growth Outlook		            6         • Promoting private property rights.
                                                                                    • Monitoring and proposing regulation an legislation to
                                     GDP & Interest Rate Outlook		        7             ensure the availability and affordability of insurance for
                                                                                        both residential and commercial property owners
                                     RESIDENTIAL MARKET                             • Work with the National Association of REALTORS®, the
                                                                                        North Carolina REALTORS® and the NC Real Estate
                                     Existing Home Sales			               8-9           Commission to promote ethically and legally sound
                                     Median Sales Price				               10 - 11       representation for consumers.
                                     Days of Market				                   12
                                     Months of Supply				                 13
                                     Duplin County				                    14
                                                                                           910.762.7400 | www.capefear.REALTOR
                                     Sampon County				                    15               6105 Oleander Drive, Suite 102 | Wilmington, NC 28405
                                     Scotland County				                  16

                                     NEW CONSTRUCTION                               The Wilmington – Cape Fear Home Builders Association
                                                                                    (WCFHBA) is the voice of the building and development
                                     NAHB National Economic Prespective   17        industries in Southeastern North Carolina.
                                     New Construction Permits			          18
                                                                                    Chartered in 1965 and representing nearly 1200 member-
                                     New Construction Trend			            19        firms, the WCFHBA is the largest trade association in
                                     Permit Distribution				              20        Coastal North Carolina, the second largest Home Builders
                                     Sales Price					                     21        Association in the state, and the eighth largest Home Builders
                                     Heat Maps					                       22 - 23   Association in the nation. The Wilmington-Cape Fear Home
                                                                                    Builders Association represents an industry that contributes
                                                                                    billions of dollars to the economy of Southeastern North
                                     2021 FORECAST                                  Carolina and supports thousands of jobs in the greater
                                                                                    Wilmington area. For more than 55 years, the Wilmington-
                                     National Forecast Highlights		       24        Cape Fear Home Builders Association has been the voice
                                                                                    of the building industry, working to support not only our
                                                                                    members involved in the home building industry, but also
                                                                                    be an influential force for responsible growth by protecting
                                                                                    property rights and the privilege of home ownership.

                                                                                               910.799.2611 | www.wcfhba.com
                                                                                             3801-5 Wrightsville Avenue | Wilmington, NC 28403

4                                                                                                                                                    5
2020 CAPE FEAR AREA THE ECONOMICS OF HOUSING - Cape Fear REALTORS
W I L MIN GTO N                                                                                                 ECONOM I C I M PACT
                               METROPOLITAN STATISTICAL AREA                                                                                         TYPICAL HOME SALE IN NORTH CAROLINA

                                                                                                                                     THE REAL ESTATE INDUSTRY ACCOUNTED FOR $90.5 BILLION
                                                                                                                                              OR 15.4% OF THE GROSS STATE PRODUCT IN 2019.
                    MSA        (also known as Metropolitan Statistical Area)

                    Defined as having at least one urbanized area with a population of 50,000 or more,                                                               TOTAL ECONOMIC IMPACT
                    plus adjacent territory that has a high degree of social and economic integration
                    with the core as measured by commuting patterns.
                                                                                                                                                                     $75,312

                                                                                                                                 27.3%                             6.2%                            16.1%                    50.5%

                                                                                                                               $20,538                           $4,650                          $12,090                  $38,033
                                                                                                                             TOTAL IMPACT                     TOTAL IMPACT                     TOTAL IMPACT              TOTAL IMPACT

                                                                                                                          Income generated from             Expenditures related to            Multiplier of housing   New home construction
                                                                                                                            real estate industries              home purchase                  related expenditures

                                                                                                                                Real Estate Industries: We assume that commissions, fees and moving expenses, or income to
    Pre-2013 WILM MSA                                         New-WILM MSA                                                      real estate industries, associated directlywith the purchase are about 9% of the median home
    Preceding 2013, The Wilmington Metropolitan               In early 2013, the Wilmington, NC MSA was redefined to            price.
    Statistical Area (MSA) included the following             include New Hanover and Pender Counties. Prior to that
                                                                                                                                Expenditures related to home purchase: Furniture and remodeling expenses are about $4,650
    counties: Brunswick, New Hanover, and Pender.             time, the MSA also included Brunswick County. Brunswick
                                                                                                                                based on the NAHB figure.
                                                              County is now part of the Myrtle Beach, SC MSA.
                                                                                                                                Multiplier effect: The multiplier effect accounts for the fact that income earned in other sectors
                                                                                                                                of the economy as a result of a home saleis then re-circulated into the economy.

                                                                                                                                New construction: Additional home sales induce added home production. Typically, one new
                                                                                                                                home is constructed for every six existing home sales. Thus, for every existing homes sale, 1/6 of
                                                                                                                                a new home’s value is added to the economy.

6                                                                                                                       Data source from BEA, U.S. Census, NAHB, Macroeconomic Advisors, NAR                                                   7
2020 CAPE FEAR AREA THE ECONOMICS OF HOUSING - Cape Fear REALTORS
ECOMONIC GROWTH OUTLOOK                                                                                                                                                                                 GDP At-a-Glance
                                 THE IMPACT OF A PANDEMIC                                                                                                                                                      By the end of 2020, we saw an annual growth rate of -3.5%
                                                                                                                                                                                                               for the overall U.S. Economy.

               OUR INDUSTRY RIGHT NOW COULD BE BROKEN DOWN INTO
                             THE TALE OF TWO WORLDS.

    On one hand, we have a robust, thriving market,         homebuilding industry moved into Q1-2021, we
    where houses are selling well before they are even      are still seeing some of the same lingering trends

                                                                                                                                                                                                                                                             2.3
                                                                                                                                                                                                            2.5

                                                                                                                                                                                                                          2.2

                                                                                                                                                                                                                                        2.4
                                                                                                                                                                                                                                               2.6
                                                                                                                                                                         3.3
                                                                                                                                                                  3.8
                                                                                                                                                           2.7

                                                                                                                                                                                2.7

                                                                                                                                                                                                                                                                    2.9
                                                                                                                                                                                                                   1.6

                                                                                                                                                                                                                                                      1.6
                                                                                                                                                    1.8

                                                                                                                                                                                       1.8
                                                                                                                                             1.0

                                                                                                                                                                                                                                 1.7

                                                                                                                                                                                                                                                                          2.1
                                                                                                                                      4.1
    finished. Builders and REALTORS® are juggling           carry-over from 2020 as it relates to material
    more contracts than they know what to do with and       pricing and delays. Lumber prices continue to
                                                                                                                                      2000 2001 2002 2003 2004 2005 2006 2007 2008 2009 2010 2011 2012 2013 2014 2015 2016 2017 2018 2019 2020
    are busier than ever. On the other hand, we have        remain high and volatile. We saw prices jump
    an industry that has been plagued with huge price       150% in the 3rd and 4th quarter of 2020, and we

                                                                                                                                                                                                                                                                                -3.5
                                                                                                                                                                                                     -2.8
                                                                                                                                                                                              -.3
    increases, material shortages, and time delays that     have yet to see any relief as we have moved into
    are hindering the market from reaching its full         the 1st quarter of 2021.
    potential.
                                                            Ours is a global industry that relies heavily on
    In Q1-2020 and Q2-2020, we saw first-hand the           commodities and their overall supply chains
    implications of the pandemic as the construction        moving along without disruption. When we look
    & real estate industry and U.S. economy shuttered.      at the overall Real Gross Domestic product (GDP),
    As we settled into Q3-2020 & Q4-2020, we saw            we can see just how sharp of a turn it took from Q1
    a completely different picture. After the initial       to Q4 due to the effects of the pandemic.
    virus concerns and safety protocols became more
    of our everyday routine, and people adjusted            As identified by the graph below, we essentially
    accordingly, housing staged a dramatic turnaround       slammed the breaks on the economy in the Q2-
    beginning in the spring of 2020 and YTD.                2020, and then turned right around in the Q3-2020
                                                            and hit the accelerator. By the end of 2020, we saw
                                                                                                                                       Interest Rate Outlook
    One of the key metrics that helped provide this         an annual growth rate of -3.5% for the overall U.S.
    catalyst has been the historically low interest rates   Economy.                                                                   The most recent (January 2021) Monthly Outlook, prepared
    which allowed buyer demand to surge with sales                                                                                     by the Economics Group of Wells Fargo Securities, analysts
    surpassing many expectations. Fueled not only           From an outlook standpoint, home construction                              forecast that the conventional 30-year home mortgage
    by an in-migration of North Carolinians looking to      will likely continue to expand, especially as we look                      interest rate was on average 3.9% in 2019 and 3.12% in
    make that move to the coast, we also saw a sudden       at the Q2-2021 and Q3-2021. Much of this will be                           2020, down from 4.5% in 2018.
    wave of relocations from northern states and other      driven by a strong optimism that with the vaccine,
    areas across the United States.                         we will finally reach a true new “steady” normal.
                                                            With home builder confidence near record highs,
    This surge created a great deal of opportunities        we expect continued gains for single-family
    but with it came inventory issues as the market         construction, as interest rates, which motivated
    demand for housing right now is far outpacing the       buyers in 2020, are expected to remain low and
    available supply on the ground.                         will provide greater purchasing power, especially
                                                            for first-time home buyers.
    To meet this demand, the construction & real estate
    industry had to quickly adapted and embraced            Residential construction will continue to face
    technology.    Technology changed the game              limiting factors, including higher costs and longer
    forever and opened up a new world of virtual tours,     delivery times for building materials, an ongoing
    online mortgages, and secure E-Closings. This           labor skills shortage, and concerns over regulatory
    allowed consumers the opportunity to continue to        cost burdens. For apartment construction, we
    move through the home buying process efficiently        will see some weakness for multifamily rental
    and safely.                                             development particularly in high-density markets,

                                                                                                                                                                                                                   4.45
                                                                                                                                                                                       6.34
                                                                                                                                                    6.64

                                                                                                                                                                  5.84

                                                                                                                                                                                                                          3.66

                                                                                                                                                                                                                                                      3.65
                                                                                                                                                           5.83

                                                                                                                                                                                                                                               3.85
                                                                                                                                      8.05

                                                                                                                                                                                                     5.04
                                                                                                                                                                                              6.03

                                                                                                                                                                                                            4.69
                                                                                                                                                                         5.87
                                                                                                                                                                                6.41

                                                                                                                                                                                                                                                             3.99
                                                                                                                                             6.97

                                                                                                                                                                                                                                 3.98
                                                                                                                                                                                                                                        4.17

                                                                                                                                                                                                                                                                                3.12
                                                                                                                                                                                                                                                                    4.5
                                                            while remodeling demand should remain strong

                                                                                                                                                                                                                                                                          3.9
    Then we look at the other side of the coin. As the      and expand further.
                                                                                                                                      2000 2001 2002 2003 2004 2005 2006 2007 2008 2009 2010 2011 2012 2013 2014 2015 2016 2017 2018 2019 2020

8                                                                             Data source from U.S. Bureau of Economic Analysis   Data is from the Bureau of Labor Statistics in the US Department of Labor &                                                                          9
                                                                                                                                  Bureau of Economic Analysis housed in the US Department of Commerce
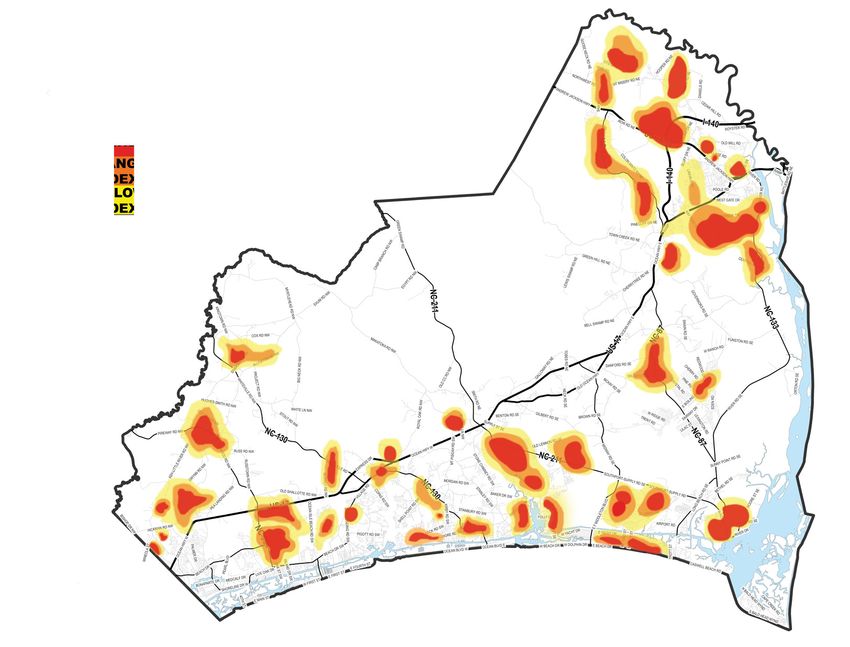
2020 CAPE FEAR AREA THE ECONOMICS OF HOUSING - Cape Fear REALTORS
Brunswick County
                                                                                                                                All Residential Home Sales
                      WILMINGTON AREA HOME SALES                                                                                Brunswick County 2020 sales soared
                                               ALL RESIDENTAL HOMES                                                             in 2020, up 29.1% with 6,339 closed
                                                                                                                                sales. The past two years are measured
                                                                                                                                increases    in   sales   by   comparison,
                                                                                                                                following a modest rise of an additional
                                                                                                                                145 closed sales (+3.1%) in 2018, with a

                                                                                                                                                                                                                                                           4,648
                                                                                                                                                                                                   2,230
                                                                                                                                                                                                           2,230
                                                                                                                                                                                                                   2,662
                                                                                                                                                                                           2,034

                                                                                                                                                                                                                                                                                   6,339
                                                                                                                                                                              Units Sold

                                                                                                                                                                                                                                                   3,807

                                                                                                                                                                                                                                                                   4,793
                                                                                                                                                                                                                                                                           4,912
                                                                                                                                                                                                                                           3,619
                                                                                                                                                                                                                           3,102
                                                                                                                                                                                                                                   3,149
Existing-home sales account for more than 90 percent of total home sales, and data captures complet-                            2.5% increase in 2019. Demand for 2021
ed transactions. Wilmington area sales continue to outpace the nation with performance that continues                           is off to a strong start with 660 sales
to lead the region. Existing home inventory remains tight as demand for homes in North Carolina, and                            pending in the first month of the year,
                                                                                                                                                                                           2009 2010 2011 2012 2013 2014 2015 2016 2017 2018 2019 2020
the Wilmington area outpaces housing starts. Buyer demand continues to push competition for the                                 65.8% more than January 2020.
near term.

U.S. home sales rose in 2020 edging just north of 6.7 million sales by December 2020, up 22.2% from
December 2019 at 5.5 million sales. This has edged back towards the all-time Nationwide peak in 2005
of 7.1 million sales.                                                                                                           New Hanover County
                                                                                                                                All Residential Home Sales
Total Wilmington area home sales continue to grow, rising 4.6% in 2019 to 11,907 over 11,382 in 2018.
This year’s sales are at near record levels, merely 1.2% below the 2006 market peak of 12,055. This                             New Hanover 2020 sales posted a
is especially welcome news for all area markets, each posting growth in 2019 after near stagnant or                             substantial 15.1% increase over 2019 with
declining sales from 2017 to 2018. 2020 promises another robust year with January 2020 sales 6.6%                               6,365 closed sales, the largest increase in
higher than one-year ago, with 12,120 closed sales in the region.                                                               sales since 2015. The increase equated to
                                                                                                                                an additional 836 sales in 2020 compared
                                                                                                                                to a mere 20 additional sales in 2018 over

                                                                                                                                                                                                   2,686

                                                                                                                                                                                                                                                                                   6,365
                                                                                                                                                                                                                                                                   5,243
                                                                                                                                                                                           2,522

                                                                                                                                                                                                                                                           5,223
                                                                                                                                                                                                                           3,829
                                                                                                                                                                                                                                   3,881
                                                                                                                                                                                                                                           4,521

                                                                                                                                                                                                                                                                           5,529
                                                                                                                                                                                                           2,703
                                                                                                                                                                                                                   3,551
                                                                                                                                                                              Units Sold

                                                                                                                                                                                                                                                   4,974
                                                                                                                                2017. January 2021 pending sales are
                                                                                                                                621, up 32.1% indicating a strong year
                                                                                                                                ahead for the county.
                                                                                                       308       310                                                                       2009 2010 2011 2012 2013 2014 2015 2016 2017 2018 2019 2020
                                                                                              298
                                                                                    289
                                                                          276
                                                                  266
                                                 246     255

                       220             225
              217              214
                                                                                                                                Pender County
                                                                                                                                All Residential Home Sales
                                                                                                                                Pender      County    2020     sales   were
                                                                                                                                astonishing in 2020, with an 25.9%
                                                                                                                                increase over 2019 with 380 additional
                                                                                                                                closed Sales. This is a record-breaking
                                                                                                                                gain in sales for Pender County and more
                                                                                                                                than made up for the 3.4% decline in
                                                                                                                  14,550
                                                                                    11,266

                                                                                              11,382
                                                                          10,140

                                                                                                        11,907

                                                                                                                                                                                                                                                                           1,466
                                                                                                                                                                                                                                                                                   1,846
                                                                                                                                                                              Units Sold

                                                                                                                                                                                                                                           1,282

                                                                                                                                                                                                                                                           1,395
                               5,544

                                                                                                                                                                                                                                                   1,359

                                                                                                                                                                                                                                                                   1,347
                       5,439

                                                 8,080
              5,006

                                                                  9,422

                                                                                                                                                                                                                                   1,158
                                       7,056

                                                          8,188

                                                                                                                                                                                                                           1,118
                                                                                                                                2018. Pending sales for this year are also
 Units Sold

                                                                                                                                                                                                                   843
                                                                                                                                                                                           450
                                                                                                                                                                                                   523
                                                                                                                                                                                                           611
                                                                                                                                showing an impressive 64.2% increase
                                                                                                                                over January 2020 with up 72 homes in
                                                                                                                                the first month of the year.                               2009 2010 2011 2012 2013 2014 2015 2016 2017 2018 2019 2020
              2009     2010    2011    2012      2013    2014     2015    2016      2017      2018     2019      2020

                                        # of Wilmington           # of National (millions)

10                                                                                 Data source from NCR MLS & NAR 2009 - 2020   Data source from NCR MLS & NAR 2009 - 2020                                                                                                         11
2020 CAPE FEAR AREA THE ECONOMICS OF HOUSING - Cape Fear REALTORS
Brunswick County
                                                                                                                                              All Residential Homes
                 WILMINGTON AREA MEDIAN PRICE                                                                                                 In 2020 the Brunswick County median
                                                       ALL RESIDENTAL HOMES                                                                   sales price increased $30,000 to $275,000,
                                                                                                                                              a solid 12.2% increase over the 2019 gain

                                                                                                                                                                                                                                                                                                              245,000
                                                                                                                                                                                                                                                                      200,000
                                                                                                                                                                                                                                                                                203,500

                                                                                                                                                                                                                                                                                                    232,000

                                                                                                                                                                                                                                                                                                                        275,000
                                                                                                                                                                                                                    185,000
                                                                                                                                                                                                                              173,500

                                                                                                                                                                                                                                                  175,000
                                                                                                                                                                                                          191,000

                                                                                                                                                                                                                                                                                          218,990
                                                                                                                                                                                                                                                            189,900
                                                                                                                                                                                                                                        177,000
                                                                                                                                              of 5.6%. The county remains under the

                                                                                                                                                                                            Sales Price
                                                                                                                                              national average of $309,800 and is 2.6%
                                                                                                                                              higher than the U.S. South median of
Median Sales Price continues to climb for the region, with steady increases in 2019, outpacing                                                $268,100 in 2020.
national figures across the three-county area. Comparatively, the United States home median                                                                                                               2009 2010 2011 2012 2013 2014 2015 2016 2017 2018 2019 2020
sales price increased $35,300 to $309,800, up 12.9% nationwide.

The Wilmington region median sale price rose 11.1% the highest growth of the measured
period to $285,000 in 2020. Since 2012, median sales price in the region has increased year-over-
year, with a notable 6.3% bump in 2017, second to only 2020, where strongest gains
occurred in Brunswick county.                                                                                                                 New Hanover County
                                                                                                                                              All Residential Homes
                                                                                                                                              In 2020 New Hanover County median
                                                                                                                                              sales price increased $25,000 to $290,000,
                                                                                                                                 6.7          a 9.4% increase over 2019, the largest
                                                                                                                                              one-year gain in median price in the data
                                                                                                                                              collected. This is the largest year’s sales
                                                                                       5.5        5.5                  5.5
                                                                             5.3                             5.3                              price gain in New Hanover County after a
                                                         5.1

                                                                                                                                                                                                                                                                                                              265,500
                                                                                                                                                                                                                                                                                                                        290,000
                                                                                                                                                                                                                                                                                                    254,900
                                                                                                                                                                                                                              182,000

                                                                                                                                                                                                                                                                                          242,900
                                                                                                                                                                                                                                        185,000

                                                                                                                                                                                                                                                                      214,500
                                                                                                                                                                                                                                                            210,000
                                                                                                                                                                                                          195,000

                                                                                                                                                                                                                                                                                228,750
                                                                                                                                                                                                                                                  194,075
                                                                                                                                                                                                                    199,900
                                                                   4.9                                                                        notable one-year increase of 8.2% in 2014.
                                             4.7

                                                                                                                                                                                            Sales Price
               4.3                 4.3                                                                                                        New Hanover lagged the area in 2020
                         4.2
                                                                                                                                              price increases, posting under the robust
                                                                                                                                              12.9% nationwide and 11.3% U.S. South
                                                                                                                                              gains in median sales price.                                2009 2010 2011 2012 2013 2014 2015 2016 2017 2018 2019 2020

                                                                                                                                              Pender County
                                                                                                                                              All Residential Homes
                                                                                                                                              Leading the area in 2020, Pender County
                                                                                                             245,000

                                                                                                                       256,500
                                                                   205,000

                                                                                                                                 285,000
                                                                                       220,000
                                             183,000
                         192,000

                                   180,000

                                                                                                   233,900
                                                                             210,000
               194,900

                                                         189,525

                                                                                                                                              posted a median sales price increased
 Sales Price

                                                                                                                                              from $269,700 to $300,000, a hefty 11.2%
                                                                                                                                              increase, much improved over the near flat
                                                                                                                                              gain of 1.1% in 2018. The bump in 2020
                                                                                                                                              was the highest in the past ten years, with

                                                                                                                                                                                                          200,000

                                                                                                                                                                                                                                                                                                                        300,000
                                                                                                                                                                                                                                                                                236,000

                                                                                                                                                                                                                                                                                                    255,000
                                                                                                                                                                                                                                                                                          252,350
                                                                                                                                                                                                                                                                      232,700
                                                                                                                                                                                                                    190,000
                                                                                                                                                                                                                              194,250
                                                                                                                                                                                                                                        199,000

                                                                                                                                                                                                                                                            224,769

                                                                                                                                                                                                                                                                                                              269,700
                                                                                                                                                                                                                                                  207,123
               2009      2010      2011      2012        2013      2014      2015      2016       2017       2018      2019      2020         a $30,300 median sales price increase in

                                                                                                                                                                                            Sales Price
                                                                                                                                              one year. Pender remained just under the
                                                                                                                                              national median sales price by $9,800 or
                                             # of Wilmington                 # of National (millions)                                         3.2% and was 11.9% higher than the 2019
                                                                                                                                                                                                          2009 2010 2011 2012 2013 2014 2015 2016 2017 2018 2019 2020
                                                                                                                                              U.S. South median average of $268,100.

12                                                                                               Data source from NCR MLS & NAR 2009 - 2020   Data source from NCR MLS & NAR 2009 - 2020                                                                                                                                 13
2020 CAPE FEAR AREA THE ECONOMICS OF HOUSING - Cape Fear REALTORS
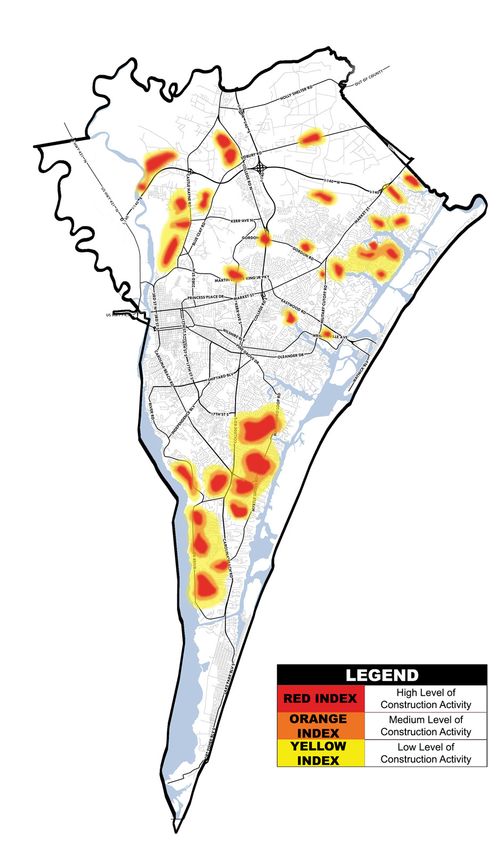
Wilmington Area                                                                                   Wilmington Area
                           Days on Market (DOM)                                                                              Months of Supply
                           All Residential Homes                                                                             All Residential Homes

                           A frequently used indicator of residential single-family housing market                           Months of Supply is expressed as how many months it would take                        Markets are traditionally
                           strength is median Days on Market (DOM), the number of days that a                                for all current residential properties for sale on the market to sell
                           residential property is available for sale before going under contract. In                        at the average rate of sales for the past twelve months. Often
                                                                                                                                                                                                                   categorized as a Seller’s,
                           general, a fall suggests a strengthening market, while a rise indicates a                         referred to as the absorption rate, this marker correlates closely                    Buyer’s or Balanced
                           weakening market.                                                                                 with the Days on Market, since both numbers track the amount
                                                                                                                             of time between when a property is listed and when an offer is                        Market. Five to eight
                           Days on Market across the region continue to drop, reinforcing the demand                         accepted.                                                                             months of supply is
                           for housing among all sectors. As rapid market absorption continues, the
                           most notable changes over the near term are in Brunswick and New Hanover                          As the housing market has recovered from the initial impacts of                       considered a Balanced
                           counties.                                                                                         the pandemic, nominal house price appreciation has soared, but
                                                                                                                                                                                                                   Market: if the number
                                                                                                                             affordability improved until recently due to the house-buying
                           In 2020, New Hanover’s median DOM took a notable drop to a mere 14                                power benefit from historically low mortgage rates. As our                            is less than five months,
                           days, a one-year 22.2% decline after a steep 28% drop in 2019. The county’s                       regional economy strengthened over the past ten years, a time
                           absorption of available inventory leads the region in all but one of the last                     of once abundant housing choice has now moved to a Seller’s
                                                                                                                                                                                                                   this suggests a Seller’s
                           five years and is the consistently lower than Brunswick and Pender counties.                      Market across the overall region. New Hanover first crossed                           Market. If the number is
                                                                                                                             this line in 2016 and in the years following, first Pender, then
                           Pender County median DOM was 29 days, a 9.4% decline from 32 DOM in                               Brunswick County followed. In 2020, all three Counties in the                         greater than 8 months,
                           2019. As this county continues to develop new housing stock, the demand                           region have had 3 months or less of available inventory and New                       this suggests a Buyer’s
                           looks to keep pace with available and new inventory.                                              Hanover remains lowest, ending 2020 with 2 months of inventory
                                                                                                                             compared to 3.3 and 3.4 in Pender and Brunswick counties.                             Market.
                           In 2020, Brunswick County median DOM saw the largest drop of 14 days from
                           44 to 30, or 31.8%. The most recent year with significant market absorption
                           was 2016, when DOM dropped 30.2% in one year, from 106 to 74 days.

                                                                                                                        30
140                                                                                    Brunswick County                                                                                                                Brunswick County
                                                                                                                        25
                                                                                       New Hanover County                                                                                                              New Hanover County
120
                                                                                       Pender County                                                                                                                   Pender County
                                                                                                                        20
100

                                                                                                                        20
80

60                                                                                                                      15

40                                                                                                                      10

20                                                                                                                      5

0                                                                                                                       0
      2009   2010   2011       2012      2013     2014      2015      2016     2017      2018       2019       2020           2009       2010       2011      2012        2013   2014      2015      2016   2017      2018     2019       2020

      14                                                                         Data source from NCR MLS 2009 - 2020        Data source from NCR MLS & NAR 2009 - 2020                                                                       15
2020 CAPE FEAR AREA THE ECONOMICS OF HOUSING - Cape Fear REALTORS
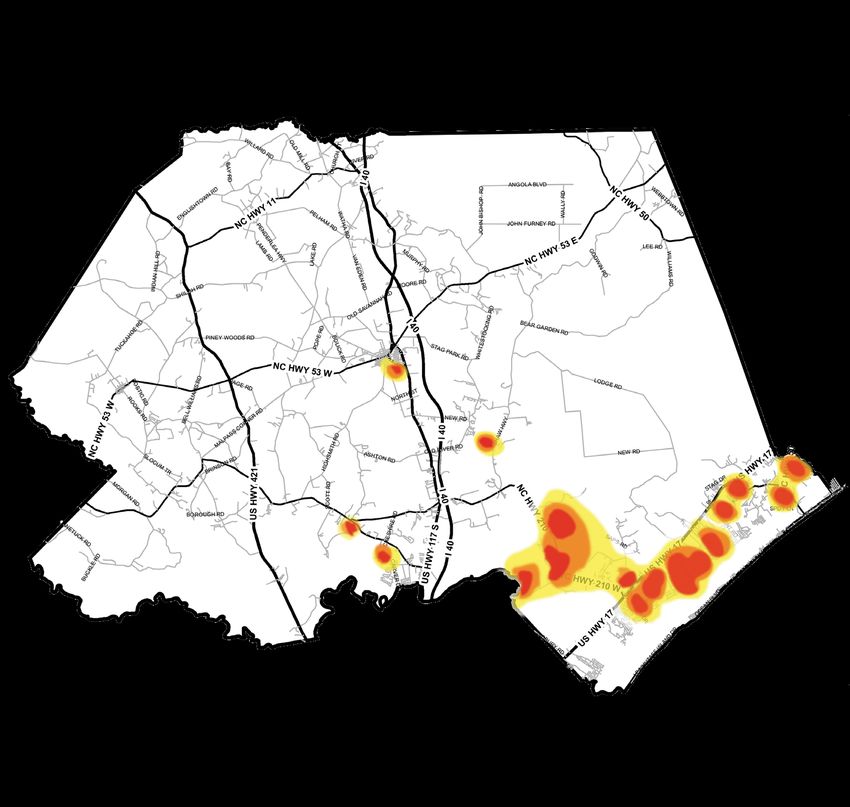
Duplin County                                                             Sales Price                             # of Sales
                                                                                                                                                        Sampson County                                                                    Sales Price                         # of Sales

All Residential Homes                                                                                                                                   All Residential Homes

                                                                                                                                         240

                                                                                                                                                                                                                                             168                        165            168
                                                                                                 184           182                                                                                      162                                                  163
                                                                                                                              181
                                                                                 174                                                                                                                             148             145                                                              145
                                                         156            158                                                                                                                    130
                                               154
                                                                                                                                                               119       122
                                                                                                                                                                                  115
        121
                             113      116

                  97

                                                                                                                              140,000

                                                                                                                                         150,000

                                                                                                                                                                                                                                              100,000

                                                                                                                                                                                                                                                                                                      145,000
                                                                                                                                                                                                                                                                                       130,000
                                                                                                                                                                                                                                                             102,900
                                                                                                               114,750

                                                                                                                                                                                                                                                                        110,000
                                               84,000

                                                                        88,000
                  68,000

                                                                                  95,000
                                      76,500

                                                                                                 89,450
        79,500

                                                                                                                                                               98,000

                                                                                                                                                                                   93,000
                                                         87,500

                                                                                                                                                                         95,000

                                                                                                                                                                                                                                 95,000
                                                                                                                                                                                               84,700

                                                                                                                                                                                                        77,500

                                                                                                                                                                                                                  97,250
                             67,180

       2009      2010        2011     2012     2013      2014           2015      2016           2017          2018           2019       2020                  2009      2010      2011        2012     2013     2014            2015         2016           2017       2018           2019       2020

Duplin County median sales price saw a moderate increase of $10,000 in 2020, posting a gain of 7.1% over 2019. The 2020                                 Sampson County median sales price increased 11.5% in 2020, with a healthy gain of $15,000 in median price, yet still
sales price is the highest on record at $150,000 followed by 2019 with a median of $140,000. The largest single year bump                               behind the robust one-year gain of $25,000 in 2019. Closed sales dipped for the first time since 2017 with sales at 145
in median sales price for the county was in 2018 with gain of $23,300, moving from $89,450 to $114,750, a jump of 28.3%.                                for the year, a possible signal in response to a two-year median sales price surge of 31.8%, aggressive gains by any
                                                                                                                                                        definition. Despite this considerable increase in median sales price, Sampson County remains priced comfortably
The median sales price for Duplin County remains well below the U.S. South and the Wilmington region. Duplin County is                                  below the U.S. South and the Wilmington region. Sampson County is 96.6% or $140,000 below the 2020 median
$135,000 below the 2020 median sales price for the Wilmington Area and 78.7% or $118,100 below the U.S. South. Duplin                                   home sales price for the Wilmington Area and $123,100 or 84.9 % below the U.S. South.
County sales saw its greatest sales increase with 240 closed in 2020, one off the 2018 closed sales of 182. Sales have soared
in 2020, increasing 32.5% over 2019 which saw 181 sales during the year.                                                                                In 2020, Sampson County median Days
                                                                                                                                                        on Market (DOM) before sale of 51                                  123

In 2020, Duplin County median Days on                                                                                                                   days rebounded 8.5% from 47 days in
                                                                                                                                                                                                          97                                99
Market (DOM) continued to move in a                                                                                                                     2019. Available inventory of homes at                                                           90
                                                                                                                                                                                                                                                               85
positive direction, with homes taking 12                                                                                                                3.7 Months’ Supply continued to drop                     76
                                                                                                                                                                                                                                   81
                                                                  111                                                                                                                                                                                                  75
days fewer to accept an offer to purchase,              104                                104                                                          in 2020, posting 21.3% lower than                                                                                               69

a drop of 21% over 2019. The inventory            93                      93     90                                                                     2019. As inventory continues to decline                                                                                   55
                                                                                                                                                                                                                                                                                                                51
                                                                                                   85                                                                                                                                                                                            47
supply dropped 30.2% in 2020 which is a                                                                                  80                             coupled with double digit percentage
record low for the county.                                                                                   73                                         price gains, the county will continue to
                                                                                                                                64
                                                                                                                                                        struggle meet buyer demand.
                                                                                                                                        57
Inventory pressures for Duplin County
                                                                                                                                                   51
sales arrived in 2020 as buyers increasingly
selected rural and nearby counties to
metropolitan areas. Duplin posted a
31.9% gain in the number sales in 2020,

                                                                                                                                                                                                                                                    10
                                                                                                                                                                                                                           15
                                                                                                                                                                                                                 13

                                                                                                                                                                                                                                  14
                                                                                                                                                                                                         12

                                                                                                                                                                                                                                            11
                                                        23

                                                                         23
                                                                  24

                                                                                 20

                                                                                                  15
                                                                                           16

                                                                                                             12
                                                 17

                                                                                                                                                                                                                                                              9
                                                                                                                                                                                                                                                                       7
                                                                                                                                                                                                                                                                              6
                                                                                                                                                                                                                                                                                       7
                                                                                                                                                                                                                                                                                                 5

                                                                                                                                                                                                                                                                                                           4
                                                                                                                     9
                                                                                                                               8
                                                                                                                                        6

                                                                                                                                               4

posting 240 sales. Overall, modest sales
price increase and declining Months’            2009 2010 2011 2012 2013 2014 2015 2016 2017 2018 2019 2020                                                                                              2009 2010 2011 2012 2013 2014 2015 2016 2017 2018 2019 2020
Supply signals a shift into higher demand
and the green shoots of a Seller’s Market.
                                                                         Month Supply                          DOM                                                                                                                 Month Supply                             DOM

16                                                                                                        Data source from NCR MLS 2009 - 2020          Data source from NCR MLS 2009 - 2020                                                                                                                         17
2020 CAPE FEAR AREA THE ECONOMICS OF HOUSING - Cape Fear REALTORS
220                 223

                                                                                                                                                  HEADWI NDS LOOM
                                                                                                          203
                                                                                     177
                                                                160
                                                                           150
                                                       142                                                                                       HOUSING GROWTH CONTINUES IN 2021

Scotland County
                                             89

All Residential Homes
                                                                                                                            The U.S. economy contracted at its steepest pace            tions are not likely to be met until 2022 or beyond,
                                                                                                                            since the Great Depression in the second quarter            indicating accommodative monetary policy that
Scotland County median sales price                                                                                          of 2020, as a result of the widespread shutdowns            will support housing, home building and the overall
increased a dramatic $20,100 in 2020,                                                                                       across the country due to COVID-19. Though we               economy for years to come. Though mortgage rates

                                                                           104,000

                                                                                                104,000
                                                                102,000
posting a strong gain of 20.1% over 2019.                                                                                   saw a strong rebound in the second half of 2020 led         rose slightly in recent weeks, we expect the 30-year

                                             98,000

                                                       89,500

                                                                                     97,000

                                                                                                          99,900

                                                                                                                   99,900
The 2020 sales price is the highest on                                                                                      by the gradual reopening of businesses and revital-         fixed mortgage rate will remain relatively low but
record at $120,000 followed by 2018 with                                                                                    ized spending, U.S. Gross Domestic Product (GDP)            gradually increase over the course of 2021. None-
a median of $104,000. This was the largest                                                                                  still shrank 3.5% in 2020, the first contraction since      theless, higher mortgage rates represent a housing
one-year bump in median sales price for                                                                                     2009. However, with additional fiscal stimulus and          affordability risk.
                                             2013      2014     2015       2016      2017      2018       2019     2020
the county, the next greatest jump was in                                                                                   an increase in the number of available vaccines, we
2015 with an increase at $12,500 or 14%.                                                                                    expect the economy to accelerate with a 5.1% annu-          While the housing market was hit hard by the

                                                                                                                            al growth rate in 2021. With a recovering economy           economic shutdown during the Spring, it has seen a
                                                      Sales Price                             # of Sales
The median sales price for Scotland                                                                                         and renewed interest in housing, the residential sec-       robust rebound during the second half of last year.
County remains below the U.S. South and                                                                                     tor is poised for additional gains.                         Due to low mortgage interest rates, a renewed focus
the Wilmington region. Scotland County                                                                                                                                                  on the importance of home, an evolving geography
is $165,600 below the 2020 median                                                                                           Though the pandemic resulted in a record 20.5 mil-          of housing demand and a lack of inventory, the
sales price for the Wilmington Area and                                                                                     lion jobs being lost in March and April, 12.3 million       housing sector has been a bright spot for the econo-
$148,100 below the U.S. South. Scotland                                              127                                    jobs have been created since May and the unem-              my. As measured by the NAHB/Wells Fargo Housing
County sales posted the highest recorded               113                                                                  ployment rate declined to 6.3% in January. Currently,       Market Index, builder confidence hit an all-time high
                                                                107
sales on record with 223 closed sales in     90                             90                                              job gains in residential construction have offset all       of 90 in November and has remained in the mid- to
the county, a one-year jump of 9.9%.                                                                                        the job lost in March and April, while only 60% of          high 80’s since December. Recent softening, how-
                                                                                                66                          non-residential construction jobs lost have been re-        ever, is due to concerns over rising lumber and mate-
In 2020, Scotland County median Days                                                                       37               covered. The improvements of the past ten months            rial costs and increased regulatory policy risk.
on Market (DOM) gained lighting speed,                                                                                      reflect that the economy is recovering from the
                                                                                                                   21                                                                   The COVID-19 pandemic not only shut down the
ending 2020 at 21 days to go under                                                                                          pandemic, albeit gradually. And while broad-based
                                                                                                                                                                                        economy but changed housing preferences. The
contract. The absorption rate picked up                                                                                     economic distress continues, we expect the unem-
                                                                                                                                                                                        NAHB Home Building Geography Index (HBGI)
significant speed, as Months’ Supply of                                                                                     ployment rate to fall back to approximately 5.0% by
                                                                                                                                                                                        found that residential construction activity expanded
homes dropped 53.6% in one year; from                                                                                       the start of 2022.
                                                                                                                                                                                        at a more rapid pace in lower density markets, such
4.5 in 2019 to 2.4 in 2020. As inventory
                                                                                                                            Additionally, the Federal Reserve pledged to keep           as smaller cities and rural areas since the first quarter
continues to decline and prices increase
                                                                                                                            interest rates near zero and will likely not raise inter-   of 2020. This suburban shift continued through the
                                             22

                                                                                     10

with stable pace of sales, the county is
                                                       8

                                                                7

                                                                           8

                                                                                                8

                                                                                                          5

                                                                                                                   2

                                                                                                                            est rates until the economy has recovered and the           rest of 2020. This change is expected to continue on
facing similar scarcity to Wilmington.
                                             2013      2014     2015       2016      2017      2018       2019     2020     inflation rate reaches 2.0%. These economic condi-          a partial basis in the post-vaccine economy.

                                                      Month Supply                            DOM
                                                                                                                                                               ROBERT DIETZ, SVP & Chief Economist
                                                                                                                                                               National Association of Home Builders

18                                                                        Data source from NCR MLS 2009 - 2020                                                                                                                                      19
Brunswick County
New Construction                                                                                                                                           Residential Building Permits
New Home Building Permits                                                                                                                                  A total of 2844 single family permits
                                                                                                                                                           were issued in Brunswick County in 2020;
The United States finished 2020 with 977,863 permits and increase of 14.5% above its level one                                                             this is a +14.8% increase from 2019
year ago of 854,000 Permits. It is currently 135% higher than its 2011 recession-era bottom or                                                             in which 2477 permits were issued. It
414,498 permits and currently -42% below its 2005 peak permit level of 1,681,966 permits.                                                                  represents 54% of the Wilmington Region
                                                                                                                                                           Countywide total permits, up from 53%
                                                                                                                                                           in 2019. When you look at the municipal

                                                                                                                                                                                                                County Permit #
The State of North Carolina finished 2020 with 56,898 permits and increase of 15.6% above its
                                                                                                                                                           jurisdictions in the County, the bulk of
level one year ago of 48,071 permits. It is currently 128% higher than its 2011 recession-era

                                                                                                                                                                                                                                                                                                                      2,844
                                                                                                                                                                                                                                                                                      2,005
                                                                                                                                                                                                                                                                                              2,491
                                                                                                                                                                                                                                                                              2,249
                                                                                                                                                                                                                                                              1,643

                                                                                                                                                                                                                                                                                                              2,477
                                                                                                                                                                                                                                                                                                      2,578
                                                                                                                                                                                                                                                      1,226

                                                                                                                                                                                                                                                                      1,995
                                                                                                                                                                                                                                  1,319
                                                                                                                                                           those permits were in the Town of Leland
bottom of 24,863 permits and currently -33% below its 2005 peak permit level of 84,975 permits.

                                                                                                                                                                                                                                                943
                                                                                                                                                                                                                                          892
                                                                                                                                                           with a grand total of 770 permits issued
                                                                                                                                                           in 2020. The highest number of permits
The Wilmington Area (New Hanover, Pender, and Brunswick County) finished 2020 with a combined                                                              issued in one month during 2020 was 94                                 2009 2010 2011 2012 2013 2014 2015 2016 2017 2018 2019 2020
total of 5,315 Permits. This represents a 14% increase above its level one year ago of 4660 permits.                                                       permits in the month of March.
It is currently 237% higher than its 2010 recession-era bottom of 1,571 permits and currently -31%
below its 2005 peak permit level of 7658.
                                                                                                                                                           New Hanover County
                                                                                                                                                           Residential Building Permits
                                                                                                                   National Permit # (1000s)
                           1681                                                                                                                            A total of 1562 single family permits
                1612                                                                                               State Permit # (1000s)                  were issued in New Hanover County
                                                                                                                                                           in 2020; this is a +8.85% increase from
                                                                                                                   Wilmington Permit #
        1443                                                                                                                                               2019 in which 1435 permits were issued.
                                   1379
1321                                                                                                                                                       It represents 29% of the Wilmington
                                                                                                                                                           Area total permits, down from 31% in

                                                                                                                                                                                                                County Permit #
                                                                                                                                                           2019. When you look at the municipal
                                                                                                                                                           jurisdictions in the County, the bulk

                                                                                                                                                                                                                                                                                                              1,435
                                                                                                                                                                                                                                                      1,064
                                                                                                                                                                                                                                                              1,482

                                                                                                                                                                                                                                                                                                      1,350

                                                                                                                                                                                                                                                                                                                      1,562
                                                                                                                                                                                                                                                                                      1,736
                                                                                                                                                                                                                                                                                              1,909
                                                                                                                                                                                                                                                                              1,123
                                           973                                                                                                     977     of these permits were in the City of

                                                                                                                                                                                                                                                482

                                                                                                                                                                                                                                                                      982
                                                                                                                                                                                                                                          473
                                                                                                                                                                                                                                  401
                                                                                                                           817     852     854             Wilmington with a grand total of 449
                           85
                                   83                                                                              745                                     residential permits issued in 2020. The
                                                                                                           690                                                                                                                    2009 2010 2011 2012 2013 2014 2015 2016 2017 2018 2019 2020
                                                                                                   630                                                     highest number of permits issued in one
                76                                                                         617
                                                   569                                                                                                     month during 2020 was 69 permits in the
                                                                                   514
67                                         68                      446                                                                                     month of April.
        66                                                 435             414
                                                                                                                                                   57

                                                                                                                           47      48      49              Pender County
                                                                                                                   41                                      Residential Building Permits
                                                   39
                                                                                           35      35      37
                                                                                                                                                           A total of 909 single family permits were
                                                                                   30                                                                      issued in Pender County in 2020; this is a
                                                           25      26      24                                                                              +21.5% increase from 2019 in which 748
                                                                                                                                                           permits were issued. It represents 17%
                                                                                                                                                           of the Wilmington Area total permits, up
                                                                                                                                                           from 16% in 2019. When you look at the
                                                                                                                                   4,465

                                                                                                                                           4,660
4,290

                                   6,205

                                                                                                                           4,899
                                                                                                   3,407
                                                           1,844
        5,527

                                           4,998

                                                                                                           3,934
                                                   2,971
                6,861

                                                                                                                                                   5,315
                                                                                                                   3,756
                                                                                           3,513
                           7,685

                                                                                   3,613
                                                                           1,662
                                                                   1,571

                                                                                                                                                           municipal jurisdictions in the County, the
                                                                                                                                                           bulk of these permits were in the Town of

                                                                                                                                                                                                                County Permit #
                                                                                                                                                           Surf City with a grand total of 251 permits
2002 2003 2004 2005 2006 2007 2008 2009 2010 2011 2012 2013 2014 2015 2016 2017 2018 2019 2020                                                             issued in 2020. The highest number of

                                                                                                                                                                                                                                                                      430

                                                                                                                                                                                                                                                                                                                      909
                                                                                                                                                                                                                                                              388
                                                                                                                                                                                                                                          206

                                                                                                                                                                                                                                                                                              499
                                                                                                                                                                                                                                                                              562
                                                                                                                                                                                                                                                      232
                                                                                                                                                                                                                                                237

                                                                                                                                                                                                                                                                                                      537
                                                                                                                                                                                                                                                                                      525
                                                                                                                                                           permits issued in one month during 2020

                                                                                                                                                                                                                                                                                                              748
                                                                                                                                                                                                                                  124
                                                                                                                                                           was 43 in the month of December.

                                                                                                                                                                                                                                  2009 2010 2011 2012 2013 2014 2015 2016 2017 2018 2019 2020

 20                     All Inspection Data is gather directly from each responsible permitting jurisdiction within each County & U.S. Cenus Bureau        All Inspection Data is gather directly from each responsible permitting jurisdiction within each County & U.S. Cenus Bureau                                 21
7%

                   22%
                                                          Permit Distribution                                                Brunswick County
           2009                                           Permit Distribution by County                                      New Home Sale Price

                                                                                                                             In 2020 the Brunswick County median
                                                          The following pie charts depict the percentage
                                                                                                                             new home sales price increased
             72%                                          distribution of permits by the County at three points
                                                                                                                             $6,690 to $270,690 over the previous

                                                                                                                                                                                                                             225,25tf 0
                                                          in time, viz., 2009 (the last year of that recession),
                                                                                                                             highest recorded new homes median

                                                                                                                                                                                                                                          248,430

                                                                                                                                                                                                                                                                                            264,000
                                                                                                                                                                                                                                                    235,000

                                                                                                                                                                                                                                                                        235,000
                                                                                                                                                                                               225,000

                                                                                                                                                                                                                   220,000
                                                                                                                                                                                     198,500

                                                                                                                                                                                                         210,000

                                                                                                                                                                                                                                                                                                      270,690
                                                                                                                                                                                                                                                              228,675

                                                                                                                                                                                                                                                                                  249,900
                                                          2013 (early recovery year), 2017 (more than seven
                                                                                                                             of $264,000 in 2019, a one-year gain

                                                                                                                                                                       Sales Price
                                                          years following the end of that recession) and 2020
             11%                                                                                                             of 2.5%. It is $4,310 or 1.5% under
                                                          present day.
                                                                                                                             the 2020 median existing home
                                                                                                                             sales price of $275,000 for Brunswick
                   42%                                    Brunswick      County      accounted      for   72%     of   all                                                           2009 2010 2011 2012 2013 2014 2015 2016 2017 2018 2019 2020
                                                                                                                             County.
                                                          Wilmington Area permits in 2009, 47% in 2013, 51%
           2013                                           in 2017, 58% in 2018, 54% in 2019, and 54% in 2020.

     47%                                                  New Hanover County accounted for 22% of all
                                                          Wilmington Area permits in 2009, 42% in 2013, 39%
                                                          in 2017, 30% in 2018, 30% in 2019, and 29% in 2020.                New Hanover County
                                                                                                                             New Home Sale Price
                                                          Pender County accounted for 7% of all Wilmington
             10%
                                                          Area permits in 2009, 11% in 2013, 10% in 2017, 12%                In 2020 New Hanover County median
                                                          in 2018, 16% in 2019, and 17% in 2020.                             new home sales price rose 3%, to
                   39%                                                                                                       $349,900 from $339,795 in 2019.
           2017                                                 Brunswick County
                                                                                                                             This is a slight decrease in median
                                                                                                                             new home sales price from 2018 to
                                                                New Hanover County                                           2019 which saw an increase of 4.6%.

                                                                                                                                                                                               230,000

                                                                                                                                                                                                                                                    295,000

                                                                                                                                                                                                                                                                                  325,000
                                                                                                                                                                                                                   258,090
                                                                                                                             It is $64,900 or 22.8% above the 2020

                                                                                                                                                                                                                                          282,790
     51%

                                                                                                                                                                                                         239,000
                                                                                                                                                                                     227,000

                                                                                                                                                                                                                                                                                                      349,900
                                                                                                                                                                                                                                                                                            339,795
                                                                                                                                                                                                                             279,900

                                                                                                                                                                                                                                                                        326,190
                                                                                                                                                                                                                                                              317,085
                                                                Pender County                                                median existing home sales price of

                                                                                                                                                                       Sales Price
                                                                                                                             $285,000 for New Hanover County,
                                                                                                                             nearly identical to the spread of 22%
                                                                                                                             in 2019. This two year comparison
             12%                                                                                                                                                                     2009 2010 2011 2012 2013 2014 2015 2016 2017 2018 2019 2020
                                                                                                                             supports a loose correlation to overall
                                                                                                                             median and new homes as a subset of
                   30%                                                                                                       overall sales.
           2018                                                                        17%

     58%                                                                                                                     Pender County
                                                                                                                             New Home Sale Price

                                                                                                                             In 2020 Pender County median

             16%                                                         2020                             29%                new home sales price increased
                                                                                                                             incrementally $4,899, a 1.6% over
                                                                                                                             2019. This is a significant decrease
                                                                                                                             from the previous year which saw a

                                                                                                                                                                                                                                                              268,846
                                                                                                                                                                                                                   243,506
                                                                                                                                                                                                         226,245
                                                                                                                                                                                     273,000

                                                                                                                                                                                                                                          258,900

                                                                                                                                                                                                                                                                                            308,920
                                                                                                                                                                                                                                                                        274,000
                                                                                                                                                                                                                                                                                  280,313
                                                                                                                                                                                                                             237,500
                                                                                                                                                                                               219,000

                                                                                                                                                                                                                                                    267,450

                                                                                                                                                                                                                                                                                                      313,819
                   30%
           2019                                                                                                              10.2% increase of $28,607. Home

                                                                                                                                                                       Sales Price
                                                           54%                                                               prices are just under existing sales
                                                                                                                             price in the county, posting $13,819
     54%                                                                                                                     below the 2020 median existing
                                                                                                                             sales price of $300,000.                                2009 2010 2011 2012 2013 2014 2015 2016 2017 2018 2019 2020

22                 All Inspection Data is gather directly from each responsible permitting jurisdiction within each County   Data source from NCR MLS 2009 - 2020                                                                                                                                     23
HE AT MA PS                         Brunswick County

               CONSTRUCTION ACTIVITY

     New Hanover County

                                                     Pender County

24                                     Data source for graphic is from WCFHBA based upon actual homes under construction   25
2021 NATIONAL FORECAST
                                    HIGHLIGHTS

                                                                                             Today’s consumers look for a professional who is ready,
                                                                                               informed
                                                                                             Today’s    and confident
                                                                                                     consumers look forthroughout   the transaction.
                                                                                                                         a professional  who is ready,
                Key Economic & Housing Metrics from the                                        informed and confident throughout the transaction.
                    National Association of REALTORS®

     Expect the post-pandemic economic rebound, improving job conditions and
     stable interest rates to continue in 2021, according to a survey of more than 20
     top U.S. economic and housing experts. Lawrence Yun, NAR chief economist
     and senior vice president of research, unveiled the consensus forecast today
     during NAR’s second annual Real Estate Forecast Summit.

     The group of experts predicted:
     •   Gross Domestic Product growth of 3.5% in 2021 and 3.0% in 2022
     •   An annual unemployment rate of 6.2% next year with a decline to 5.0% in
         2022
     •   Average annual 30-year fixed mortgage rates of 3.0% and 3.25% for 2021
         and 2022, respectively
     •   Annual median home prices to increase by 8.0% in 2021 and by 5.5% in
         2022
     •   Housing starts of 1.50 million next year and 1.59 million in 2022
     •   The share of the U.S. workforce working from home to be 18% in 2021 –

     •
         down from 21% in 2020 – and 12% in 2022
         Small declines in office and hotel vacancy rates in 2021, with a slight
                                                                                                       Ready. Confident. Credible.
         increase in retail vacancies next year                                                        Ready. Confident. Credible.
                                                                                                    Professionally trained and educated from start to success.
     When asked if the Federal Open Market Committee will change the federal                        Professionally trained
                                                                                                      Use transaction  and and
                                                                                                                           legaleducated
                                                                                                                                 tools to keep
                                                                                                                                          from you
                                                                                                                                               startinformed.
                                                                                                                                                     to success.
     funds rate in 2021, 90% of the experts surveyed said they expect no change in
                                                                                                     Use transaction
                                                                                           Give unmatched            and
                                                                                                           perspective   legal
                                                                                                                       and     tools to keep
                                                                                                                           representation  toyou informed.
                                                                                                                                              protect your investment.
     the current rate of 0%. For 2022, the experts predict a rate increase of 0.25%.
                                                                                           Give unmatched perspective and representation to protect your investment.
     “It is an understatement to say the year 2020 has been filled with challenges
     and full of surprises,” said Yun. “Yet, one astonishing development has been       FOR A RELIABLE RESOURCE IN REAL ESTATE, LOOK FOR THE R.
     the hot housing market as consumers eyed record-low mortgage rates and
                                                                                        FOR A RELIABLE RESOURCE IN REAL ESTATE, LOOK FOR THE R.
     reconsidered what a home should be in a new economy with flexible work-
                                                                                                                                                   Find a local REALTOR®
     from-home schedules.”                                                                                                                        www.CapeFear.REALTOR
                                                                                                                                                   Find a local REALTOR®
                                                                                                                                          6105 Oleander Drive, Suite 102, Wilmington, NC 28403
                                                                                                                                                  www.CapeFear.REALTOR
                                                                                                                                               Phone: 910.762.7400 | Fax: 910.762.9860
                                                                                                                                          6105 Oleander Drive, Suite 102, Wilmington, NC 28403
                                                                                                                                               Phone: 910.762.7400 | Fax: 910.762.9860

26                                                                                                                                                                                               27
35TH ANNUAL                           WE’RE MORE THAN HOMES.
PARADE OF HOMES                                ™   we build communities.

      Tour the area’s finest new
         homes this spring!

     APRIL 24-25
      MAY 1-2

                                     Free
                                   Admission
                                                   For more than 55 years, we have served as the voice of the
                                                      building & development industries in Southeastern NC

                                                    Learn more about the value of a 3-in-1 membership
                                                         910-799-2611 | www.wcfhba.com
WilmingtonParadeOfHomes.com                            3801-5 Wrightsville Avenue | Wilmington, NC 28403

28                                                                                                              29
DOING BUSINESS
                                                                                                                                WITH A NEIGHBOR
                                                                                                                                    FEELS GOOD.

                                                                                                                            Jeffrey White
                                                                                                                             910-399-4670
                                                                                                                       www.coastalinsuranceadvisors.com

                                             FONVILLE MORISEY BAREFOOT

      New Home Sales & Marketing

                                        WHAT WE CAN DO FOR YOU

                                                                                    SOLD

 LAND & LOT          CONNECTING            BUILDER TEAMS &
                                                             MAXIMIZE MARGINS   SELL MORE HOMES   ELEVATE YOUR BRAND
OPPORTUNITIES   BUILDERS → DEVELOPERS   BUILDER MANAGEMENT

                     Learn how FMB can elevate your Sales & Marketing.
                                     FMBsells.com

30                                                                                                                                                        31
Contact Us Today!
                                                                                                                                              910.839.0100
                                                                                                                                 5815 Oleander Drive Unit 260
                                                                                                                                       Wilmington, NC 28403
                                                                                                                                                                                    NEW HOMES
                                                                                                                                                                                    BUILT TO
                                                                                                                                                                                    A HIGHER
     Bank Statement for Self-Employed and 1099 Earners
     Jumbo Program for Homes That Exceed Conforming Limits
     Investor Cash Flow for Real Estate Investors
                                                                                                                                                                                    STANDARD
     Asset Qualifier Allows Assets to Qualify in Lieu of Tax Returns
     Full Doc Portfolio Select for Homebuyers Only Two Years Out of Foreclosure, Bankruptcy or Other Credit Events
                                                                                                                                                                                    The Duke Energy Progress Residential
                                                                                                                                                                                    New Construction Program offers
       Angel Oak Home Loans LLC NMLS# 685842, For licensing information, go to: (www.nmlsconsumeraccess.org), Licensed in AL, AZ #0927070, Licensed by the Department of
       Financial Protection and Innovation under the California Residential Mortgage Lending Act , CO, CT, DE, DC, FL, GA #32379, ID, IL, IN, IA, KS, KY, LA, MD, MI, MN, MS, NV,
                                                                                                                                                                                    incentives to builders who construct
       Licensed by the N.J. Department of Banking and Insurance, NM, NC, OH, OK, OR, PA, Rhode Island Lender License, SC, TN, TX, VA, WA dba AOHL LLC, WI. HL_A217_0321
                                                                                                                                                                                    new homes that provide enhanced
                                                                                                                                                                                    comfort, improved air quality and
                                                                                                                                                                                    increased energy savings. Participating
                                                                                                                                                                                    builders invest in upgrades to deliver
                                                                                                                                                                                    homes that are 20% more efficient
                                                                                                                                                                                    than minimum code-compliant homes.

                                                                                                                                                                                    PARTICIPATING BUILDERS RECEIVE:
                                                                                                                                                                                    • Support from a HERS rater to develop specifications for energy-saving upgrades
                                                                                                                                                                                    • Financial incentives up to $9,000
                                                                                                                                                                                    • On-site trainings, rater inspections and additional building assistance

                                                                                                                                                                                    LEARN MORE
                                                                                                                                                                                    Contact DEPRNC@icfprogram.com today.

32                                                                                                                                                                                                                                                                     33
You can also read