Analysis of small molecules against the NMDA receptor: an insight from virtual screening and molecular dynamics simulation based ndings
←
→
Page content transcription
If your browser does not render page correctly, please read the page content below
Analysis of small molecules against the NMDA
receptor: an insight from virtual screening and
molecular dynamics simulation based findings
Garima Sharma
Jaypee University of Information Technology
Rohit Shukla
Jaypee University of Information Technology https://orcid.org/0000-0002-0759-8362
Tiratha Raj Singh ( tiratharaj@gmail.com )
Jaypee University of Information Technology https://orcid.org/0000-0003-1109-5626
Research Article
Keywords: Alzheimer’s disease, Neurofibrillary tangles, NMDA, Virtual Screening, Molecular Docking,
Molecular Dynamics Simulation, Principal Component analysis, MM-PBSA
Posted Date: May 28th, 2021
DOI: https://doi.org/10.21203/rs.3.rs-568180/v1
License: This work is licensed under a Creative Commons Attribution 4.0 International License.
Read Full License
Page 1/19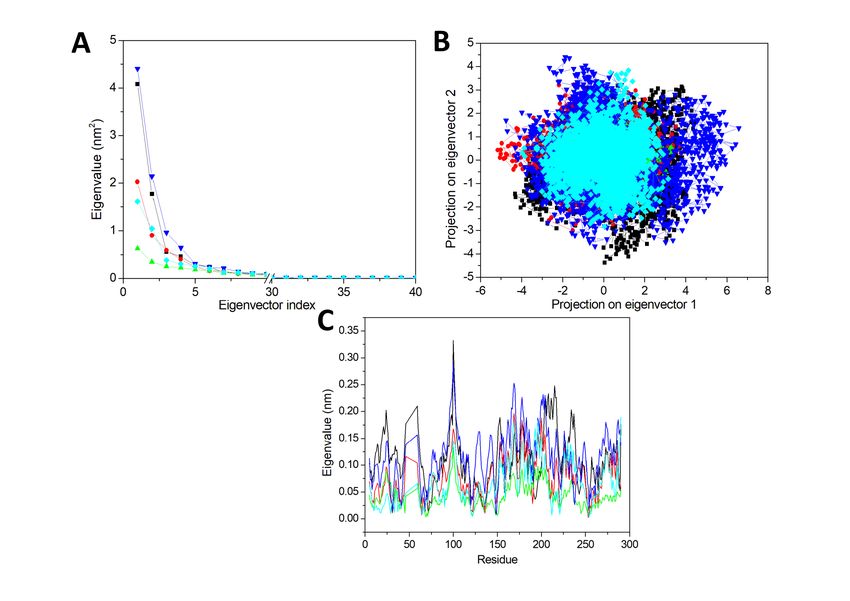
Abstract
Alzheimer’s disease (AD) is a chronic intensifying neurodegenerative disorder and accounts for three-
fourths of dementia cases. To date, there is no effective treatment available which can completely cure
AD. The available medications can slower AD progression and can provide symptomatic relaxation. The
N-methyl-d-aspartate receptor (NMDAR) plays a paramount role in the survival of neurons and synaptic
plasticity. Although, excessive function of NMDAR cause excitotoxicity. Due to this the cell death process
activated resulting into neurodegeneration and promotes AD. Hence in this study, we have screened
98,072 natural compounds by using Smina and idock. After that 154 compounds were selected and
ADMET is predicted by using the pkCSM web-based server. From the ADMET analysis, 18 compounds
were chosen and employed for the re-docking studies by using Autodock Vina. Then from the docking
result, we have selected top three complexes (NMDAR-ZINC4258884, NMDAR-ZINC8635472, and NMDAR-
ZINC15675934) and employed them for the 100 ns MDS studies. Based on MDS result analysis we have
concluded that NMDAR-ZINC4258884 and NMDAR-ZINC15675934 are the best stable complex and can
function as a lead compound against the NMDAR. Although this is a theoretical study while we have
shortlisted only two compounds out of 98072 compounds and proposed them to the scientific
community worldwide for further experimental validations.

1. Introduction
Alzheimer’s disease (AD) has been outlined as a chronic intensifying neurodegenerative disease. Its onset
is slow, but it worsens gradually over time [1]. It has been believed to be a cause of 60–70% of dementia.
The foremost common early symptom is claimed to be, “difficulty in remembering recent events”. With
the advancement in illness, symptoms include Aphasia, self-negligence, and performance problems. In
line with a report, in the last ten years, casualties from cardiovascular diseases have shown a 7.8 percent
decrease whereas casualties from AD are hyperbolic145 percent [2]. As per an estimate, 6.2 million
Americans aged 65 + are diagnosed with AD in the year 2020 [2]. In an estimate, it is predicted that in 30
years from now, dementia (showing 60–70% contribution for AD) will be affecting approximately
152 million people worldwide. An estimated four million Indians are affected by one or another form of
dementia [3]. The AD is mainly characterized by the β-amyloid plaques and neurofibrillary tangles (NFTs).
One major cause of AD is an accumulation of β-amyloid protein which is (in normal condition) the
metabolic waste product present in the fluid between brain cells [4]. The NFTs are made by the tau protein
hyperphosphorylation via the Glycogen Synthase Kinase 3β (GSK3β) and Cyclin dependent kinase 5
(CDK5) enzymes. The NFTs are present inside the neuronal cell and promotes the cell death. We have
proposed various compounds to reduce the tau phosphorylation induced by GSK3β [5,6] and CDK5 [7,8]
recently. In AD, β-amyloid comes to create amyloid plaques which are thought to instigate
neuroinflammation and disrupt the information exchange among neurons [9]. Now, in the neuron, NMDAR
which are a type of ionotropic glutamate receptors (iGluR) whose function involves the mediation of the
excitatory transmission in the brain is present [10]. The protagonist molecule NMDA (N-methyl-D-
aspartate) binds selectively to the NMDA receptors only, hence it is named as NMDA receptor. NMDA

                                                 Page 2/19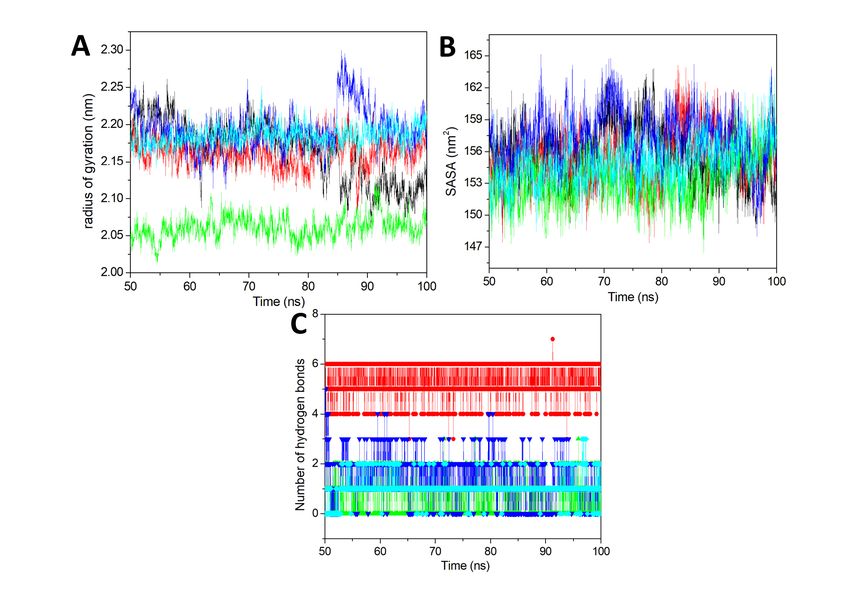
receptors areactivatedupon the binding of theglutamate and glycine (or D serine) with these receptors;
upon activation they allow the flow of the positively charged ions throughthem. They have an important
role in forming memory, learning, and synaptic plasticity (Fig. 1) [11].

NMDAR is thought to be different from other ionotropic glutamate receptors as it has voltage-dependent
activation through Mg2+ blockade removal, high Ca2+ permeability and comparably slow ligand-gated
kinetics. In normal condition, the resting membrane potential is -70mV, at this potential the NMDAR Ca2+
channel is thought to be blocked by Mg2+ [12]. In the Long-Term Potential (LTP), there is a strong and
long-lasting release of glutamate from the presynaptic terminal, which activates α-amino-3-hydroxy-5-
methyl-4-isoxazolepropionic acid receptor (AMPAR) and subsequent withdrawals of glutamate, which
ultimately removes the Mg2+ inhibition of NMDAR and thus allows the entry of Ca2+, which ultimately
leads to improved synaptic strength [13]. Studies suggest that β-amyloid proteins which accumulate in
the brains of AD patients can cause abnormal increase in synaptic glutamate levels by blocking
glutamate uptake or making glutamate free from glial cells [14]. The binding of glutamate to the NMDA
receptor triggers the extracellular Ca2+ flight that regulates membrane permeability and synaptic
transmission [14]. When glutamate levels increase abnormally, in addition to reactivation of NMDA
receptors leading to an overgrowth of Ca2+ substances that remove Mg2+ inhibition, ultimately leading to
cell division and death [15]. More influx of Ca2+ occurs since NMDARs increased the penetration of Ca2+
compared to other iGluR [16]. Therefore, blocking this receptors can be a potential treatment for AD, thus
stopping the excessive influx of Ca2+ [17–19]. The memantine is an FDA approved antagonist which
blocks the NMDAR activity and gives the symptomatic relax in the case of AD. Although it has several
side effects, hence we are proposing new compounds through this study and analysis.

We have used the structure-based virtual screening approach and 98,072 compounds were screened
against the NMDAR. After that 154 compounds were chosen for the ADMET (Absorption, Distribution,
Metabolism, Excretion, and Toxicity) analysis and then selected 18 compounds were used for the
redocking studies by using the AutoDock Vina. Finally, 3 compounds were selected and used for the 100
ns simulation. Lastly, based on MDS results we have proposed that NMDAR-ZINC4258884 and NMDAR-
ZINC15675934complexes are showing stability and these compounds can function as novel as well as
potential compounds against the NMDAR. A comprehensive methodology is shown in Fig. 2.

2. Methodology
2.1. Preparation and retrieval of Ligand and Protein
The RCSB protein data bank (PDB) was used to download the structure of the NMDA receptor protein
(PDB ID:1PBQ, 1.90 Å, X-ray) [20]. The DK1 (5,7-Dichloro-4-Hydroxyquinoline-2-Carboxylic Acid) is an
experimentally proved inhibitor and co-crystallized with this structure. The preparation of structure is
done by using Chimera 1.13.1 software, San Francisco, CA [21]. Then, by using Amber ff99SB force field
[22] the structure was subjected to minimization using Chimera 1.13.1. After the minimization step,

                                                   Page 3/19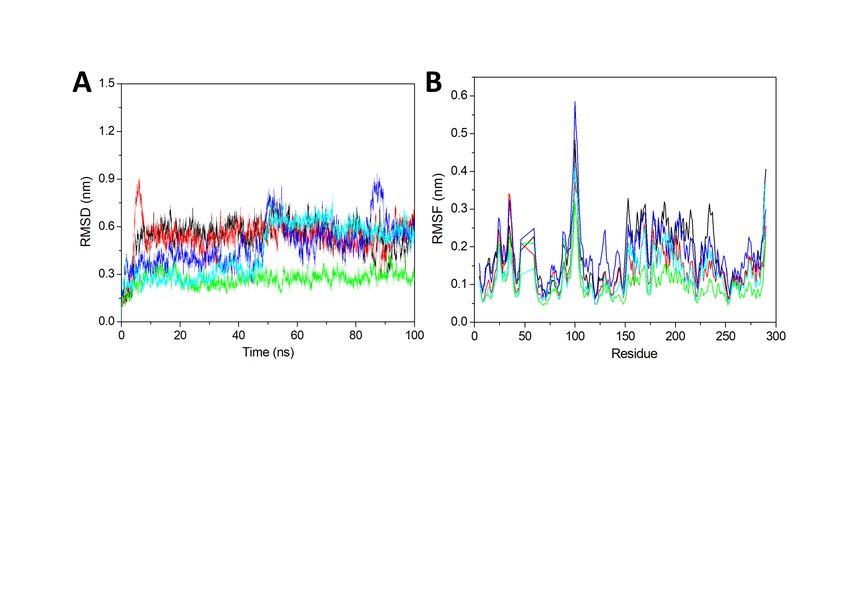
further protein structure is used in AutoDock Tools to convert from PDB to .pdbqt. The ZINC database [23]
is used to download the structure of 98,072 compoundsin .mol2 format. These ligands were converted
from mol2 to .pdbqt file format for the screening by using a Python script
(http://autodock.scripps.edu/faqs-help/how-to/how-to-prepare-a-ligand-file-for-autodock4).

2.2 Analysis of binding site for 1PBQ
The NMDA receptor protein is co-crystallized with its known inhibitor DK1. Therefore, the binding cavity
related to DK1 is selected for virtual screening. We check for the DK1 associated cavity by analysing the
DK1 interactions with NMDAR. For the grid preparation of 1PBQ, numerous residues like Gln13, Asp224,
Phe92, and Ser180, etc. were selected.

2.3 Virtual Screening
Virtual screening is an efficient process to find a potent inhibitor using computational approaches [24,25].
It is an efficient and less time-consuming process where we can screen a large compound dataset within
few days. Here we have used Smina - A fork of AutoDock Vina and idock [26] for the virtual screening.
They both are inspired from the Autodock Vina [27] method but they are less time-consuming than
Autodock Vina. The idock is a multithreaded and improved algorithm for virtual screening and very fast
compared to all other available tools. It can screen a compound within seconds. The user can define the
computer threads and based on a defined core it can screen thousands of compounds within hours.
Hence we have used these software for the virtual screening and then 154 compounds which were
showing the >= -11.5 Kcal/mol binding affinity were adopted selected for the ADMET analysis.

2.4 ADMET prediction
The ADMET prediction was done of the 154 ZINC compounds by using the pkCSM tool
(http://biosig.unimelb.edu.au/pkcsm/prediction), which is an ADMET predicting web-based server [28].
This software is freely available and to perform the prediction user can provide the ligand with the
SMILES string or draw the chemical structure on the screen. This web server contains a large dataset of
compounds approved by the FDA. Also, the dataset is available from scientific literature present in
PubMed (https://pubmed.ncbi.nlm.nih.gov/) and Google Scholar (https://scholar.google.com/). The
ADMET descriptors in absorption are CaCo2 permeability, Intestinal absorption (human), water-solubility,
p-glycoprotein substrate, p-glycoprotein 1 and 2 inhibitors, skin permeability; in Distribution are Volume of
distribution (VDss) Human, Blood brain barrier (BBB) permeability, Fraction unbound (Human), CNS
permeability; in Metabolism are Cytochrome P450 inhibitors, CYP2D6/CYP3A4 substrate; in Excretion are
Renal OCT2 substrate, Total Clearance; in Toxicity are Rat LD50, T. Pyriformis toxicity, AMES Toxicity,
Minnow Toxicity, Maximum Tolerated Dose, Hepatotoxicity, Oral Rat Chronic Toxicity, Skin Sensitization,
hERG 1 and 2 inhibitors etc. We enumerated all the above stipulations for all these 154 compounds using
the ADMET tool and choose the best out of these, which are employed for molecular docking analysis.

2.5 Molecular Docking Simulation

                                                  Page 4/19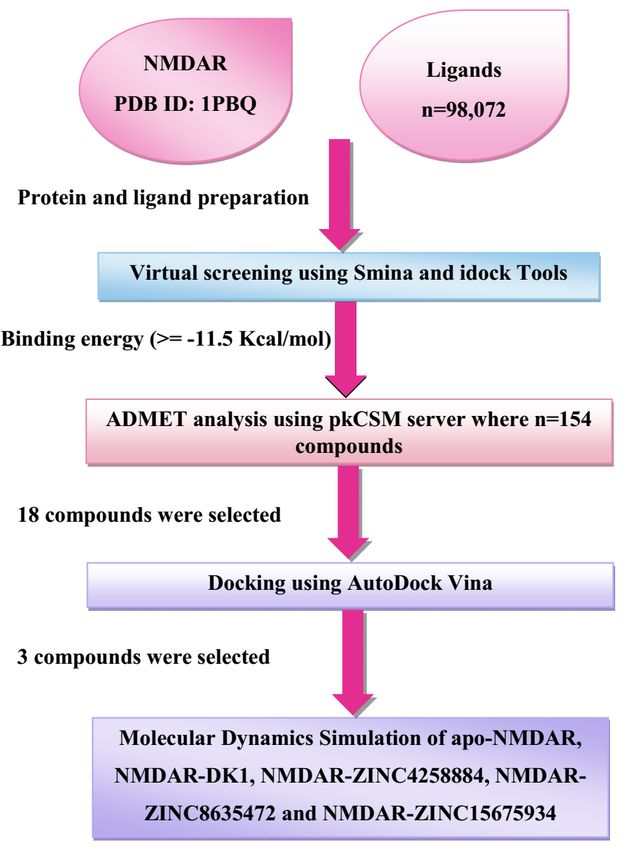
By employing ADMET prediction, 18 compounds were picked and further re-docking was employed to
them through the software AutoDock Vina [27] with the control ligand DK1. Prior to the docking the
preparation of the protein and ligands were performed by using the AutDock Tools [29]. The protein was
prepared by adding all the hydrogens, Kollman charges and by assigning the AD4 type radii. After that the
protein is saved in to the pdbqt file format. In the ligand preparation, all the hydrogens and Gasteiger
charges were added. After this the ligands were saved as a .pdbqt file. The setting of the grid box was:
Center_X = 3.909, Center_Y = 38.484, Center_Z= -18.612, numbers of points were set as, X_dimension = 40,
Y_dimension = 40, Z_dimension = 40 with 0.419 Å spacing. After this step the docking were carried out to
get the binding affinity and binding pose using Autodock Vina. For each ligand, 8 binding poses were
produced and the analysis is done on the basis of least binding energy and the best binding pose.
AutoDock Vina is more efficient when compared to AutoDock because of its rapid docking of ligands and
more accurate results [27].

2.6 Molecular dynamics simulation
GROMACS 2018.2 suite [30] was used to perform molecular dynamics (MD) simulations on the apo-
NMDAR, NMDAR-DK1, NMDAR-ZINC4258884, NMDAR-ZINC8635472 and NMDAR-ZINC15675934
complexes. A rhombic dodecahedral box having a distance of 10 Å from the closest edge was used to
solvate the complexes, thereby, adding more than 19,734 water molecules. Also, for the purpose of
neutralising the system, 4 Cl− counter ions were included. For the ligand GAFF force field was used; for
protein, Amber ff99SB-ILDN force field was used and TIP3P model was used for water. Using an isobaric-
isothermal ensemble, production runs were performed for 1 ns, after undergoing a standard preparation
routine including energy minimization, annealing, and equilibration. Other simulation conditions like the
parameters for the barostat/thermostat, the use of constraints, the modelling of electrostatic and non-
electrostatic interactions was also decided beforehand. Undergoing subsequent analysis, after the
elimination of the protein rot translation by least-squares fit with respect to the Cα atoms. Various other
analyses have also been carried out to predict the protein-ligand stability.

3. Results
3.1 Virtual screening analysis
The virtual screening has been carried out by using Smina-A fork of AutoDock Vina and idock software.
We have screened 98,072 compounds against the NMDAR and binding affinity of all these compounds
were displayed in Supplementary Table S1. The ZINC04277685 was the highest binding energy
compound in Smina virtual screening result with − 13.1 Kcal/mol binding affinity while idock showed
ZINC04258868 as the top compound having the binding affinity value as -13.29 Kcal/mol. The difference
between these top compounds prediction could be the result of different tools while we have taken the
consensus result from both the software. The ZINC39410302 is predicted as the lowest binding affinity
compound by Smina virtual screening with − 3.9 Kcal/mol binding affinity while idock predicted
ZINC01690436 as the lowest binding affinity compound with − 3.99 Kcal/mol. After that, we have taken

                                                  Page 5/19
154 compounds which are showing >= -11.5 Kcal/mol binding affinity in both the tools and used for the
ADMET prediction.
3.2 ADMET Descriptors Analysis
ADMET stands for Absorption, Distribution, Metabolism, Excretion, and Toxicity, these features are
essential in support of drug designing studies and the drug cannot be validated to enter into the market
until it fulfils the ADMET requirements. Therefore, this step is of utmost important. We employed the
selected 154 compounds in the ADMET analysis via the pkCSM server. As we are targeting the Central
Nervous System, the BBB is the most important parameter here, 31 compounds were rejected based on
BBB. The second priority was given to CNS permeability and 12 compounds were rejected according to
this. The next priority was given to the absorption of the drug, as it is an important factor for oral drug
discovery. In the absorption category, HIA is evaluated, as it tells us if the drug is absorbed in the intestine
or not, based on this, no compound was rejected. Caco-2 cell permeability is also checked to see the drug
assimilation in the large intestine, 94 compounds were rejected based on this. Next, in absorption, it is
checked that whether a given compound is likely to be a substrate of p-glycoprotein (Pgp) or not. Pgp
usually functions as a biological barrier by excluding xenobiotics and toxins out from the cells, 2
compounds were rejected in this step (Supplementary Table S2 and S3).
Next, we check for the Cytochrome P450 barriers (CYP450). Here it is assessed that for a given isoform,
the potential drug molecule is likely to be a CYP450 inhibitor or not. This enzyme is present in the liver
and is responsible for the detoxification of the xenobiotics. Hence, it can deactivate many drugs. Here we
look for the CYP2D6/CYP3A4 substrate, which lets us know that whether the drug can be metabolized so
that it can be removed from the body. In the case of CYP2D6, we got only 11 positive results whereas in
the case of CYP3A4 we got 151 positive results and only3 compounds were rejected (Supplementary
Table S4).
Another important criterion for drug discovery is to assess the toxicity of the potential drug molecules.
Even if the efficacy of the drug is high, it cannot be launched in the market if it is toxic, we checked for the
AMES toxicity which tells us about the possibility of carcinogenicity, based on this, 66 compounds were
rejected. hERG is an ion channel known for the electrical activity of the heart. hERG codes for the
potassium channels. Inhibition of these channels leads to long QT-syndrome which leads to the fatal
ventricular arrhythmia. Therefore, we have to look for the drug candidates that do not inhibit hERG
channels, keeping this as the basis, further 2 compounds were rejected (Supplementary Table S5).
Considering all these parameters, a total of 18 potential drug targets were selected from the 154
compounds.
3.3 Molecular Docking Simulation Analysis
The 18 compounds chosen via ADMET analysis along with the control compound DK1 were submitted to
molecular docking through AutoDock Vina software. The control compound is redocked using the
AutoDock Vina, giving the binding affinity to be as -8.6 Kcal.mol− 1. The compound ZINC705167
Page 6/19illustrated the highest binding affinity of -12.7 Kcal.mol− 1 and the compound ZINC705168 illustrated the
lowest binding energy of -8.7 Kcal.mol− 1, followed by the least binding affinity of the control compound
of -8.6 Kcal.mol− 1. The binding energy, hydrogen bonds, interacting residues from AutoDock Vina, Smina
and idock are tabulated in the Supplementary Table S6 for all the chosen selected ligands along with the
DK1. The respective ZINC IDs, binding affinities, 2D chemical structure for the top 3 selected compounds
with DK1 are shown in Table 1.
3.4 Selected compounds analysis
3.4.1 DK1
The DK1 exhibited the binding affinity of -8.6, -8.6 and − 8.71 Kcal.mol− 1 by using Autodock Vina, Smina,
and idock respectively. The DK1 showed less binding affinity in comparison to all the other ligands which
represents that predicted hits are good as compare to DK1. We have seen 2, 4 and 5 hydrogen bonds
from Autodock Vina, Smina, and idock respectively. We have seen many common residues such as
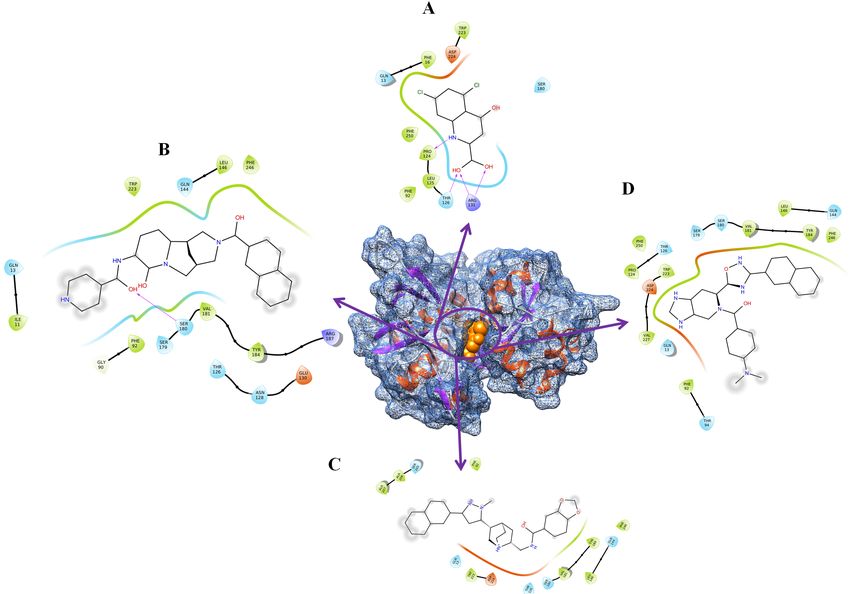
Pro124 and Thr126 etc. from all three software’s. The residue interaction diagram is shown in Fig. 3A.
The detailed residues are shown in the Supplementary Table S6.
3.4.2 ZINC4258884
The ZINC4258884 exhibited the binding affinity of -12.5, -12.5, and − 12.77 Kcal.mol− 1 by using Autodock
Vina, Smina, and idock respectively. We have analysed the Autodock Vina docking complex which is
showing one hydrogen bond with the Ser180 and various other residues are involved in the hydrophobic
interaction. Various common residues are also found in all three docking software. The residue
interaction diagram is shown in Fig. 3B. The detailed residues are shown in the Supplementary Table S6.
3.4.3 ZINC8635472
The ZINC8635472 exhibited the binding affinity of -12.1, -12.1, and − 12.18 Kcal.mol− 1 by using Autodock
Vina, Smina, and idock. Using AutoVina software, the complex forms 1 hydrogen bond with Thr126. The
complex is also stabilized by many hydrophobic interactions. Common residues are also found in all
three docking software. The residue interaction diagram is shown in Fig. 3C. The detailed residues are
shown in the Supplementary Table S6.
3.4.4 ZINC15675934
The ZINC15675934 is also docked by all the software against the NMDAR. It showed − 11.9, -12.2, and −
12.3 Kcal.mol− 1 from Autodock Vina, Smina, and idock software respectively. We have not seen any
hydrogen bonds between the NMDAR and ZINC15675934 through the AutodockVina while the complex is
seen to be stabilized by many other interactions like hydrophobic interactions etc. The residue interaction
diagram is shown in Fig. 3D. The detailed residue interaction is shown in the Supplementary Table S6.
3.5 Molecular dynamics simulation
Page 7/19The Molecular dynamics simulation is a widely used technique to evaluate the docked stability of protein-
ligand complex. Therefore this study comprises of using MDS for the validation of docking complexes.
We have selected 3 top complexes with the apo-NMDAR and NMDAR-DK1 for the 100 ns simulation.
Various structural parameters such as root mean square deviation (RMSD), root mean square fluctuation
(RMSF), Radius of gyration (Rg), Solvent accessible surface area (SASA), number of hydrogen bonds and
Principal component analysis (PCA) were carried out.
3.5.1 Stability analysis
For the purpose of prediction of the stability of simulation, the RMSD has been carried out. We have
computed the RMSD value for 100 ns and plotted it in Fig. 4A. It represents the deviation from the initial
structure to the next structure. The Fig. 4A represents that after the 50 ns all the simulations got the
stability and can be used for the analysis. The average RMSD for apo-NMDAR, NMDAR-DK1, NMDAR-
ZINC4258884, NMDAR-ZINC8635472 and NMDAR-ZINC15675934 was 0.54, 0.53, 0.27, 0.48 and 0.45 nm
respectively. The average RMSD that after ligand binding all the complexes got the stability as compare
to apo-NMDAR and control ligand DK1. The predicted hits also showed less RMSD value in comparison
to the DK1 and representing a well-stable complex. Hence from here, we have predicted that all our
complexes got the equilibrations and the simulation trajectories are producing accurate results. Hence we
considered last 50 ns trajectories for further analysis.
3.5.2 Residue mobility analysis
The residue level mobility analysis by using the RMSF analysis was carried out. This is a very important
analysis in the case of NMDAR because it is an ion channel and very flexible in nature. Hence it will show
the higher fluctuation in several residues. We have plotted the residue mobility in the Fig. 4B. In the
Fig. 4B, we have seen very high fluctuation between the residues 94–106. The plot showed higher
fluctuation in the maximum region of the protein as compared to the general fluctuation due to the ion
channel nature of the NMDAR. The average RMSF for apo-NMDAR, NMDAR-DK1, NMDAR-ZINC4258884,
NMDAR-ZINC8635472 and NMDAR-ZINC15675934 was 0.17, 0.13, 0.10, 0.18 and 0.12 nm respectively.
The highest fluctuation is showed by NMDAR-ZINC8635472 whilst in comparison to the apo-NMDAR and
NMDAR-DK1, NMDAR-ZINC4258884 and NMDAR-ZINC15675934 were seen to show a lesser fluctuation.
It displayed the stability of NMDAR-ZINC4258884 and NMDAR-ZINC15675934 and showed their potential
use as a lead compound against NMDAR.
3.5.3 Compactness analysis
The compactness of the complexes has been analyzed by using the Rg analysis. The Rg has been
measured from the radius of the protein and represents the compactness of the protein. Hence here also
we have calculated the Rg for the last 50 ns equilibrated trajectory. It is plotted in Fig. 5A. In Fig. 5A we
can see that NMDAR-ZINC4258884 showed very least value as compare to all other complexes. Other
complexes and apo-NMDAR showed a similar type of Rg value. The average Rg value for apo-NMDAR,
NMDAR-DK1, NMDAR-ZINC4258884, NMDAR-ZINC8635472, and NMDAR-ZINC15675934 was 2.16, 2.16,
Page 8/192.06, 2.19, and 2.18 nm respectively. Here also the NMDAR- ZINC8635472 showed the highest value as
compare to all others while NMDAR-ZINC4258884 and NMDAR-ZINC15675934 showed the good Rg
value and showing less fluctuation. Hence from here also we can say that NMDAR-ZINC4258884 and
NMDAR-ZINC15675934 are stable complexes in the respect of Rg analysis.
3.5.4 Solvent accessible surface area analysis
The SASA has been carried out for the prediction ofthe ligand-induced solvent-accessible area changes.
We worked upon usingthe last 50 ns trajectory and calculated the SASA value and plotted it in Fig. 5B.
The Fig. 5B showed a similar type of pattern for all the systems. Hence we have analyzed the average
SASA value for all the systems. The average SASA value for apo-NMDAR, NMDAR-DK1, NMDAR-
ZINC4258884, NMDAR- ZINC8635472, and NMDAR-ZINC15675934 was 155.81, 155.25, 153.45, 157.31,
and 154.85 nm2. Here also we have found that NMDAR-ZINC8635472 is showing the highest SASA value
in comparison to the other two complexes. Comparing the results with control compound DK1 and apo-
NMDAR, the values for NMDAR-ZINC4258884 and NMDAR-ZINC15675934 were seen to be less.The
SASA result also agrees with RMSD, RMSF, and Rg results that NMDAR-ZINC4258884 and NMDAR-
ZINC15675934 are the stable complexes.
3.5.5 Hydrogen bonds analysis
After that, the number of hydrogen bonds for the last 50 ns was computed and was plotted in Fig. 5C.
The hydrogen bonds are crucial for ligand-protein stability. From the Fig. 5C, we can see that NMDAR-DK1
exhibited highest number of hydrogen bonds in comparison to all the estimated complexes. The NMDAR-
DK1 showed the average 4–6 hydrogen bonds throughout the simulation. After that NMDAR-
ZINC8635472 showed more hydrogens bonds such as 1–4 for all simulations. The NMDAR-
ZINC4258884 and NMDAR-ZINC15675934 showed 0–2 hydrogen bonds throughout the simulation. The
hydrogen bond analysis represents the stability of all the complexes and more number of hydrogen
bonds is observed in the DK1.
3.5.6 Principal Component analysis
The PCA analysis has been carried out for predicting the correlated motions ligand binding. Here, the
calculation of the eigenvalue vs. and eigenvector was performed. Due to the clear depiction of the result
only the first 40 eigenvectors were selected for the analysis and were plotted in Fig. 6A.
In the Fig. 6A we can see that NMDAR-ZINC8635472 is showing very high motions in comparison to all
the other complexes. After this complex, apo-NMDAR showed the higher motions. The NMDAR-
ZINC4258884 is showing very few motions and stable complex as compare to all other systems. To
clearly understand the motions induced by ligand binding, we have computed the correlated motions
(percentage wise) for the first 10 eigenvectors. The apo-NMDAR, NMDAR-DK1, NMDAR-ZINC4258884,
NMDAR-ZINC8635472, and NMDAR-ZINC15675934 showed 90.62%, 86.49%, 74.34%, 91.03%, and 84.15
% correlated motions. Here also we can see that NMDAR-ZINC8635472 and apo-NMDAR are showing
Page 9/19very high motions while NMDAR-ZINC4258884 and NMDAR-ZINC15675934 are showing the lowest
motions and represents the stable complex.
From here we have seen that the overall dynamics of the protein is accountable for the first few
eigenvectors. Hence, the first two eigenvectors were selected and plotted against each other in phase
space and shown in Fig. 6B. The Fig. 6B represents that NMDAR-ZINC15675934 and NMDAR-
ZINC4258884 is the most stable cluster in comparison to all other complexes. These complexes showed
very stable cluster which represents the complex stability. After these two the NMDAR-DK1 is showing the
stable cluster. We have seen a very wide and dispersed cluster for the NMDAR-ZINC8635472 and apo-
NMDAR. The 2D projection report also represents that ZINC15675934 and NMDAR-ZINC4258884 are the
stable complex as compare to the NMDAR-ZINC8635472.
Lastly, we have predicted the residue-wise correlated motions from the last 50 ns trajectory using only
one eigenvector and plotted in Fig. 6C. Here we have seen a similar pattern as like RMSF analysis. We
have seen a high peak from residues 87–109. The overall eigRMSF is also high for all the residues. The
apo-NMDAR, NMDAR-DK1, NMDAR-ZINC4258884, NMDAR- ZINC8635472 and NMDAR-ZINC15675934
showing average eigRMSF is 0.11, 0.07, 0.04, 0.11 and 0.06 nm respectively. Here it was observed that
average eigRMSF for apo-NMDAR and NMDAR-ZINC8635472 is high as compare to other complexes.
The NMDAR-DK1 is also showing less eigRMSF value while our predicted hits NMDAR-ZINC4258884 and
NMDAR-ZINC15675934 are showing very less eigRMSF value and representing the well stable
complexes.
The overall PCA result also agrees with the above analysis namely RMSD, RMSF, hydrogen bond analysis
and SASA. These all result indicates that out of three complexes the NMDAR-ZINC4258884 and NMDAR-
ZINC15675934 are stable and has a potential to act as lead compounds.
4. Conclusion
AD is a progressive neurological disorder mainly affecting old age people. There is no medication
available to cure AD. It is a multifactorial disease and several proteins simultaneously activate and
spread the disease. The NMDAR is a key target in the case of AD hence we have targeted the NMDAR
with the natural compounds. We started our study with 98,072 compounds and we have picked out 154
compounds from the virtual screening and performed the ADMET analysis. From the ADMET we have
selected the best 18 compounds and these compounds were employed for the docking studies by using
AutoDock Vina software. Finally, three compounds were chosen and MDS study of 100 ns with the apo-
NMDAR and NMDAR-DK1 was performed on them. Then we have carried out various structural parameter
analyses, in particular RMSF, Rg, SASA, hydrogen bonds analysis, and PCA. From all these analyses, we
have proposed that ZINC4258884 and ZINC15675934 can act as a lead compound against the NMDAR
to treat AD. The worldwide scientists can test these compounds employing both in-vivo and in-vitro
methods.
Page 10/19Declarations
Competing interest
The authors declare that there are no competing interests.
Author’s contributions
TRS conceived the study. GS and RS carried out all the experiments and the data analysis. GS, RS and
TRS participated in its overall design and coordination of the study. The first draft of the manuscript was
prepared by GS and RS. All authors read and approved the final manuscript.
Acknowledgment
RS and TRS want to thanks the ICMR (ISRM/11(53)/2019) for providing the Senior Research Fellowship
to RS.
References
1. Verma, S.; Kumar, A.; Tripathi, T.; Kumar, A. Muscarinic and Nicotinic Acetylcholine Receptor Agonists:
Current Scenario in Alzheimer’s Disease Therapy. J. Pharm. Pharmacol., 2018, 70, 985–993.
2. 2021 Alzheimer’s Disease Facts and Figures. Alzheimers Dement. J. Alzheimers Assoc., 2021, 17, 327–
406.
3. Alzheimer’s & Dementia Help | INDIA // (accessed May 28, 2021).
4. Cao, J.; Hou, J.; Ping, J.; Cai, D. Advances in Developing Novel Therapeutic Strategies for Alzheimer’s
Disease. Mol. Neurodegener., 2018, 13, 64.
5. Shukla, R.; Singh, T.R. High-Throughput Screening of Natural Compounds and Inhibition of a Major
Therapeutic Target HsGSK-3β for Alzheimer’s Disease Using Computational Approaches. J. Genet. Eng.
Biotechnol., 2021, 19, 61.
6. Shukla, R.; Munjal, N.S.; Singh, T.R. Identification of Novel Small Molecules against GSK3β for
Alzheimer’s Disease Using Chemoinformatics Approach. J. Mol. Graph. Model., 2019, 91, 91–104.
7. Shukla, R.; Singh, T.R. Virtual Screening, Pharmacokinetics, Molecular Dynamics and Binding Free
Energy Analysis for Small Natural Molecules against Cyclin-Dependent Kinase 5 for Alzheimer’s Disease.
J. Biomol. Struct. Dyn., 2020, 38, 248–262.
8. Shukla, R.; Singh, T.R. Identification of Small Molecules against Cyclin Dependent Kinase-5 Using
Chemoinformatics Approach for Alzheimer’s Disease and Other Tauopathies. J. Biomol. Struct. Dyn.,
2020, 0, 1–13.
Page 11/199. Weller, J.; Budson, A. Current Understanding of Alzheimer’s Disease Diagnosis and Treatment.
F1000Research, 2018, 7.
10. Wang, R.; Reddy, P.H. Role of Glutamate and NMDA Receptors in Alzheimer’s Disease. J. Alzheimers
Dis. JAD, 2017, 57, 1041–1048.
11. Newcomer, J.W.; Farber, N.B.; Olney, J.W. NMDA Receptor Function, Memory, and Brain Aging.
Dialogues Clin. Neurosci., 2000, 2, 219–232.
12. Blanke, M.L.; VanDongen, A.M.J. Activation Mechanisms of the NMDA Receptor. In Biology of the
NMDA Receptor; Van Dongen, A.M., Ed.; Frontiers in Neuroscience; CRC Press/Taylor & Francis: Boca
Raton (FL), 2009.
13. Abbott, J.J.; Howlett, D.R.; Francis, P.T.; Williams, R.J. Abeta(1–42) Modulation of Akt Phosphorylation
via Alpha7 NAChR and NMDA Receptors. Neurobiol. Aging, 2008, 29, 992–1001.
14. Danysz, W.; Parsons, C.G. Alzheimer’s Disease, β-Amyloid, Glutamate, NMDA Receptors and
Memantine–Searching for the Connections. Br. J. Pharmacol., 2012, 167, 324–352.
15. Zhang, Y.; Li, P.; Feng, J.; Wu, M. Dysfunction of NMDA Receptors in Alzheimer’s Disease. Neurol. Sci.,
2016, 37, 1039–1047.
16. Liu, J.; Chang, L.; Song, Y.; Li, H.; Wu, Y. The Role of NMDA Receptors in Alzheimer’s Disease. Front.
Neurosci., 2019, 13.
17. Kumar, A.; Nisha, C.M.; Silakari, C.; Sharma, I.; Anusha, K.; Gupta, N.; Nair, P.; Tripathi, T.; Kumar, A.
Current and Novel Therapeutic Molecules and Targets in Alzheimer’s Disease. J. Formos. Med. Assoc.,
2016, 115, 3–10.
18. Folch, J.; Petrov, D.; Ettcheto, M.; Abad, S.; Sánchez-López, E.; García, M.L.; Olloquequi, J.; Beas-Zarate,
C.; Auladell, C.; Camins, A. Current Research Therapeutic Strategies for Alzheimer’s Disease Treatment.
Neural Plast., 2016, 2016, 8501693.
19. Jewett, B.E.; Thapa, B. Physiology, NMDA Receptor. In StatPearls; StatPearls Publishing: Treasure
Island (FL), 2021.
20. Armstrong, N.; Gouaux, E. Mechanisms for Activation and Antagonism of an AMPA-Sensitive
Glutamate Receptor: Crystal Structures of the GluR2 Ligand Binding Core. Neuron, 2000, 28, 165–181.
21. Pettersen, E.F.; Goddard, T.D.; Huang, C.C.; Couch, G.S.; Greenblatt, D.M.; Meng, E.C.; Ferrin, T.E. UCSF
Chimera–a Visualization System for Exploratory Research and Analysis. J. Comput. Chem., 2004, 25,
1605–1612.
Page 12/1922. Lindorff-Larsen, K.; Piana, S.; Palmo, K.; Maragakis, P.; Klepeis, J.L.; Dror, R.O.; Shaw, D.E. Improved
Side-Chain Torsion Potentials for the Amber Ff99SB Protein Force Field. Proteins, 2010, 78, 1950–1958.
23. Sterling, T.; Irwin, J.J. ZINC 15 – Ligand Discovery for Everyone. J. Chem. Inf. Model., 2015, 55, 2324–
2337.
24. R, S.; H, S.; T, T. Structural and energetic understanding of novel natural inhibitors of Mycobacterium
tuberculosis malate synthase https://pubmed.ncbi.nlm.nih.gov/30206985/ (accessed Jul 21, 2020).
25. Shukla, R.; Shukla, H.; Tripathi, T. Structure-Based Discovery of Phenyl-Diketo Acids Derivatives as
Mycobacterium Tuberculosis Malate Synthase Inhibitors. J. Biomol. Struct. Dyn., 2021, 39, 2945–2958.
26. Li, H.; Leung, K.; Wong, M. Idock: A Multithreaded Virtual Screening Tool for Flexible Ligand Docking.
In 2012 IEEE Symposium on Computational Intelligence in Bioinformatics and Computational Biology
(CIBCB); 2012; pp. 77–84.
27. Trott, O.; Olson, A.J. AutoDock Vina: Improving the Speed and Accuracy of Docking with a New
Scoring Function, Efficient Optimization and Multithreading. J. Comput. Chem., 2010, 31, 455–461.
28. Pires, D.E.V.; Blundell, T.L.; Ascher, D.B. PkCSM: Predicting Small-Molecule Pharmacokinetic and
Toxicity Properties Using Graph-Based Signatures. J. Med. Chem., 2015, 58, 4066–4072.
29. Morris, G.M.; Huey, R.; Lindstrom, W.; Sanner, M.F.; Belew, R.K.; Goodsell, D.S.; Olson, A.J. AutoDock4
and AutoDockTools4: Automated Docking with Selective Receptor Flexibility. J. Comput. Chem., 2009, 30,
2785–2791.
30. Abraham, M.J.; Murtola, T.; Schulz, R.; Páll, S.; Smith, J.C.; Hess, B.; Lindahl, E. GROMACS: High
Performance Molecular Simulations through Multi-Level Parallelism from Laptops to Supercomputers.
SoftwareX, 2015, 1–2, 19–25.
Figures
Page 13/19Figure 1
An illustrative diagram to represent the NMDAR activation and its binding site.
Page 14/19Figure 2
A complete workflow of the methodology.
Page 15/19Figure 3
The ligand interaction diagram. (A) DYRK1A-DK1. (B) DYRK1A-ZINC4258884. (C) DYRK1A-ZINC8635472
and (D) DYRK1A-ZINC15675934.
Page 16/19Figure 4
RMSD and RMSF. (A) RMSD of 100 ns at 300K. (B) RMSF for all the residues. The black, red, green, blue,
and cyan represents apo-NMDAR, NMDAR-DK1, NMDAR-ZINC4258884, NMDAR- ZINC8635472, and
NMDAR-ZINC15675934 respectively.
Page 17/19Figure 5
Radius of gyration, SASA and Number of hydrogen bonds. (A) Radius of gyration vs. time for all the
systems. (B) SASA value vs. time for all the systems. (C) Number of hydrogen bonds vs. time. All the
values were computed via the last 50 ns trajectory. The black, red, green, blue, and cyan represents apo-
NMDAR, NMDAR-DK1, NMDAR-ZINC4258884, NMDAR-ZINC8635472, and NMDAR-ZINC15675934
respectively.
Page 18/19Figure 6
Principal Component analysis. (A) Eigenvalue vs.first 40 eigenvector at 300 K. (B) 2D projection plot for
all the selected complexes. (C) EigRMSF vs. residue for all the systems. All the values were computed
from the last 50 ns trajectory. The black, red, green, blue, and cyan represents apo-NMDAR, NMDAR-DK1,
NMDAR-ZINC4258884, NMDAR- ZINC8635472, and NMDAR-ZINC15675934 respectively.
Supplementary Files
This is a list of supplementary files associated with this preprint. Click to download.
SupplementryTable2and6.docx
SupplemetaryTable1.xlsx
Page 19/19You can also read