High probability of yield gain through conservation agriculture in dry regions for major staple crops - Nature
←
→
Page content transcription
If your browser does not render page correctly, please read the page content below

www.nature.com/scientificreports
OPEN High probability of yield gain
through conservation agriculture
in dry regions for major staple
crops
Yang Su1*, Benoit Gabrielle1, Damien Beillouin2,4,5 & David Makowski2,3
Conservation agriculture (CA) has been promoted to mitigate climate change, reduce soil erosion,
and provide a variety of ecosystem services. Yet, its impacts on crop yields remains controversial.
To gain further insight, we mapped the probability of yield gain when switching from conventional
tillage systems (CT) to CA worldwide. Relative yield changes were estimated with machine
learning algorithms trained by 4403 paired yield observations on 8 crop species extracted from 413
publications. CA has better productive performance than no-till system (NT), and it stands a more
than 50% chance to outperform CT in dryer regions of the world, especially with proper agricultural
management practices. Residue retention has the largest positive impact on CA productivity
comparing to other management practices. The variations in the productivity of CA and NT across
geographical and climatical regions were illustrated on global maps. CA appears as a sustainable
agricultural practice if targeted at specific climatic regions and crop species.
Conservation agriculture was originally designed to decrease soil erosion while sustaining crop productivity
in the long run1. It consists of three principles: preserving a permanent soil cover, minimizing soil disturbance
(going as far as NT), and diversifying crop species2. Under certain environmental conditions, CA system can
provide positive environmental externalities such as increased biodiversity, enhanced carbon sequestration and
improved soil quality through an increase in soil organic m atter3,4, and is expected to enhance soil fertility, soil
structure and water retention properties over t ime5–7, thereby CA could increase crop yields in particularly in
regions experiencing water s carcity8. Nonetheless, its impacts on crop yield remains controversial. It is also
reported that CA may lead to a yield reduction1,9 especially when the principles of conservation agriculture
are only partially applied (e.g. in NT system without soil cover or without rotation)1,9,10. Further analyses were
conducted to reveal how the productive performance of CA and NT system varies as the function of several
interacting factors such as agricultural management practices1,9,11, soil characteristics11, crop species1,12 and
climatic conditions1,9,11,13. However, the dataset used in those analyses only provide no or limited information
on soil characteristics, climate variables, and management practices. In particular, information on fertilizer
inputs, weed and pest control, and intra- and inter- annual climatic variability were frequently missing. To date,
a comprehensive synthesis of the productivity of CA and NT system at the global scale, including multiple crops,
a wider range of climatic parameters on yields, and a map showing the local productivity of CA and NT vs. CT
at the global scale is still lacking.
In this paper, we compared the productive performance of CA and NT vs. CT under different climate con-
ditions and different agricultural managements based on a new global d ataset14,15. This dataset contains yield
comparisons of NT vs. CT, and CA vs. CT, where CA was defined as NT with crop rotation and soil cover based
on FAO’s d efinition16. In contrast with previous papers, we used here a probabilistic approach to analyse the
dataset. Machine learning m odels17,18 were built to estimate the probability that CA (and NT) outperforms CT,
and to compute plausible ranges of relative yield change when shifting from CT to CA (or NT) systems for eight
major crops, i.e. spring barley, cotton, maize, rice, sorghum, soybean, sunflower, and winter wheat. Unlike pre-
vious studies, we included a wider range of climate drivers (with their inter- and intra-annual variabilities) in
1
UMR ECOSYS, INRAE AgroParisTech, Université Paris-Saclay, 78850 Thiverval‑Grignon, France. 2UMR Agronomie,
INRAE AgroParisTech, Université Paris-Saclay, 78850 Thiverval‑Grignon, France. 3Applied Mathematics and
Computer Science (MIA 518), INRAE AgroParisTech, Université Paris-Saclay, 75005 Paris, France. 4CIRAD, UPR
HortSys, 34398 Montpellier, France. 5HortSys, Univ Montpellier, CIRAD, Montpellier, France. *email: yang.su@
inrae.fr
Scientific Reports | (2021) 11:3344 | https://doi.org/10.1038/s41598-021-82375-1 1
Vol.:(0123456789)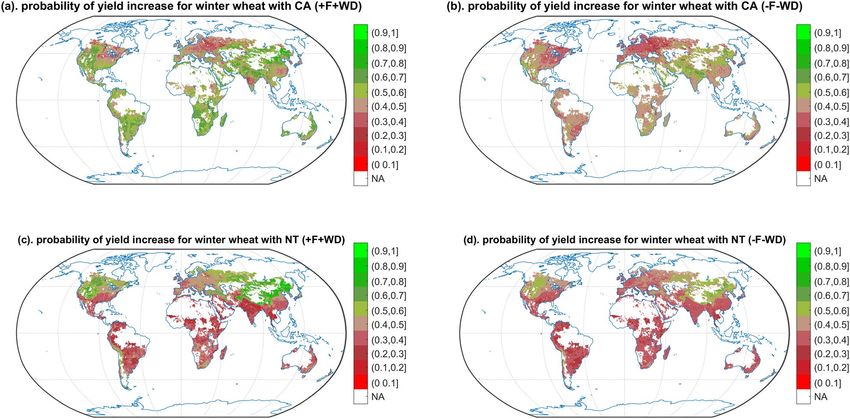
www.nature.com/scientificreports/
the models predicting the impact of CA and NT on crop yields, rather than relying on aridity indices or broad
climate zones. This provided further insight into the effects of climate on the comparison with conventional
agricultural systems.
Data collection and analysis. A systematic literature review was performed in February of 2020 (see Sup-
plementary S1). We collected the papers cited in above mentioned meta-analyses1,9,11, supplemented them by the
most recently published experimental studies. The yield data of NT and CT, details of experimental site and
agricultural management practices were extracted from these papers, with a broader set of climatic parameters
from external databases. In the end, 4403 paired yield comparisons between NT (or CA when NT is imple-
mented with soil cover, and crop rotation) and CT were collected from 413 papers, along with the information
of crop types, years and locations of the experiments, and the detailed agricultural management practices such
as crop irrigation, fertilization, the control of weeds and pests, crop rotation, the management of crop residue
and soil cover. Additional data were extracted from several external databases, including crop growing season19,20,
soil texture21 and climate factors such as precipitation balance ( precipitation22—potential evapotranspiration23,24),
minimum temperature25, average temperature22, maximum temperature25 throughout the growing season in a
particular year. The observations covered 50 countries (see Supplementary S2) and 8 crops. Pairs of yield values
YieldCA(orNT)
were used to compute the yield ratios of CA (or NT) to CT YieldCT and the relative yield change ratios
YieldCA(orNT) −YieldCT
YieldCT .
Machine learning models, namely random forest and quantile regression forest were developed to analyse
the database. The inputs of both models were the climatic conditions throughout growing season, crop type, soil
texture, and the agricultural management practices. The output of the random forest model was the probability
yield gain of CA (or NT) vs. CT (yield ratio > 1). The performance of this model was assessed by estimating the
area under the ROC curve by leave-one-out cross validation (LOOCV) (AUC = 0.79, see Supplementary S3).
The output of quantile regression forest model was the 1st and 3rd quartile of relative yield change ratios, cor-
responding to levels of losses and gains achieved in 25% and 75% of the cases. The performance of this model
was assessed using a specific LOOCV procedure to check that the proportion of yield ratio in the observation
within the predicted intervals defined by the two quartiles (25th and 75th quantiles) was close to 50% (51.3%,
see Supplementary S4)26.
To predict the global performance of CA (and NT) vs. CT, the two trained machine learning models were
supplemented with global climate data (the average of 1981–2010), agricultural management practices (NT:
without crop rotation and without soil cover, CA: with crop rotation and with soil cover, CT: without crop rota-
tion and without soil cover), the masks of crop presence27, irrigation27 and soil t exture21. Details of model setting
are available in Supplementary S5. Model results were then projected on map.
Results
The functional relationships among the probability of yield gain from CA (and NT) vs. CT, the climatic fac-
tors and the agricultural management practices were demonstrated through partial dependence p lots28,29. The
results showed that CA has better performance than NT due to the positive effects of soil cover and crop rotation
on crop yield (Fig. 1a,b). Fertilizer application increased the productivity of CA and NT systems as well (Fig. 1c).
The probability of yield gain from CA was slightly higher with weed and pest control under the dry conditions,
while there was no significant effect of weed and pest control on NT systems (Fig. 1d). Irrigation improved the
performance of NT systems, but decreased the competitiveness of CA vs. CT (Fig. 1e). Our results also showed
that both CA and NT practices were likely to result in a better productivity in regions where water stress prevails
compared to wetter conditions (Fig. 1). Here, we defined a relatively dry region (region #1) and a relatively wet
region (region #2) based on the precipitation balance: region #1 indicates that the accumulated precipitation
balance throughout the growing season is lower than 0 mm, while region #2 indicates a positive balance. Further
analyses on the probability of yield increase and 1st and 3rd quartile of relative yield change for different crops
in relatively dry (region #1) and wet (region #2) regions also showed that, in general, CA outperformed NT, and
that CA and NT have better performance in regions that were relatively dry (Fig. 2d, Supplementary S8d, S11d,
S14d, S16d, S19d, S22d, S25d). For winter wheat, the mean probability of yield gain with CA vs. CT is 56% and
47% in region #1 and region #2, respectively (Fig. 2b); The plausible range of yield change when shifting from
CT to CA in region #1 is from − 0.11 to 0.51, and − 0.15 to 0.17 for region #2 (Fig. 2d).
Probabilities of yield gain show important geographical variations. CA, in particular when associated with
fertilization and weed and pest control, is likely to lead to a yield gain compared to CT in North-western America
for spring barley (Supplementary S9a,b), maize (Fig. 4a,b), sorghum (Supplementary S20a,b), sunflower (Supple-
mentary S26a,b) and winter wheat (Fig. 3a,b); In Pakistan and the west of India for spring barley (Supplementary
S9a,b), cotton (Supplementary S12a,b), maize (Fig. 4a,b), sorghum (Supplementary S20a,b) and winter wheat
(Fig. 3a,b); In north of China for cotton (Supplementary S12a,b), sorghum (Supplementary S20a,b), sunflower
(Supplementary S26a,b), and winter wheat (Fig. 3a,b). On the other hand, CA, especially without fertilization
and the control of weeds and pests, has lower probability of yield gain in tropical region for rice (Supplemen-
tary S17a,b), sorghum (Supplementary S20a,b), soybean (Supplementary S23a,b), sunflower (Supplementary
S26a,b); In south of China for sorghum (Supplementary S20a,b), soybean (Supplementary S23a,b), winter wheat
(Fig. 3a,b); In North-eastern America, and Europe for spring barley (Supplementary S9a,b), maize (Fig. 4a,b),
soybean (Supplementary S23a,b), and winter wheat (Fig. 3a,b).
Here we show that, comparing with CT, CA with proper management has a 25% chance of producing large
yield gains (more than 30%) in most of Africa for spring barley (Supplementary S10b), cotton (Supplementary
Scientific Reports | (2021) 11:3344 | https://doi.org/10.1038/s41598-021-82375-1 2
Vol:.(1234567890)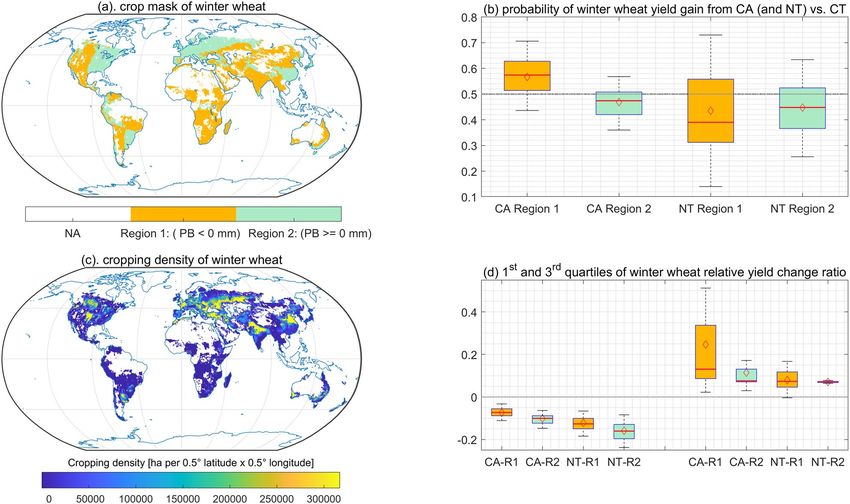
www.nature.com/scientificreports/

                                  Figure 1.  Impact of crop management practices on CA performance, shown in 1-dimension partial
                                  dependence plot of the probability of yield gain as a function of precipitation balance (mm). The tick marks
                                  on the x-axis show the distributions of observations of precipitation balance in the dataset. ± SC indicates
                                  NT with/without soil cover. ± R indicates NT with/without rotation. ± F indicates NT or CA and CT with/
                                  without fertilization. ± WD indicates NT or CA and CT with/without weed and pest control. Plot a compares
                                  the productive performance of CA, NT+SC, and NT-SC. Plot b compares the productive performance of
                                  CA, NT+R, and NT-R. Plot c compares the productive performance of CA+F, CA-F, NT+F, and NT-F. Plot
                                  d compares the productive performance of CA+WD, CA-WD, NT+WD, and NT-WD. Plot e compares
                                  CA+Irrigation, CA-Irrigation, NT+irrigation, and NT-Irrigation. Plot f compares the productive performance of
                                  CA and NT in maize and winter maize systems.

                                  S13b), maize (Supplementary S15b), sorghum (Supplementary S21b), soybean (Supplementary S24b), sunflower
                                  (Supplementary S27b), winter wheat (Fig. 5b); In some part of South America for spring barley (Supplementary
                                  S10b), cotton (Supplementary S13b), maize (Supplementary S15b), sorghum (Supplementary S21b), soybean
                                  (Supplementary S24b), sunflower (Supplementary S27b), winter wheat (Fig. 5b); In some part of South-eastern
                                  US for spring barley (Supplementary S10b), maize (Supplementary S15b), sorghum (Supplementary S21b), soy-
                                  bean (Supplementary S24b), sunflower (Supplementary S27b). Conversely, NT has a 75% chance of increasing
                                  yield by more than 5% for winter wheat in the northeast of China (Fig. 5c).
                                      However, even with proper agricultural management practices, there is a 75% chance that NT will lead to a
                                  yield decrease in some part of the tropical regions for cotton (Supplementary S13d), maize (Supplementary S15d),
                                  rice (Supplementary S18d), sorghum (Supplementary S21d), soybean (Supplementary S24d), and sunflower
                                  (Supplementary S27d); In some part of China for rice (Supplementary S18d), sorghum (Supplementary S21d),
                                  soybean (Supplementary S24d), and sunflower (Supplementary S27d); In eastern EU for maize (Supplementary
                                  S15d), sorghum (Supplementary S21d), and soybean (Supplementary S24d); And in North-eastern America for
                                  maize (Supplementary S15d).

                                  Discussion
                                  As the probabilities and plausible ranges of yield gain and loss with CA and NT systems have not been mapped in
                                  previous meta-analyses1,9,11, our results bring meaningful and novel information to policymakers and agricultural
                                  extension services. In this study, we were able to identify the regions that have higher or lower probability of yield
                                  gain from shifting CT to CA and NT for eight major field crops. The magnitude of these gains was assessed, as
                                  well as the potential yield losses.
                                      Although based on an expanded dataset, our study has several limitations. Most of the data collected pertains
                                  to humid climates rather than arid regions. Crop irrigation was considered only as a categorical variable here
                                  due to a lack of global data on this practice, but still proved meaningful in terms of yield impacts. Finally, to deal
                                  with missing climate and soil data in the selected papers, we used climate and soil data from external databases
                                  on a systematic basis. Consequently, crop growing season, precipitation, potential evapotranspiration, minimum
                                  temperature, average temperature, maximum temperature throughout the growing season, and soil texture may
                                  not always match local records. However, the use of external databases allowed us to analyse the effects of the
                                  inter-annual and intra-annual climate variabilities on CA and NT productivity.

Scientific Reports |   (2021) 11:3344 |                https://doi.org/10.1038/s41598-021-82375-1                                                     3

                                                                                                                                                 Vol.:(0123456789)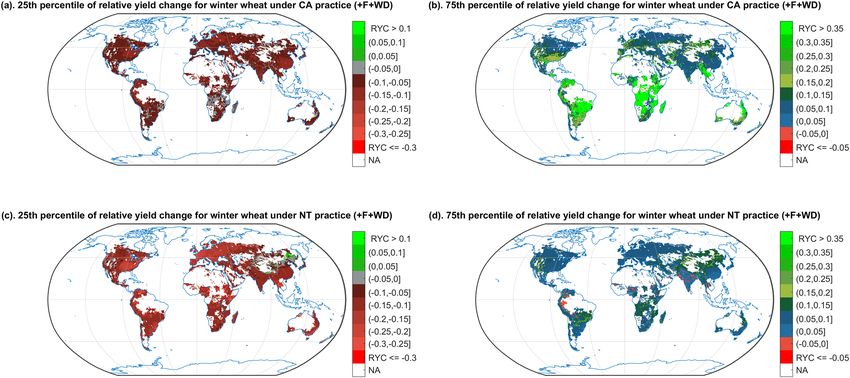
www.nature.com/scientificreports/
Figure 2. Productivity of CA and NT vs. CT (with fertilization and integrated weed and pest control) for winter
wheat in a relatively dry (region #1) and a relatively wet (region #2) region. Plot a illustrates region #1 and
region #2 on a global map with the two different colours showed in the sub-legend, the blank area indicates the
non-cropping region of winter wheat or the regions without available climate data. PB represents precipitation
balance over the crop growing season. Plot b shows the probability of winter wheat yield gain (CA and NT vs.
CT). Plot c shows the global map of wheat cropping d ensity27, the yellower shades indicate the higher density,
and vice versa. The yellow colour in this map indicates the crop density is equal or higher than 20% of maximum
density of crop in the cell of 0.5◦ latitude × 0.5◦ longitude at the global scale. Plot d shows the 1st and 3rd
quartiles of winter wheat relative yield change under CA and NT vs. CT in these two regions, and the x axis tick
label in this plot: R1, R2 indicate region #1 or dry region; region #2 or wet region. The left part of plot d indicates
the yield change ratios at the 1st quartile, while the right part represents the yield change ratios at 3rd quartile.
The colours in plot a,b,d indicate the same regions (i.e., R1 and R2). In plot b,d, the mean value of relative yield
change in its region is marked by the red diamond, while the median value is depicted by the red horizontal line.
Our study revealed large differences in the likelihood of yield gains associated with the adoption of CA (or
NT) across crops, crop management practices, geographical regions, and climatic conditions. Based on our
results, NT appeared more likely to increase yields in dry conditions compared to wet conditions, especially
when it combined with soil cover. The potential benefits of such practice are well known.
The layer of crop residues retained on the soil surface in no-till systems reduces soil evaporation and water
runoff30,31, fosters the build-up of organic matter in soils32, preserves soil water resources for crops33, increases
soil water retention capacity and mitigates drought effects34–36. These factors all contribute to increase the prob-
ability of yield gain. Conversely, in humid regions, the comparative advantages of CA or NT with soil cover
were no longer evident and can even be detrimental in the case of soils prone to waterlogging1. In some other
conditions, such as winter crop in cold region, we did notice that not covering the soil increased the chance of
yield gain compared to continuous soil cover. We showed that winter wheat in northeast of China, NT has better
performance than CA, this might be because the soil cover reduced the mean soil t emperature37, which delayed
the crop establishment and growth4,38,39. However, it is also reported that residue cover could decrease the rate of
soil temperature change37, increase the minimum soil temperature in extreme cold conditions40–42, and provide
a buffer layer that can increase the crop resistance to the increasing climate variability and the occurrence of
extreme events4. Therefore, soil cover reduces the risk of crop failure and increased yield stability. The fact that
soil cover management had the largest positive impact on the productivity of NT, compared to other management
practices including crop rotation and the control of weeds and pests, was also reported in previous s tudies1,43.
Despite the recognized positive effects of residue cover and crop rotation, these two practices were not always
implemented with NT s ystems44.
Our results also showed that, with integrated weed and pest management, CA systems tend to perform
slightly better than without (Fig. 1d), which might indirectly suggest that the crop residue cover used in CA may
increase the weed or pest pressure in dry conditions45,46. While in humid condition, CA might have a slightly
higher probability of yield gain in the absence of weed control. This may be due to a greater competition for water
Scientific Reports | (2021) 11:3344 | https://doi.org/10.1038/s41598-021-82375-1 4
Vol:.(1234567890)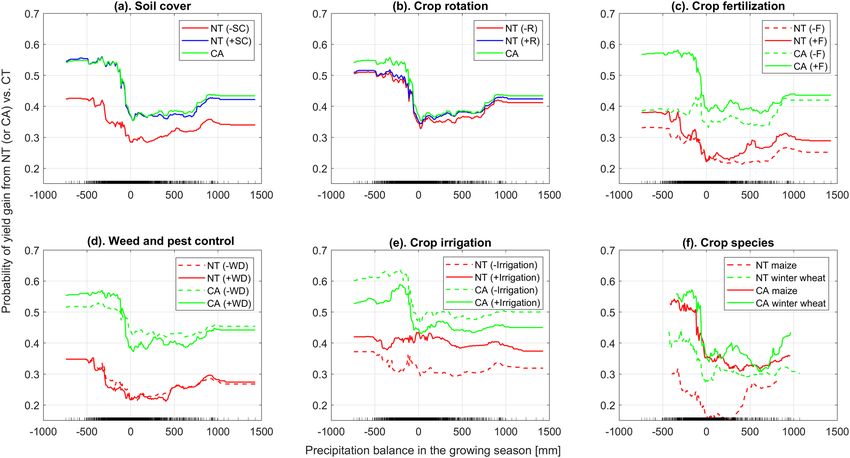
www.nature.com/scientificreports/
Figure 3. Probability of yield gain with CA and NT vs. CT winter wheat. Only the cropping regions are
presented. The different colours indicate different probabilities of yield gain from CA and NT comparing to
CT system. Greener shades indicate a higher probability of yield gain, while redder shades indicate a lower
probability of yield gain. NA indicates the non-cropping region of winter wheat and the regions without
available climate data. ± F indicates NT or CA and CT with/without fertilization. ± WD indicates NT or CA and
CT with/without weed and pest control.
Figure 4. Probability of yield gain with CA and NT vs. CT maize. Only the cropping regions are presented. The
different colours indicate different probabilities of yield gain from CA and NT comparing to CT system. Greener
shades indicate a higher probability of yield gain, while redder shades indicate a lower probability of yield gain.
NA indicates the non-cropping region of maize and the regions without available climate data. ± F indicates NT
or CA and CT with/without fertilization. ± WD indicates NT or CA and CT with/without weed and pest control.
resources between crops and weeds when weeds were not c ontrolled47,48, leading to dryer conditions and to an
increased probability of yield gain with CA. Our results showed again that CA and NT had a higher probability
of yield gain under fertilized c onditions1.
Scientific Reports | (2021) 11:3344 | https://doi.org/10.1038/s41598-021-82375-1 5
Vol.:(0123456789)www.nature.com/scientificreports/
Figure 5. Relative yield change probability (1st and 3rd quartile estimate) of shifting CT to CA/NT for winter
wheat, with fertilization and weed and pest control (+ F + WD). There is a 75% chance that the relative yield
change will be higher than the ratio shown on the map in plot (a,c), and conversely a 25% chance that the
relative change will be lower. There is a 75% chance that the relative yield change will be lower than the ratio
shown on the map in plot (b,d), and conversely a 25% chance that the relative change will be higher. The colours
indicate different levels of yield change ratio, and the red colour shades indicate negative yield changes or yield
losses. NA indicate the non-cropping region of winter wheat and the regions without available climate data.
Overall, we showed that CA has a better productivity than NT, especially when combined with the proper
agronomical practices of fertilization and integrated weed and pest management. Therefore, we recommend that
NT systems should be implemented with soil cover, crop rotation (thus following the definition of Conservation
Agriculture by the FAO), crop fertilization, integrated weed and pest management, and all the other good agro-
nomic practices like good seed, water management. Although CA may not always outperform CT concerning
on crop yield, CA can provide a range of ecosystem services far beyond biomass production, those ecosystem
services included improve the soil health, reduce the soil erosion risk, etc.49. The present traditional tillage sys-
tems are resulting in serious land degradation, which will increase the risk of food insecurity in the future, and
increase emissions and reduce carbon s inks50. Therefore, CA is a promising practice that can be promoted to
sustain long-term food production.
Received: 5 February 2020; Accepted: 11 January 2021
References
1. Pittelkow, C. M. et al. When does no-till yield more? A global meta-analysis. Field Crops Res. 183, 156–168 (2015).
2. Food and Agriculture Organization of the United Nations (FAO). Save and Grow: A Policymaker’s Guide to the Sustainable Inten-
sification of Smallholder Crop Production (2013). http://www.fao.org/3/a-i2215e.pdf.
3. Michler, J. D., Baylis, K., Arends-Kuenning, M. & Mazvimavi, K. Conservation agriculture and climate resilience. J. Environ.
Econom. Manage. 93, 148–169 (2019).
4. Page, K. L., Dang, Y. P. & Dalal, R. C. The ability of conservation agriculture to conserve soil organic carbon and the subsequent
impact on soil physical, chemical, and biological properties and yield. Front. Sustain. Food Syst. https://doi.org/10.3389/fsufs
.2020.00031(2020).
5. Farooq, M. & Siddique, K. H. M. Conservation Agriculture (Springer, Berlin, 2015).
6. Holland, J. M. The environmental consequences of adopting conservation tillage in Europe: Reviewing the evidence. Agric. Ecosyst.
Environ. 103, 1–25 (2004).
7. Govaerts, B. et al. Infiltration, soil moisture, root rot and nematode populations after 12 years of different tillage, residue and crop
rotation managements. Soil Tillage Res. 94, 209–219 (2007).
8. Zhang, W., Zheng, C., Song, Z., Deng, A. & He, Z. Farming systems in China: Innovations for sustainable crop production. In Crop
Physiology (eds Zhang, W. et al.) 43–64 (Elsevier, Amsterdam, 2015).
9. Pittelkow, C. M. et al. Productivity limits and potentials of the principles of conservation agriculture. Nature 517, 365–368 (2015).
10. Scopel, E. et al. Conservation agriculture cropping systems in temperate and tropical conditions, performances and impacts. A
review. Agron. Sustain. Dev. 33, 113–130 (2013).
11. Steward, P. R. et al. The adaptive capacity of maize-based conservation agriculture systems to climate stress in tropical and sub-
tropical environments: A meta-regression of yields. Agric. Ecosyst. Environ. 251, 194–202 (2018).
12. Knapp, S. & van der Heijden, M. G. A. A global meta-analysis of yield stability in organic and conservation agriculture. Nat. Com-
mun. 9, 1–9 (2018).
13. Laborde, J. P., Wortmann, C. S., Blanco-Canqui, H., Baigorria, G. A. & Lindquist, J. L. Identifying the drivers and predicting the
outcome of conservation agriculture globally. Agric. Syst. 177, 102692. https://doi.org/10.1016/j.agsy.2019.102692 (2020).
Scientific Reports | (2021) 11:3344 | https://doi.org/10.1038/s41598-021-82375-1 6
Vol:.(1234567890)www.nature.com/scientificreports/
14. Su, Y., Gabrielle, B. & Makowski, D. A global dataset for crop production under conventional tillage and no tillage practice. Figshare.
https://doi.org/10.6084/m9.figshare.12155553 (2020).
15. Su, Y., Gabrielle, B. & Makowski, D. A global dataset for crop production under conventional tillage and no tillage systems. Sci.
Data 8, 33. https://doi.org/10.1038/s41597-021-00817-x (2021).
16. Food and Agriculture Organization of the United Nations (FAO). Conservation Agriculture (2020). http://www.fao.org/conser vati
on-agriculture/en/.
17. Ho, T. K. Random decision forests. In Proc. 3rd International Conference on Document Analysis and Recognition, 278–282 (1995).
18. Meinshausen, N. Quantile regression forests. J. Mach. Learn. Res. 7, 983–999 (2006).
19. University of Wisconsin-Madison. Crop Calendar Dataset: netCDF 5 Degree (2020). https://nelson.wisc.edu/sage/data-and-model
s/crop-calendar-dataset/netCDF0-5degree.php.
20. Sacks, W. J., Deryng, D., Foley, J. A. & Ramankutty, N. Crop planting dates: an analysis of global patterns. Glob. Ecol. Biogeogr. 19,
607–620 (2010).
21. University of Tokyo. Soil Texture Map (2020). http://hydro.iis.u-tokyo.ac.jp/~sujan/research/gswp3/soil-texture-map.html.
22. NOAA/OAR/ESRL PSL. University of Delaware Air Temperature & Precipitation (2020). https: //www.esrl.noaa.gov/psd/data/gridd
ed/data.UDel_AirT_Precip.html.
23. Martens, B. et al. GLEAM v3: Satellite-based land evaporation and root-zone soil moisture. Geosci. Model Dev. 10, 1903–1925
(2017).
24. Miralles, D. G. et al. Global land-surface evaporation estimated from satellite-based observations. Hydrol. Earth Syst. Sci. 15,
453–469 (2011).
25. NOAA/OAR/ESRL PSL. CPC Global Daily Temperature (2020). https://www.esrl.noaa.gov/psd/data/gridded/data.cpc.globaltemp
.html.
26. Mandelkern, M. et al. Setting confidence intervals for bounded parameters. Stat. Sci. 17, 149–172 (2002).
27. Portmann, F. T., Siebert, S. & Döll, P. MIRCA2000-Global monthly irrigated and rainfed crop areas around the year 2000: A new
high-resolution data set for agricultural and hydrological modeling. Glob. Biogeochem. Cycles. https: //doi.org/10.1029/2008GB 0034
35 (2010).
28. Friedman, J. H. Greedy function approximation: A gradient boosting machine. Ann. Stat. 29, 1189–1232 (2001).
29. Hastie, T., Tibshirani, R. & Friedman, J. The Elements of Statistical Learning (Springer, New York, 2009).
30. Zuazo, V. H. D. & Pleguezuelo, C. R. R. Soil-erosion and runoff prevention by plant covers. A review. Agron. Sustain. Dev. 28, 65–86
(2008).
31. Shaxson, F. & Barber, R. Optimizing Soil Moisture for Plant Production, the Significance of Soil Porosity (FAO, 2003).
32. Swanepoel, C. M. et al. The benefits of conservation agriculture on soil organic carbon and yield in southern Africa are site-specific.
Soil Tillage Res. 183, 72–82 (2018).
33. Derpsch, R. Controle da Erosão no Paraná, Brasil: Sistemas de Cobertura do Solo, Plantio Direto e Preparo Conservacionista do Solo
(GTZ/Curitiba, 1991).
34. Scopel, E., da Silva, F. A. M., Corbeels, M., Affholder, F. & Maraux, F. Modelling crop residue mulching effects on water use and
production of maize under semi-arid and humid tropical conditions. Agronomie 24, 383–395 (2004).
35. Thierfelder, C. & Wall, P. C. Investigating conservation agriculture (CA) systems in Zambia and Zimbabwe to mitigate future
effects of climate change. J. Crop Improve. 24, 113–121 (2010).
36. Lal, R. The role of residues management in sustainable agricultural systems. J. Sustain. Agric. 5, 51–78 (1995).
37. Shen, Y., McLaughlin, N., Zhang, X., Xu, M. & Liang, A. Effect of tillage and crop residue on soil temperature following planting
for a Black soil in Northeast China. Sci. Rep. 8, 4500 (2018).
38. Muñoz-Romero, V., Lopez-Bellido, L. & Lopez-Bellido, R. J. Effect of tillage system on soil temperature in a rainfed Mediterranean
Vertisol. Int. Agrophys. 29, 467–473 (2015).
39. Hatfield, J. L. & Prueger, J. H. Temperature extremes: Effect on plant growth and development. Weather Clim. Extr. 10, 4–10 (2015).
40. Ramakrishna, A., Tam, H. M., Wani, S. P. & Long, T. D. Effect of mulch on soil temperature, moisture, weed infestation and yield
of groundnut in northern Vietnam. Field Crops Res. 95, 115–125 (2006).
41. Kumar, S. & Dey, P. Effects of different mulches and irrigation methods on root growth, nutrient uptake, water-use efficiency and
yield of strawberry. Sci. Hortic. 127, 318–324 (2011).
42. van Wijk, W. R., Larson, W. E. & Burrows, W. C. Soil Temperature and the early growth of corn from mulched and unmulched
soil. Soil Sci. Soc. Am. J. 23, 428 (1959).
43. Kodzwa, J. J., Gotosa, J. & Nyamangara, J. Mulching is the most important of the three conservation agriculture principles in
increasing crop yield in the short term, under sub humid tropical conditions in Zimbabwe. Soil Tillage Res. 197, 104515 (2020).
44. Giller, K. E., Witter, E., Corbeels, M. & Tittonell, P. Conservation agriculture and smallholder farming in Africa: The heretics’ view.
Field Crops Res. 114, 23–34 (2009).
45. Andersson, J. A. & D’Souza, S. From adoption claims to understanding farmers and contexts: A literature review of conservation
agriculture (CA) adoption among smallholder farmers in southern Africa. Agric. Ecosyst. Environ. 187, 116–132 (2014).
46. Mashingaidze, N., Madakadze, C., Twomlow, S., Nyamangara, J. & Hove, L. Crop yield and weed growth under conservation
agriculture in semi-arid Zimbabwe. Soil Tillage Res. 124, 102–110 (2012).
47. Watt, M. S., Whitehead, D., Mason, E. G., Richardson, B. & Kimberley, M. O. The influence of weed competition for light and water
on growth and dry matter partitioning of young Pinus radiata, at a dryland site. For. Ecol. Manage. 183, 363–376 (2003).
48. Abouziena, H., El-Saeid, M., Ahmed, A. & Amin, E.-S. Water loss by weeds: A review. Int. J. ChemTech Res. 7, 974–4290 (2014).
49. Food and Agriculture Organization of the United Nations (FAO). The Economics of Conservation Agriculture (2001).
50. Olsson, L. et al. Land Degradation. In Climate Change and Land: an IPCC Special Report on Climate Change, Desertification, Land
Degradation, Sustainable Land Management, Food Security, and Greenhouse Gas Fluxes in Terrestrial Ecosystems (IPCC, 2019).
Acknowledgements
This work was supported by the ANR under the “Investissements d’avenir” program with the reference ANR-
16-CONV-0003 (CLAND). All maps in the paper were generated by MATLAB R2020a (Version 9.8.0.1451342,
https://fr.mathworks.com/products/matlab.html).
Author contributions
Y.S. wrote the main manuscript text and B.G., D.M. and D.B. modified it; Y.S., B.G. and D.M. worked together to
prepared the figures and tables; Y.S. collected the data; Y.S., B.G., D.B. and D.M. designed and built the models to
process the data; Y.S., D.B. and D.M. worked on the model cross validation. All authors reviewed the manuscripts.
Competing interests
The authors declare no competing interests.
Scientific Reports | (2021) 11:3344 | https://doi.org/10.1038/s41598-021-82375-1 7
Vol.:(0123456789)www.nature.com/scientificreports/
Additional information
Supplementary Information The online version contains supplementary material available at https://doi.
org/10.1038/s41598-021-82375-1.
Correspondence and requests for materials should be addressed to Y.S.
Reprints and permissions information is available at www.nature.com/reprints.
Publisher’s note Springer Nature remains neutral with regard to jurisdictional claims in published maps and
institutional affiliations.
Open Access This article is licensed under a Creative Commons Attribution 4.0 International
License, which permits use, sharing, adaptation, distribution and reproduction in any medium or
format, as long as you give appropriate credit to the original author(s) and the source, provide a link to the
Creative Commons licence, and indicate if changes were made. The images or other third party material in this
article are included in the article’s Creative Commons licence, unless indicated otherwise in a credit line to the
material. If material is not included in the article’s Creative Commons licence and your intended use is not
permitted by statutory regulation or exceeds the permitted use, you will need to obtain permission directly from
the copyright holder. To view a copy of this licence, visit http://creativecommons.org/licenses/by/4.0/.
© The Author(s) 2021
Scientific Reports | (2021) 11:3344 | https://doi.org/10.1038/s41598-021-82375-1 8
Vol:.(1234567890)You can also read