Numerical simulation with experimental validation of the structural reaction injection moulding of 3D continuous fibre reinforced polyurethane foam
←
→
Page content transcription
If your browser does not render page correctly, please read the page content below
Engineering Research Express

PAPER • OPEN ACCESS

Numerical simulation with experimental validation of the structural
reaction injection moulding of 3D continuous fibre reinforced
polyurethane foam
To cite this article: Kay Schäfer et al 2021 Eng. Res. Express 3 025027

View the article online for updates and enhancements.

                               This content was downloaded from IP address 46.4.80.155 on 22/09/2021 at 13:12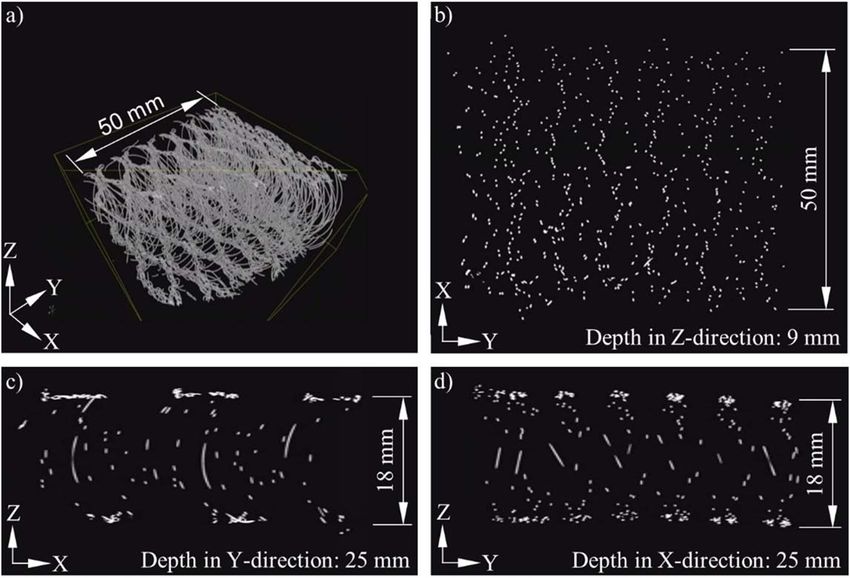
Eng. Res. Express 3 (2021) 025027                                                         https://doi.org/10.1088/2631-8695/abfd49

                             PAPER

                             Numerical simulation with experimental validation of the structural
                             reaction injection moulding of 3D continuous fibre reinforced
OPEN ACCESS

RECEIVED
21 December 2020             polyurethane foam
REVISED
27 April 2021
                             Kay Schäfer1,∗ , Daisy Nestler1 , Kristina Jahn1, Dariusz Niedziela2, Ikenna Ireka2, Konrad Steiner2 and
ACCEPTED FOR PUBLICATION
30 April 2021
                             Lothar Kroll3
                             1
                                 Endowed Chair Textile Plastic Composites and Hybrid Compounds, Faculty of Mechanical Engineering, Technical University of
PUBLISHED
19 May 2021                      Chemnitz, D-09126 Chemnitz, Germany
                             2
                                 Fraunhofer Institute for Industrial Mathematics, D-67663 Kaiserslautern, Germany
                             3
                                 Department of Lightweight Structures and Polymer Technology, Faculty of Mechanical Engineering, Technical University of Chemnitz,
Original content from this
                                 D-09126 Chemnitz, Germany
work may be used under       ∗
the terms of the Creative        Author to whom any correspondence should be addressed.
Commons Attribution 4.0
                             E-mail: Kay.Schaefer@mb.tu-chemnitz.de
licence.
Any further distribution of Keywords: structural reaction injection moulding, polyurethane foam, spacer fabric, numerical simulation, porous media flow, navier-
this work must maintain     stokes-brinkmann equation, permeability tensor
attribution to the
author(s) and the title of
the work, journal citation
and DOI.
                             Abstract
                             Sandwich composite materials are established in the industry. Polyurethane foam reinforced with
                             spacer fabric represents an innovative solution for a core in this field. It is manufactured in the
                             Structural Reaction Injection Moulding (SRIM). This paper describes new investigations that provide
                             the base for component and process design when using this Interpenetrating Phase Composite (IPC).
                             Filling studies were carried out for this purpose in three moulding tools with different cavities with
                             and without spacer fabric. It is shown that the PUR foam expansion and the foam bulk density are
                             clearly influenced by the sprue type, cavity design and spacer fabric. Simulations are necessary to
                             investigate all process-structure-property relationships in detail and to enable a user-friendly and
                             efficient design of material and process. Adequate mathematical models to simulate the transport of
                             mass, heat and momentum in the SRIM are presented in this paper. The resistance to the expansion
                             process caused by the porous structures in the domain were taken into account. The transport of
                             momentum in the mould is described with the Navier–Stokes-Brinkman equations which in the limit
                             of the permeability tensor reduces to the Navier–Stokes equation. The model equations are solved
                             numerically and the results show reasonable agreement with the experimental data.

                             1. Introduction and state of the art

                             Sandwich design is well established in the aviation, automotive, railway and shipping industries [1]. Low
                             component masses in combination with excellent mechanical properties can be achieved by the use of it.
                             Limitations are related to the strength of the component transition area between the facings and the core as well
                             as to the mechanical properties of the core itself [2]. Polyurethane (PUR) foam is the most common core
                             material [3]. Reinforcing fibres are used to increase its mechanical properties especially under pressure and shear
                             loads. These transmit the forces through the structure according to their orientation [4]. The bulk density should
                             not be significantly increased by the use of fibres.
                                  The efficient and reproducible production of PUR foam as a moulding is carried out by Reaction Injection
                             Moulding (RIM). The two chemicals di/polyisocyanate and a polyol formulation are processed to a reaction
                             mixture by a mixing and dispensing machine which feeds it into a closed mould [5, 6]. The process is established
                             in the industry since the 1970s for the production of body panels and fascia [7]. It also has been extensively
                             investigated. Kabakci et al showed for example that the structure and properties of moulded PUR foams are

                             © 2021 The Author(s). Published by IOP Publishing Ltd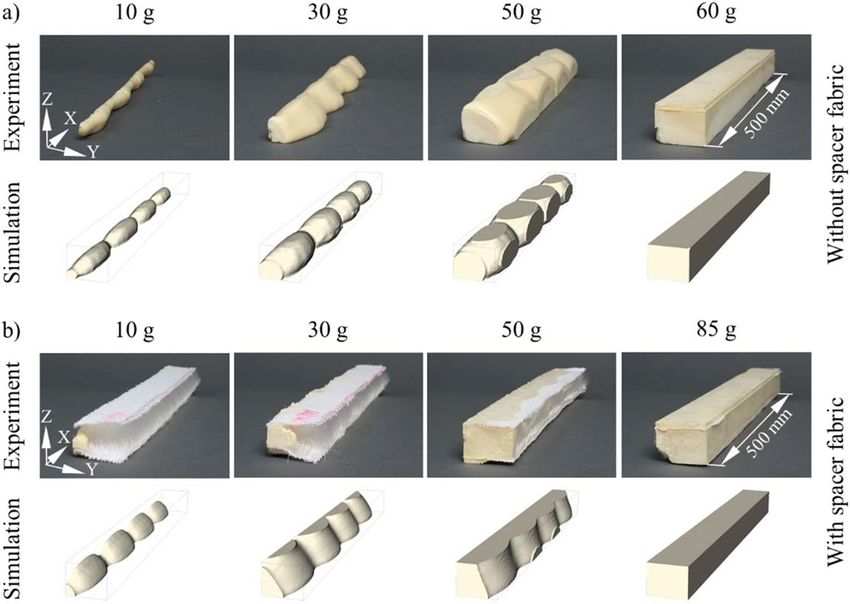
Eng. Res. Express 3 (2021) 025027                                                                       K Schäfer et al

strongly depending on the following process parameters: mould temperature, amount of charge, working
pressure, polyol temperature, flow rate and curing time [8].
     Particles, short or long fibres are carried along in the PUR reaction mixture in Reinforced Reaction Injection
Moulding (RRIM) for reinforcing moulded parts [9]. Kamal et al investigated short glass fibres in this process
[10]. It was shown that a large reaction mass and a low nucleation level reduce the average pore size and increase
the pore homogeneity and mechanical properties. Chen et al processed long glass fibres and investigated the
bending properties of the manufactured mouldings [11]. High fibre volume contents and lengths did not lead to
good results because of non-uniform distribution. An optimum was determined at 15% and 25 mm. It also
could be shown that the processing temperature of the chemicals and the demould time had a great influence on
the results. Cao et al investigated long fibres of glass, jute and carbon in the RRIM and tested the impact
properties of the mouldings [12]. This paper confirms that the uniform distribution of the fibres is essential for
high mechanical properties. A fibre volume content of 10% and a fibre length of 12.5 mm were determined as an
optimum in this study.
     Reinforcing materials are positioned in the cavity of the mould during Structural Reaction Injection
Moulding (SRIM) to impregnate them with the reaction mixture [13]. The continuous fibre reinforcement
through complete PUR components can only be realised with the SRIM. Wirth described the parametrisation of
this process while processing glass fibre mats in two different moulds with pressure sensors. The objectives were
acceptable cavity pressure, no core shifting and crushing, no reinforcement compaction and complete
impregnation [14]. Makey et al investigated glass fibre mats with different grammages in the SRIM and also
varied the foam bulk density. The flexural modulus of the mouldings and the impact energy determined in the
falling dart test increased with increasing values [15]. Li et al manufactured PUR foam reinforced with flax knits
in the SRIM and demonstrated the reinforcement effect in a tensile test [16].
     Spacer fabrics are suitable for the 3D continuous fibre reinforcement of PUR foam in the SRIM. They consist
of two fabric surfaces which are kept at a defined distance by spacer threads [17]. Schäfer et al described their
processing in the SRIM and demonstrated the reinforcement effect using two different variants in a rigid and a
flexible foam under pressure and bending load [18, 19]. Chen et al reinforced a flexible PUR foam with six
scientifically comparable spacer fabrics [20, 21]. The highest compression stresses were achieved with a closed
surface structure, coarse spacer threads and a large spacer thread inclination angle. Pan et al reinforced the
surfaces of a warp-knitted spacer fabric with two nonwovens each made of a mixture of PET and Kevlar fibres
and an additional carbon or glass textile between them [22, 23]. The semi-finished product was completely
impregnated with a PUR foam in the SRIM. The textile 3D-reinforcement of PUR foams differs in the process
control from all common types of RIM. New investigations are necessary to design appropriate components and
plan the processes. The work required for this is very labour-intensive. This makes it impossible to investigate all
relationships comprehensively. The development of simulations based on the experimental data is necessary
therefore. These allows a user-friendly and efficient design of material and process in addition.
     The simulation of expanding PUR foam systems is an area of active research. Trends have shown a
systematic development ranging from tracking the temporal evolution of the PUR foam density and
temperature [24, 25] to simulating the spatio-temporal evolution of associated flow properties such as
temperature, propagation of foam front, viscosity as well as the reacting species [26–37]. Lefebvre et al developed
a two-dimensional numerical framework to predict the evolution of the macroscopic velocity, temperature,
stresses and species concentration fields in the flow of a reacting polymer system [26]. Seo et al similarly
predicted the flow field, the distribution of foam density, the thermal conductivity and the progression of the
foam front in mould filling processes of PUR foam numerically using a theoretical 3D model which accounts for
the chemical reactions in the system and assumes empirical relationships for density and viscosity [27]. A model
by Mitani et al accounts for the initial shape and rate of foam expansion without emphasis on chemical reactions
or temperature changes. The flow pattern of expanding PUR foam in a mould was predicted in this way [28].
However, the morphology of expanding PUR foams is strongly influenced by the interplay between chemical
reactions, temperature generation and evolution of the foam rheology [29]. Geier et al expanded the ideas in
[24, 26, 27] for a systemic analysis of the early stage of product development and presented a workflow for
simulating the foaming process in the manufacturing of a refrigerator [30, 31]. Rao et al adopted in addition an
empirical time and temperature dependent density model to simulate the expansion process of foams in a
physically blown reactive PUR foam setup [32]. The reulting models reasonably predicted the foam propagation,
viscosity and temperature distribution in a closed complex geometry. An improvement of the model framework
is presented in a followup study [33]. It was shown that the applied homogenised continuum models can
adequately predict the density distribution and the filling profiles of the PUR foam in a closed mould.
     The authors of this paper derived equations in previous studies which govern the complex dynamics of
expanding PUR foam influenced by the reaction temperature, the degree of conversion and the chemoviscosity
[38]. The Kamal model is used to describe the chemical reactions during the PUR foam processing [39]. The
equations were solved numerically for the spatio-temporal analysis of the flow properties. The results showed

                                               2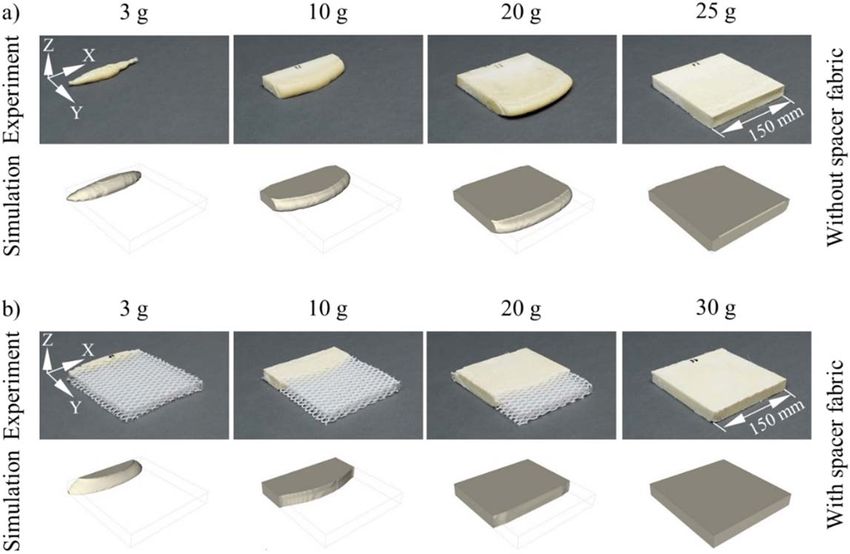
Eng. Res. Express 3 (2021) 025027                                                                      K Schäfer et al

   Figure 1. Spacer fabrics used as inserts in the moulding tools (a) SF 1 and (b) SF 2.

good agreement with filling study experiments where volume expansion and reaction temperature (up to
160 °C) were measured. A mathematical model accounting for the non-uniformity in the expansion process of
PUR foams was derived in further work [40]. This was solved and also validated by experiments. The rheology of
expanding PUR foam also has been studied in detail by the authors of this paper to improve the own
mathematical structure for modelling [41].
    There are also reports in the literature about attempts to couple micro- and macro-scale activities in the
simulation of expanding PUR foam. Geier et al presented a multiscale modelling appoach, which combined
atomistic molecular dynamics simulations with CFD (Computational Fluid Dynamics) models using a
surrogate equation [31]. The associated model equations were used to predict the expansion process of
physically blown PUR foam sytems. The results showed reasonable agreement with experiments.
    The mathematical modelling and simulation of the expansion of PUR foam through porous networks has
not yet been extensively explored. This paper presents an approach to the topic. The evolution of the rheology
and associated flow parameters of PUR foam introduces additional difficulty in modelling their expansion
through porous media. The presence of such fibrous structure induces some resistance to the expansion process
as well as heat transport within the mould [18, 19]. Intricate properties such as the permeability of the porous
fibre material, degree of polymerisation, heat generation, evolving rheology of the fluid, gas creation and foam
growth should be accounted for in developing 3D mathematical framework for SRIM process of PUR foams.
Kim and Macosko described the thermal transport and pressure rise in the mould for a SRIM system with PUR
using the Darcy law and Kozeny’s equation in this regard [13]. The presence of porous structures in SRIM
process prompts the use of the Navier–Stokes-Brinkman equations in regions occupied by the fibre and the
Navier–Stokes equation in the fibre free parts. Corresponding studies were carried out and described in this
paper. The system of coupled non-linear partial differential equations governing the foam expansion process in
the mould containing the fibre networks are solved using finite volume techniques and the results are validated
with experimental data.

2. Experimental work

2.1. Materials
A reactive two component foam system from Covestro AG (Leverkusen, Germany) was used for the filling
studies. This produces a rigid PUR foam with a free foam bulk density of approx. 40 kg m−3 and primarily closed
cells. The polyol formulation BAYDUR 43-101 contains polyether polyol (OH number 330 mg KOH g−1) and
all necessary additives for the polyaddition reaction and CO2 formation. The polyisocyanate Desmodur 44V20
LF (NCO content 30.5%/wt.–32.5%/wt.) is aromatic. The two components are processed in a mass ratio of 67
polyol formulation to 100 polyisocyanate. The relationship between the volume of the PUR reaction mass and
the resulting PUR foam is 1 to 30 in the case of free expansion. The system has a starting time of 50 s and a tack-
free time of 15 min, which determines the demoulding time.
     Two warp-knitted spacer fabrics were used for the investigations to reinforce moulding areas with a
thickness of approx. 20 mm and 40 mm. These were produced by the Spiga GmbH (Flöha, Germany) on a high
distance raschel machine with a needle gauge of E12 from the Karl Mayer Textilmaschinenfabrik GmbH
(Obertshausen, Germany). They are both made of polyester. The spacer yarns are monofilaments and have an
IXI course. The surfaces were made of multifilaments as fillets. Fringe and tricot were used for spacer fabric 1 (SF
1) and tricot exclusively for spacer fabric 2 (SF 2). Both variants mainly differ in the thickness and the thread
density (figure 1). SF 2 has a 3.7 times higher stitch and spacer thread density compared to SF 1 (table 1).

                                                           3
Eng. Res. Express 3 (2021) 025027                                                                                       K Schäfer et al

   Figure 2. Computer-aided designed (CAD) models (a) of the moulding tool 1 for the manufacturing of (b) 3D continuous fibre
   reinforced polyurethane foam plates.

   Figure 3. Computer-aided designed (CAD) models (a) of the moulding tool 2 for the manufacturing of (b) 3D continuous fibre
   reinforced polyurethane foam beams.

                                    Tabele 1. Structural characteristics of the spacer fabrics.

                                    Designation                                           SF 1    SF 2

                                    Thickness [mm]                                        18      40
                                    Bulk density [kg m−3]                                 32      62
                                    Surface porosity [%]                                  65      8
                                    Stitch density [in−2]                                 70      260
                                    Spacer thread density [in−2]                          140     520
                                    Fibre volume content [%]                              2.6     4.4
                                    Diameter of monofilament [mm]                          0.25    0.20
                                    Fineness of multifilament [dtex]                       668     668
                                    Diameter of compacted multifilament [mm]               0.25    0.25
                                    Underlap [Number of needles]                          3       15

2.2. Manufacturing process
The filling studies were carried out in three moulding tools with completely different cavities. They all consisted
of the aluminium alloy AlMg4.5Mn. With the first one a plate can be manufactured with a surface of 150
mm × 150 mm and a thickness of 20 mm (figure 2). This corresponds to a volume of 450 cm3. The PUR reaction
mass is distributed from the injection point through a 0.6 mm thick fan sprue. It is finally injected into the cavity
at a height of 5 mm over a complete side.
     The moulding tool 2 has a beam as cavity with a length of 500 mm, a width of 50 mm and a height of 40 mm.
This corresponds to a volume of 1,000 cm3 (figure 3). It has a 4-part, 0.6 mm thick duct sprue, which introduces
the PUR reaction mass into the cavity over the full length at a height of 15 mm.
     The third one is used to manufacture a complex formed wave (figure 4). This has a length of 490 mm and a
width of 100 mm. The thickness widens from 1.6 mm to 24.0 mm and tapers again to 1.6 mm. The volume
amounts to 540 cm3. The PUR reaction mass is injected over a length of 180 mm by a fan sprue in the widened
area of the moulding. This also has a thickness of 0.6 mm.
     The moulding tools were heated externally with plates from the Heidolph Instruments GmbH & CO. KG
(Schwabach, Germany) at a temperature setting of 55 °C. This results in a temperature of approx. 42 °C in the

                                                         4
Eng. Res. Express 3 (2021) 025027 K Schäfer et al
Figure 4 . Computer-aided designed (CAD) models (a) of the moulding tool 3 for the manufacturing of (b) 3D continuous fibre
reinforced polyurethane foam waves.
sprues and at the cavity walls. The release agent MP-4066 from the Münch Chemie International GmbH
(Weinheim, Germany) was used to demould the PUR foams. A two-component mixing and dispensing low-
pressure system from Unipre GmbH (Werl, Germany) was used to mix the chemicals. The feed into the
moulding tools was carried out with an output rate of 600 g min−1.
The filling studies in mould 1 were carried out with SF 1 in the dimensions of the cavity. SF 2 was used for the
beam. The dimensions also corresponded to the cavity. The wave was reinforced with SF 1 in the largest possible
area, which fitted into the cavity without compression. This was 100 mm × 150 mm. The spacer fabrics were cut
to size using the USM-G electric circular knife from the Hoogs Cutting Systems GmbH & Co. KG (Bonn,
Germany). The longer side of the cuttings (X-direction see figures 1–4) corresponded to the working direction
during the production of the spacer fabrics. They were inserted shortly before the mould was closed and the PUR
reaction mass was injected. The spacer fabrics therefore had room temperature of about 23 °C when they were
subjected to the flow. No fixing was necessary to prevent displacement. The PUR reaction mass was fed in
without pressure and the foam expansion continued successively through the chemical reactions and the
resulting blowing agent CO2.
2.3. Characterisation
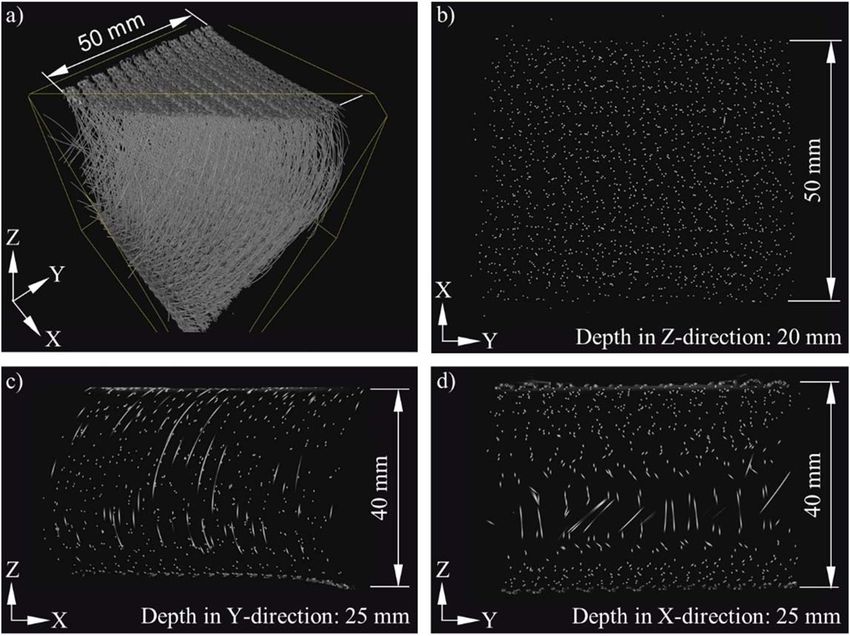
The two spacer fabrics SF 1 and SF 2 are geometrically characterised using micro-tomographic imaging. The 3D
images were scanned at the special μCT at Fraunhofer ITWM (Kaiserslautern, Germany) with an x-ray emission
tube (Feinfocus FXE 22), a maximum acceleration voltage of 225 kV and a maximum power of about 20 W. A
PerkinElmer detector with 2048×2048 pixels for high energy images (usable from 100 kV to 225 kV)
acceleration voltage and a Thales detector with 3072×3072 pixels for low energies (usable from 40 kV to
160 kV) were also employed. The resolution for both spacer fabrics was chosen to 27 μm to resolve accurately
the monofilament and to be able to scan a sample with a size of 50×50 mm.
The segmented 3D images could be directly used to calculate the full anisotropic permeability tensor K of the
spacer material by simulating the fluid flow through the spacer fabric geometry based on the Stokes equation.
The digital material laboratory software tool GeoDict® of the Math 2 Market GmbH (Kaiserslautern, Germany)
was used to import the μCT-data, to cut out a representative periodic area of the spacer fabric and to calculate
the flow through the spacer fabric in all three coordinate directions voxel grid. The permeability tensor was
automatically calculated in GeoDict® by averaging the flow filed data.
The sprue of the foam mouldings was removed for the determination of the mould filling levels and the foam
bulk densities in relation to the mass of the feed. The volume of the samples of the filling studies was set in
relation to the volume of the cavity to determine the mould filling level. The volume of the mouldings was
determined by discrete measurement. They were divided into 10 mm wide segments in X-direction (see
figures 2–4) to measure the expansion in Y-direction. The segments of the samples of the beam filling studies
were again divided into four parts in Z-direction at a distance of 10 mm, because of the strongly varying
expansion in the height. The measured expansion was multiplied by the segment width and height to determine
the segment volumes of the samples of the plate and the beam. The volumes of the complete segments of the
complex formed wave were determined in the computer-aided design (CAD) model. The filled volume of this
segments is calculated subsequently by dividing the measured foam expansion by the cavity width multiplied by
the complete volume of the segment. The total volume of a sample is calculated by adding the segment volumes.
The bulk density of the foam of a sample is given by the ratio of its mass to its volume. The mouldings and spacer
5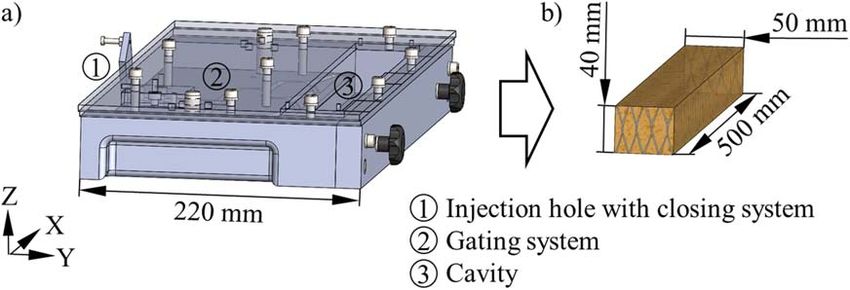
Eng. Res. Express 3 (2021) 025027 K Schäfer et al
fabrics were weighed before impregnation to calculate this. The foam mass of the reinforced foams is obtained by
subtracting the mass of the spacer fabric from the total mass of the sample. The mass of the sprues was also
determined. The true mass of the feed from the machine into the moulding tools and therefore the deviation
from the setting can be determined by this together with the foam mass of the mouldings.
3. Mathematical modeling
The geometries described in section 2.2 were investigated numerically in this study. The specified spacer fabrics
were considered by the prescribed permeability K. Simulations were carried out with and without these textiles
in the cavity and with the same PUR reaction masses from the experiments. The foaming mixture is assumed to
be a pseudohomogeneous incompressible chemorheological fluid and the expansion process is considered to be
driving by an adequately modified expansion source term S (T, jg )depending on temperature (T ) and gas
fraction (jg ) which allows for non-uniform expansion of the reacting PUR in the mould. These assumptions
correspond to the previous work of the authors, which is described in section 1. The flow in the porous region
within the domain is assumed to satisfy Darcy law. The Navier–Stokes-Brinkman equations therefore governing
the mass conservation and momentum transport as follows.
· v = S (T, jg ) (1)
¶rv -1
+ · (rvv ) = -p + · s - mm Kˆ v + rg (2)
¶t
The flow velocity is v , the density is ρ, the bulk gravitational force is g, pressure is p and the chemoviscosity
model for the reacting PU foam mixture is mm adopted directly from the previous work of the authors (see
-1
section 1). s = mm g is a stress tensor with g = 0.5 (v + v T ). The second order permeability tensor Kˆ is
defined in piecewise form by equation (3).
-1 K-1, for flow in the porous region
Kˆ = ⎧ (3)
⎨
⎩ 0, for flow in the non porous region
The energy balance in the presence of the porous structure with void fraction f within the mould is
described according to Kim and Macosko with equation (4).
¶T dT da ⎞
frC p ⎛ + v · T ⎞ = · (keff T ) - (1 - f) rs C ps + f ⎛mm g : g + rHR (4)
⎝ ¶t ⎠ dt ⎝ dt ⎠
The density rs and specific heat capacity C ps of the solid fibre constitute the pore network. The thermal
conductivity, density and specific heat capacity of the foam-gas mixture are respectively k, r and Cp. The heat
of reaction for the exothermic system is HR, which is described in detail in the previous work of the authors (see
section 1). The effective thermal conductivity (keff ) follows Kim and Macosko according to equation (5), where
k f and ks are respectively the thermal conductivities of the expanding foam and the solid fibers.
1 f 1-f
= + (5)
keff k ks
The degree of conversion follows the Kamal law described with equation (6).
da ¶a
º + v · a = (k1 + k2 am)(1 - a)n (6)
dt ¶t
The reaction parameters k1, k2, m and n describing the kinetics and the order of the reactions. The models
and equations governing the liquid and gas volume fractions jl and jg as well as the mixture density and other
relevant state parameters were directly adopted from the previous work of the authors (see section 1). The
resulting governing equations are solved with respect to the physical conditions of the experiments.
4. Results and discussion
4.1. Computer tomographic reconstructions
The computer tomographic reconstructions of the two spacer fabrics exactly reproduce their real textile
structures and illustrate their differences (figures 5 and 6). SF 1 has very open surfaces with oval omissions. The
surfaces of SF 2 are largely closed in contrast, which is only interrupted by narrow, parallel omissions. These
gaps can also be identified in the spacing area in the X-Y plane, because the spacer threads are integrated in the
6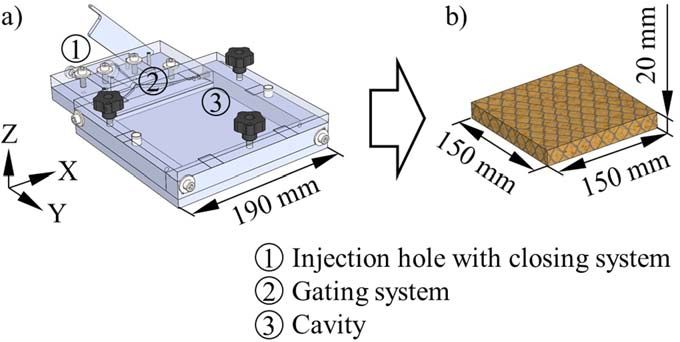
Eng. Res. Express 3 (2021) 025027                                                                        K Schäfer et al

   Figure 5. Computer tomographic images of spacer fabrics 1 (SF 1).

   Figure 6. Computer tomographic images of spacer fabrics 2 (SF 2).

surfaces. The slices in this plane also visualise for both spacer fabrics the low fibre volume content at high thread
density in the spacer area. The larger monofilament diameter of SF 1 compared to SF 2 is also noticeable. The
spacer threads are arranged one after the other in the X-Z plane. Their curvature between the surfaces is

                                                       7
Eng. Res. Express 3 (2021) 025027 K Schäfer et al
Figure 7. Comparison between real and simulated filling studies for the manufacturing of (a) unreinforced and (b) 3D continuous
fibre reinforced polyurethane foam in the moulding tool 1 for plates.
therefore visible in this slice. The crossing of the spacer threads in the IXI course can be detected in the Y-Z plane.
No continuous spacer threads can be detected through the curvature in this slice however. Both spacer fabrics
have similar spacer thread courses. A considerably lower thread density is visible for SF 1 compared to SF 2. The
permeability tensors of SF 1 (KSF 1) and SF 2 (KSF 2) given in the equations (7) and (8) were derived from the
computer tomographic reconstructions. SF 1 has a 2.4 times higher permeability compared to SF 2 accordingly.
⎡ 4.07 0 0 ⎤
K SF1 = 10-7 ⎢ 0 4.83 0 ⎥ (7)
⎣ 0 0 5.57 ⎦
⎡1.68 0 0 ⎤
K SF2 = 10-7 ⎢ 0 1.71 0 ⎥ (8)
⎣ 0 0 2.70⎦
4.2. Flow fronts
The PUR foam expansion is convex half-elliptical in Y-direction during the manufacturing of the plate
(figure 7). The flow front takes up the full cavity height in the Z-direction with a slight convex curve. The
simulation results show very good agreement with the observed experimental flow profile. Even the flatter flow
front in the Y- and Z-direction is visible when using a spacer fabric compared to the foam expansion in the
empty cavity. This behaviour is attributed to the interplay between the flow resistivity because of the
chemoviscosity of the expanding foam and the obstructions induced by the porous media within the domain.
There is only one difference between experiment and simulation in moulding tool 1 for the manufacturing of the
plate, when a spacer fabric is used. The curvature of the spacer threads is directed away from one side wall of the
cavity. This forms a flow channel with lower flow resistance. The PUR foam prefers this in the experiment, which
results in a flow front advance. The simulation is not able to take this into account because the spacer fabric is
considered as a homogeneous flow resistance.
The flow front of the PUR foam is divided into four half-elliptical parts in the Y-direction by the four-part
sprue of the moulding tool 2 for manufacturing the beam (figure 8). The expansion in the Z-direction is irregular
because of the greater cavity height compared to the plate. The flow resistance in the Y-direction is higher
compared to the Z-direction when using spacer fabrics, which results in a faster expansion of the foam upwards.
The foam touches the top of the cavity already with 30 g, which is earlier in comparison to the expansion without
spacer fabric. The flow front of the foam in Y-direction advances without spacer fabric at the bottom where it
reaches the opposite cavity wall. The corner above is filled afterwards. All these observations about the expansion
8Eng. Res. Express 3 (2021) 025027 K Schäfer et al
Figure 8. Comparison between real and simulated filling studies for the manufacturing of (a) unreinforced and (b) 3D continuous
fibre reinforced polyurethane foam in the moulding tool 2 for beams.
in the moulding tool 2 for manufacturing the beam are exactly reproduced by the simulation. There are some
differences when using a spacer fabric in this tool, however. A convex curve in the Z-direction is formed in the
experiment, because the foam adheres to the fibres immediately after emerging from the sprue at a height of
15 mm. The foam reaches the opposite cavity wall at a medium height therefore and then fills the corners above
and below. The simulations do not reproduce this. An advance of the foam front at the bottom is found instead.
The reason for this is that the spacer fabric is only considered as flow resistance in the simulation and adhesion is
not taken into account.
The maximum cavity height of the moulding tool 3 for manufacturing the wave is comparable to the plate.
This is therefore completely taken up with a slight convex curve during the whole PUR expansion. The foam
initially expands convex half-elliptical in Y direction without spacer fabric, which is also comparable to the
manufacturing of the plate (figure 9). This is based on the comparable sprue. The spacer fabric in the partial area
of the cavity causes the PUR foam to preferably occupy the free areas next to the insert. This leads to an
expansion in three convex half-elliptical parts. The opposite cavity wall is reached in this way and the thick part
of the wave mould is completely filled. The long and very thin areas of the cavity are filled afterwards. The reason
for this is the feed into the widened cavity area and the greater space for expansion there. The thin areas are filled
with a flow front along the Y-direction in positive and negative X-direction. The agreement of the flow front
between experiment and simulation is exact in this mould.
4.3. Filling level
The average deviation of the two-component mixing and dispensing low-pressure system from the set feed
masses over all tests was 1.4 g. The maximum was 4.9 g. The complete filling of the empty cavity of moulding tool
1 for the manufacturing of the plate requires 45% less PUR reaction mass compared to moulding tool 3 for the
manufacturing of the wave, although the cavity volumes and the sprue are comparable. The reason for this is the
different complexity of the form of the mouldings. The moulding tool 2 for manufacturing the beam has a two
times larger cavity than the other two moulding tools and therefore requires the largest PUR reaction mass for a
complete filling. This is about 140% more compared to the plate and about 30% more compared to the wave.
The sprue mass in the filling studies to manufacture the plate was constant at 1.7 g. The infiltration of SF 1
required additional 15% PUR reaction mass compared to the complete filling of the empty cavity (figure 10).
The expansion ratios of the volumes of the PUR reaction mass and the resulting PUR foam in this mould were 1
9Eng. Res. Express 3 (2021) 025027 K Schäfer et al
Figure 9. Comparison between real and simulated filling studies for the manufacturing of (a) unreinforced and (b) 3D continuous
fibre reinforced polyurethane foam in the moulding tool 3 for waves.
Figure 10. Comparison between real and simulated filling levels of the foam in the manufacturing of unreinforced and 3D continuous
fibre reinforced polyurethane foams with the moulding tool 1 for plates.
to 19.7 without and 1 to 16.8 with spacer fabric. The sprue mass in moulding tool 2 for manufacturing the beam
was constant at 3.5 g. Additional 40% PUR reaction mass was required in comparison to the empty cavity to
achieve a complete filling with SF 2 inserted (figure 11). The expansion ratio without spacer fabric was 1 to 18.4
and with 1 to 13.1. A constant sprue mass of 2.5 g was found in the filling studies of the wave. An additional PUR
reaction mass of 10 % was sufficient to manufacture the complete reinforced moulding compared to the empty
cavity (figure 12), because the spacer fabric was only partially integrated. The expansion ratios were 1 to 12.7
without and 1 to 11.6 with spacer fabric.
10Eng. Res. Express 3 (2021) 025027 K Schäfer et al
Figure 11. Comparison between real and simulated filling levels of the foam in the manufacturing of unreinforced and 3D continuous
fibre reinforced polyurethane foams with the moulding tool 2 for beams.
Figure 12. Comparison between real and simulated filling levels of the foam in the manufacturing of unreinforced and 3D continuous
fibre reinforced polyurethane foams with the moulding tool 3 for waves.
The PUR foam expanded linearly in all three moulding tools up to a filling level of 90% (figures 10–12). The
curves then behave degressively. The need for increased PUR reaction masses for a complete cavity filling when
using spacer fabrics was also demonstrated for all three moulding tools, although the textiles already occupy up
to 4.4% of the cavity volume. The reduced expansion caused by spacer fabrics occurs only at later filling levels
(figures 10–12). In the case of the plate this can be noticed from about 70%, in the case of the beam from about
80% and in the case of the wave from about 99%. The last percentage corresponds completely to the thin area of
the wave with a thickness of 1.6 mm, which despite its length of 125 mm only accounts for this small volume
portion of the moulding (see figure 4).
11Eng. Res. Express 3 (2021) 025027 K Schäfer et al
Figure 13. Comparison between real and simulated bulk densities of the foam in the manufacturing of unreinforced and 3D
continuous fibre reinforced polyurethane foams with the moulding tool 1 for plates.
The simulations show very good quantitative agreement for the filling levels in mould 1 for manufacturing
the plate with and without spacer fabric (figure 10). This is also the case for the manufacturing of the beam
without textile insert (figure 11). Differences occur in the infiltration of the spacer fabric in moulding tool 2. The
simulation predicts a complete filling of the cavity with PUR foam at slightly over 60 g. A minimum of 85 g is
required in the experiment in contrast. The degressive filling behaviour of the foam observed in the experiment
between 50 g and 85 g could not be reproduced in the simulation. A reason for this discrepancy could be related
to the increasing pressure build-up in the cavity caused by the gas generation as the injection mass increases. This
is not well captured in the current models because the mathematical framework does not include the
dependence of the expansion on the pressure within the system. The pressure rise in the mould is usually above
the atmospheric pressure. This increase in pressure would result in lower foam expansion because of pressure
induced counter forces, which act against the motion of the expanding foam. The pressure in the simulation is
currently set at atmospheric pressure (see section 1). This is also the reason for differences between simulation
and experiment in moulding tool 3 for the manufacturing of the wave (figure 12). The complete wave is
manufactured using 50 g without and 55 g with spacer fabric. Inconsistent in this respect are the results of the
simulation where in both cases 35 g is sufficient for a complete cavity filling. A massive pressure increase in the
cavity can be assumed when filling the thin areas. This results from the long flow path, which leads to an
increased viscosity of the reaction mass because of the progressed chemical reactions. An excessive amount of
reaction mass is required for moving the material to a complete cavity filling therefore, which generates pressure
in the system.
4.4. Bulk density
Differences between the non-reinforced mouldings can also be found when considering the bulk density after
the cavities have been completely filled. The beam had a 10% and the wave a 60% higher foam bulk density
compared to the plate. The spacer fabrics also compact the PUR foam in the plate by 20%, in the beam by 50%
and in the wave by 15% (figures 13–15). The PUR foam first expands continuously in all three moulds during the
cavity filling process with a bulk density of 50 kg m−3 to 60 kg m−3. The compaction of the PUR foam begins
progressively at the point of degressive drop in expansion at 90% filling level. Foam compaction by the spacer
fabrics begins at the same time as the reduced expansion through them begins in the respective mould.
The simulated bulk densities of the PUR foam generally show good agreement with all experiments carried
out (figures 13–15). The continuous foam expansion at the beginning with 50 kg m−3 to 60 kg m−3 is correctly
predicted just like the varying rises of the bulk density at the end depending on the moulding tool. However, the
final bulk density in the manufacturing of the beam with spacer fabric and the wave in general only agrees with
the experiments when considering the same PUR reaction masses and not the points where the cavities are
completely filled. About 20 g less PUR reaction mass is required in the simulations in these three constellations
12Eng. Res. Express 3 (2021) 025027 K Schäfer et al
Figure 14. Comparison between real and simulated bulk densities of the foam in the manufacturing of unreinforced and 3D
continuous fibre reinforced polyurethane foams with the moulding tool 2 for beams.
Figure 15. Comparison between real and simulated bulk densities of the foam in the manufacturing of unreinforced and 3D
continuous fibre reinforced polyurethane foams with the moulding tool 3 for waves.
compared to the experiments (see section 4.3). The foam bulk density has also not increased in the simulations of
these experiments when the cavity is completely filled. A good agreement of the final bulk density is achieved
when the simulations are carried out with the PUR reaction mass, which leads to a complete filling of the cavity
in the experiments.
5. Conclusion
The SRIM with PUR foam and spacer fabrics was investigated in this work. Experimental and computational
filling studies were carried out in three moulds with different cavities with and without textile inserts. It was
13Eng. Res. Express 3 (2021) 025027 K Schäfer et al
shown that PUR foam expansion is significantly influenced by the sprue type, cavity design and spacer fabric.
The level of cavity filling and the bulk density in relation to the PUR reaction mass are directly linked. If the filling
level runs linearly, the bulk density is constant. However, if the filling level runs degressively, the foam is
compressed and the bulk density develops progressively.
The sprue takes up a considerable part of the flow path of the PUR foam in the process. Longer flow paths
result in higher foam bulk densities, as the viscosity of the PUR reaction mixture increases over time (see
literature of section 1). The design of the sprue therefore has a significant influence on the expansion in the
cavity. The foam bulk density of the manufactured beams was 10% higher in comparison to the plate, because
the corresponding moulding tool had a sprue with a double volume. The influence of a complex cavity design
was investigated using the example of a wave as a moulding. A 60% higher foam bulk density was determined in
comparison to the beam, because the PUR reaction mass was compacted at narrow areas. For all three moulds
was proven that the foam expansion is hindered by spacer fabrics as inserts. Increased reaction masses for
complete cavity filling become necessary because of their use. SF 1 compacted the foam by 20% in the
manufacturing of the plate and by 15% in the wave. SF 2 with a 3.7 times higher stitch and spacer thread density
compressed the PUR foam in the moulding tool of the beam by 50%.
This foam compaction only starts from a high cavity filling level of at least 70%, which became clear in the
comparison with the filling studies without spacer fabric. On the one hand, this is based on the continuous
dissipation of the temperature of the PUR formation by the spacer fabrics. Up to 160 °C are generated in the
exothermic polyaddition reaction (see section 1), while the spacer fabrics in the process were at room
temperature. On the other hand, the threads of the spacer fabrics cut the pores of the foam. The forming CO2
cannot be contained in the plastic mass and flows out of it. But as blowing agent it is essential for a complete
cavity filling with low foam bulk density. This is not critical at the beginning of the process, because continuously
more PUR reaction mass is fed, which forms new CO2. The significant increase in foam bulk density begins,
when the feed is stopped and the reaction temperature is decreased.
The results from the simulation compared favourably with the experimental observations for the flow
fronts, filling levels and bulk densities. Excellent was the agreement in the manufacturing of the plate. Minor
discrepancies are caused in some cases when an obvious pressure build-up occurs in the moulding tool like in
the manufacturing of the beam or the wave. The pressure rise within large cavities induces a resisting force
because of the generated gas, which opposes the expansion of the foam. This is for example the case in the
manufacturing of the beam. The effect is currently not well captured because the model is based on
incompressibility of the expanding foam and constant atmospheric pressure in the free space of the cavity. The
discrepancies to the experimental results are therefore created. The interplay between the chemoviscosity of the
foam and the pressure at geometric constrictions is also not well captured in the model. This explains the
observed differences in the manufacturing of the wave. The approach for further investigations is based on these
observations and the need to adequately incorporate pressure effects into the models.
Acknowledgments
This research was funded by the German Federal Ministry of Education and Research, Grant No. 03IPT508X
and the German Research Foundation, Grant No. EXC 1075 as well as the Fraunhofer High Performance Center
for Simulation- and Software-based Innovation.
Data availability statement
All data that support the findings of this study are included within the article (and any supplementary files).
ORCID iDs
Kay Schäfer https://orcid.org/0000-0001-5433-483X
Daisy Nestler https://orcid.org/0000-0002-3521-4194
References
[1] Grünewald J, Parlevliet P and Altstädt V 2017 J. Thermoplast. Compos. 30 437–464
[2] Lainé C, Le Grognec P, Comas Cardona S and Binetruy C 2013 Int. J. Mech. Sci. 67 42–52
[3] Khan T, Acar V, Aydin M R, Hülagü B, Akbulut H and Seydibeyoğlu M Ö 2020 Polym. Composite 41 2355–2400
[4] Yosomlya R and Morimoto K 1984 Ind. Eng. Chem. Prod. R. D. 23 605–608
[5] Schneider F W 1977 J. Cell. Plast. 13 404–407
14Eng. Res. Express 3 (2021) 025027 K Schäfer et al
[6] Baltes L S and Tierean M H 2009 Proc. 1st Int. Conf. on Manuf. Eng. 2 291–295
[7] Hurley M F 2001 SAE Tech. Pap. 90810
[8] Kabakci E, Syer G, Suvaci E, Uysal O, Güler I and Kaya M 2017 J. Appl. Polym. Sci. 134 44870
[9] Braun H-J, Eyerer P, Frank U, Hüttner M, Ludwig H-J and Wurster T 1988 Adv. Polym. Tech. 8 17–26
[10] Kamal M R, Singh P, Samak Q and Kakarala S M 1987 Polym. Eng. Sci. 27 1258–1264
[11] Chen F, Cao C P, Zhang W and Sun Y 2010 Adv. Mat. Res. 154–155 981–986
[12] Cao C P, Sun Y and Li Y 2013 Adv. Mat. Res. 748 96–100
[13] Kim D S and Macosko C W 2000 Polym. Eng. Sci. 40 2205–2216
[14] Wirth S, Gauvin R and Kendall K 1998 J. Reinf. Plast. Compos. 17 964–988
[15] Makey P W, Schroeder J M and Covins K G 1992 SAE Tech. Papers 90092
[16] Li J, Xia L B and Liu Q 2011 Adv. Mat. Res. 187 444–447
[17] Ye X, Hu H and Feng X 2008 J. Ind. Text. 37 213–223
[18] Schäfer K, Valentin S, Meier B, Roth I and Helbig F 2014 KWP 32–5
[19] Schäfer K, Meier B, Anders S, Helbig F and Kroll L 2014 KWP 34–6
[20] Chen S and Long H 2013 Adv. Mat. Res. 821–822 1152–1158
[21] Chen S, Long H, Liu Y-H and Hu F-C 2015 Autex Res. J. 15 127–137
[22] Pan Y-J, Hsieh C-T, Huang C-L, Huang C-H, Lou C-W, Li C-W and Lin J-H 2015 Fibers Polym. 16 2682–2688
[23] Pan Y-J, Lou C-W, Hsieh C-T, Huang C-H, Lin Z-I, Li C-W and Lin J-H 2016 Fibers Polym. 17 789–794
[24] Baser S A and Khakhar D V 1994 Polym. Eng. Sci. 34 642–649
[25] Zhao Y, Gordon M J, Tekeei A, Hsieh F-H and Suppes G J 2013 J. Appl. Polym. Sci. 130 1131–1138
[26] Lefebvre L and Keunings R 1995 Int. J. Numer. Meth. Fl. 20 319–334
[27] Seo D and Youn J R 2005 Polymer 46 6482–6493
[28] Mitani T and Hamada H 2003 Polym. Eng. Sci. 43 1603–1612
[29] Halley P J and Mackay M E 1996 Polym. Eng. Sci. 36 593–609
[30] Geier S and Piesche M 2014 J. Comput. Multiphase Flows 6 377–390
[31] Geier S, Winkler C and Piesche M 2009 Chem. Eng. Technol. 9 1438–1447
[32] Rao R R, Mondy L A, Noble D R, Moffat H K, Adolf D B and Notz P K 2011 Int. J. Numer. Meth. Fl. 68 1362–1392
[33] Rao R, Mondy L, Noble D, Brunini V, Long K, Roberts C, Wyatt N, Celina M, Thompson K and Tinsley J 2018 Comput. Fluids 175
20–35
[34] Karimi M, Marchisio D, Laurini E, Fermeglia M and Pricl S 2018 Chem. Eng. Sci. 178 39–47
[35] Abdessalam H, Abbès B, Li Y, Guo Y-Q, Kwassi E and Romain J-L 2016 Int. J. Mater. Form. 9 85–100
[36] Özdemir I B and Akar F 2018 Heat Mass Transfer 54 1281–1288
[37] Bikard J, Bruchon J, Coupez T and Silva L 2007 Colloids Surf. A 309 49–63
[38] Ireka I E, Niedziela D, Schäfer K, Tröltzsch J, Steiner K, Helbig F, Chinyoka T and Kroll L 2015 Phys. Fluids 27 113102
[39] Kamal M R 1974 Polym. Eng. Sci. 14 231–239
[40] Niedziela D, Ireka I E and Steiner K 2019 Polymers-Basel 11 100
[41] Schäfer K, Nestler D, Tröltzsch J, Ireka I, Niedziela D, Steiner K and Kroll L 2020 Polymers-Basel 12 105
15You can also read