Vulnerability of Senegal's South coast: Perspectives with the climate change's context
←
→
Page content transcription
If your browser does not render page correctly, please read the page content below
Vulnerability of Senegal’s South coast:
                      Perspectives with the climate change’s context

                                 Cheikhou Oumar NDIAYE, Senegal
                                      Alioune KANE, Senegal
                                    Violeta PUSCASU, Romania

Key words: shoreline, marine hydrodynamic, climate change, coastal vulnerability

SUMMARY

The shoreline is an environment that serves as an interface between continent and sea. The
analysis offers a succession of natural ecosystems and socio-economic installations. The
space remains under the influence of the urbanization, the development of tourism, the
seaports, the fisheries, etc. Thus, it occupies an important aesthetic and economic position like
the Senegal’s petite côte shoreline1.
Indeed, the south shoreline saw settling down since the colonization several industrial, tourist
and nautical activities. The Port of Dakar participated into the reconfiguration of the
landscape by taking a catalyst role on the proliferation of the industrial units. The port makes
also the increase of the urban population on the Cap Vert’s peninsula. The place is a site of
profusion of the economic actors. The evolution of the natural environment is at the origin of
several anxieties both on the balance of the shoreline ecosystems and on the durability of the
coastal developments.
The major challenges that appear in the management of the harbor’s coast, are diverse and the
rise of the sea level constitute a fundamental aspect in the future of shoreline. At present, the
climate change mean, on a large scale, several modifications in the functioning of the marine
environment. The disturbances that are observed into the circulation’s mode of the marine
waters, and they involve collectively a rise of the marine level with harmful consequences on
the coastal areas. The south coast is under the strong variability of the marine level and its
impacts.
The effects of climate change place the harbor coast in a vulnerability position to the sea inching. The low zones
are exposed to the sea level rise. The floods and the lands’ losses are aspects that underline the exposure to the
natural phenomena. …

1
  The petite côte’s shoreline begins at Cap Manuel to Casamance. For this study, our choice concerns the
shoreline between Cap Manuel to le Saloum. The developpement of socioéconomics activities are more
important in this part of the Senegalese’s coastal area.
TS04I - Hydrography-Assisted Monitoring                                                   1/18
Vulnerability of Senegal’s South coast: Perspectives with the climate change’s context
Cheikhou Oumar NDIAYE, Senegal, Alioune KANE, Senegal, Violeta PUSCASU, Romania

FIG Conference 2011
Bridging the Gap Between Cultures –
Marrakech, Morocco, 18-22 May 2011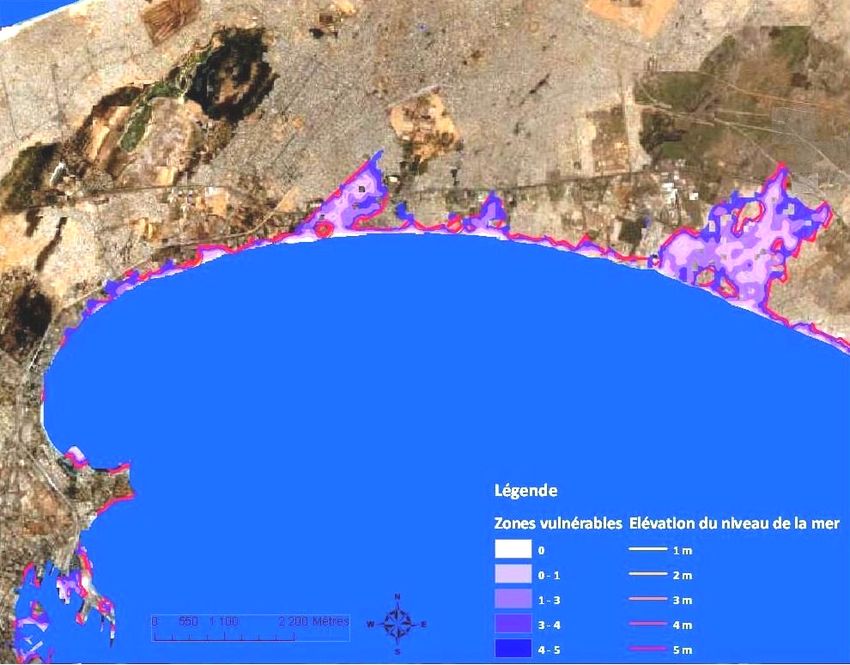
Vulnerability of Senegal’s South coast:
                     Perspectives with the climate change’s context

                                Cheikhou Oumar NDIAYE, Senegal
                                     Alioune KANE, Senegal
                                   Violeta PUSCASU, Romania

1. INTRODUCTION
The petite côte’s shoreline2 shelters many natural habitats and resources: mangroves swamps,
strikes rockies, sandy beaches, wet zones and lagoons, bays, coral reefs, etc. The coastal area
is a sector of profusion of the marine life. The presence of the coastal and marine ecosystems
reveals the importance of this coast’s wealth. Several natural elements facilitate its charm and
biodiversity. (DIAW A. T. et al. (1993). Gestion des ressources côtières et littorales du
Sénégal : Actes des ateliers de Gorée 27-29 juillet 1992, UICN, Gland, Suisse, +484p.)
Thus, diverse socioéconomics arrangements and human establishments adjoin or take turns on
the south coast. The cohabitation of the aforesaid factors is more important on the harbor
domain. Between Cap Manuel and Yenne, the zone constitutes a pole of convergence where
the interactions between the diverse harbor, industrial, tourist actors are very marked. The
arrangements became diversifed and the activities are multiplied in connection with the
natural environment. (NDIAYE K. (2003). La problématique de manutention des produits
dangereux au Port Autonome de Dakar, mémoire maîtrise, UGB, 138p.)Fejl!
Henvisningskilde ikke fundet.
Indeed, the harbor coast sets up as a site of interaction between physical, biological and
anthropological constituents. The space is subjected to an evolution or a reconfiguration of the
coastal environment. (BENGA A. G. F. (2006). Potentiels et productions Anadara senilis
dans la réserve de biosphère du delta du Saloum perspectives d’exploitation rationnelle, thèse
doctorat 3ème cycle, UCAD, 371p.) The confrontations earth / sea raise many problems of
vulnerability in the place, especially with the emergence of the climate change.
Then, following the example of shorelines environement, the harbor coast is overstressed by
the impacts of climate change and the activities’ variety. The strong variations of the climatic
effects strain on the environment many changes on the dynamics of the marine midships.
(NDIAYE C. O. (2007). Pollution du littoral par les activités du Port Autonome de Dakar,
mémoire de maîtrise, UGB, 131p. En ligne) The marine hydrodynamics hold an important
place from the point of view of harbor water. It’s more fundamental in the sectors which the
structure is semi closed as bays or wide handles. The harbor environment is a space exposed
to the evolution of the natural environment.

2
  The coast of Senegal is divided between the Grande Côte (North) and the Petite Côte (South). The city of
Dakar is like an island what owes the name of peninsula of Cap Vert, it is the most advanced headland of the
African West Coast. The north part of Saint Louis's coast up to the headland of Almadies belongs to the Grande
Côte; and the south part between the Cap Manuel to Casamance is located on the Petite Côte. In this study, the
interest is essentially concerned a part of the Petite Côte of Senegal.
TS04I - Hydrography-Assisted Monitoring                                                        2/18
Vulnerability of Senegal’s South coast: Perspectives with the climate change’s context
Cheikhou Oumar NDIAYE, Senegal, Alioune KANE, Senegal, Violeta PUSCASU, Romania

FIG Conference 2011
Bridging the Gap Between Cultures –
Marrakech, Morocco, 18-22 May 2011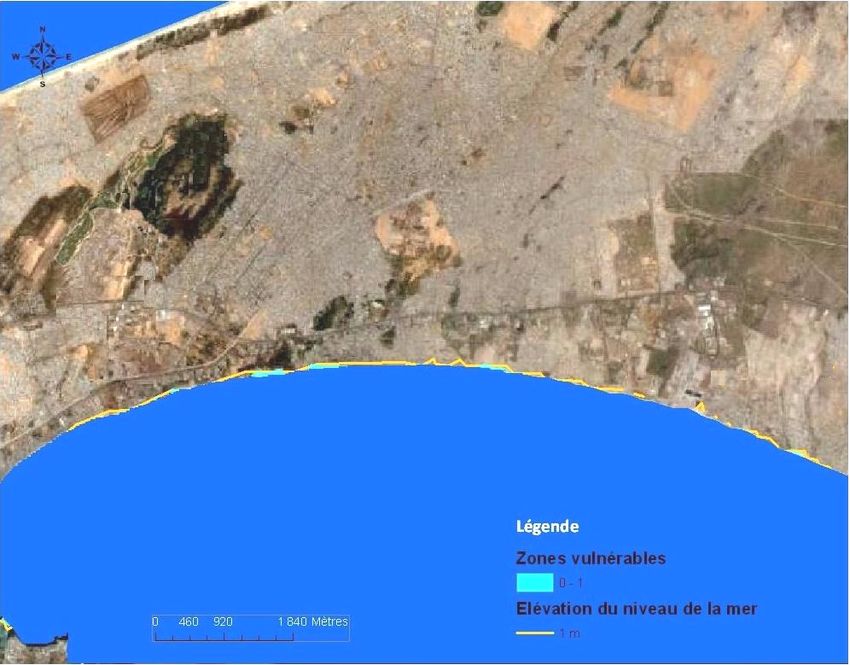
2. PLACE OF STUDY
The shoreline coast is an environment hardly desired for the socioéconomics activities. The
industrial units, the urban establishments and the nautical spaces extend gradually along the
coast. This evolution remains bound to the presence of the harbor of Dakar that plays, since
its creation, a role of attraction of activities. The juxtaposition of the investments around the
harbor puts anxieties both on the marine environment and on the future of the arrangements
on an unstable and changeable shoreline space.
The harbor of Dakar occupies a favorable geographical position because of its natural shelter
situated on a wide bay. It is situated on the most advanced headland of the African west coast.
It’s also leaned in the peninsula of the Cap Manuel, and its water place is able to offer to ships
a safe natural site for all their nautical operations. (cf. Figure 1)

   Pointe des Almadies

                                      Figure 1 : Peninsula of Cap Vert

Economic investments, industrial arrangements, hotels, dikes, marinas, housing environments
and local fisheries set up themselves in a progressive way on the coastal band. The coast was
always a dynamic environment of interaction as earth / sea interfaces. The marine phenomena
constitute major aspects that cannot be separated from the stability of the coast. The multiple
movements of the sea weaken the realizations of the shoreline.

TS04I - Hydrography-Assisted Monitoring                                                  3/18
Vulnerability of Senegal’s South coast: Perspectives with the climate change’s context
Cheikhou Oumar NDIAYE, Senegal, Alioune KANE, Senegal, Violeta PUSCASU, Romania

FIG Conference 2011
Bridging the Gap Between Cultures –
Marrakech, Morocco, 18-22 May 2011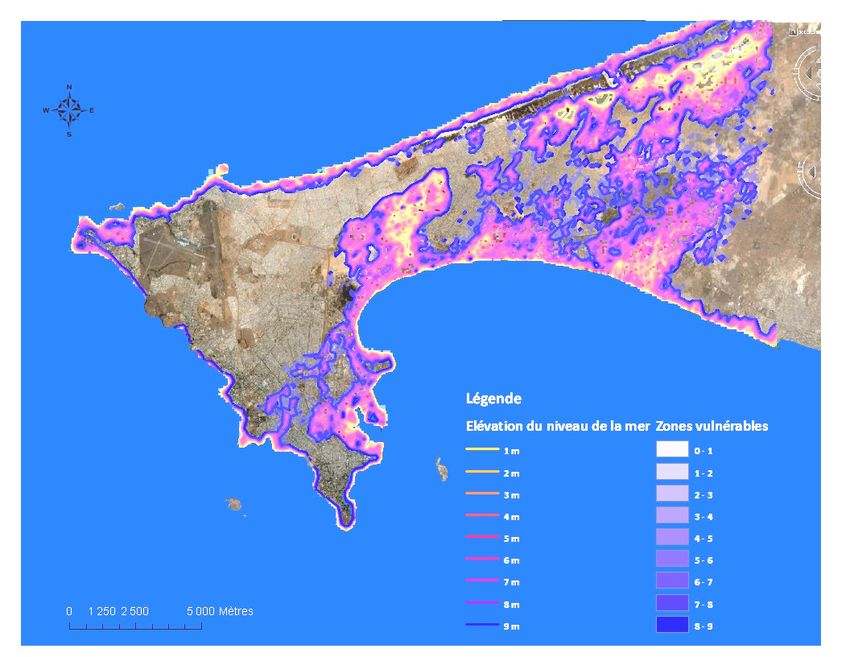
3. MÉTHODOLOGY
It allowed guiding the research during the stages of collection and analysis of data of
observation or experiment. It is established by two big phases: the review of the
documentation, and the processing of physical data and hydrodynamics.
                                  I. Documentation’s Review
During this stage, a review of the documentation produced on the question of research was
realized. It allowed us to consult several works to include better the problem of the shoreline
zone of the Cap Vert and the marine hydrodynamics.
During its elaboration, several documentation centers were visited. University libraries
facilitated the consultation of general works on the shoreline circles. The documentation of
training centers allowed entering on knowledge of scientific works (reports, studies, technical
reports, etc.) concerning the marine pollution, the dynamics and the evolution of the space of
the coast or on the Senegalese Petite Côte.
                             II. The acquisition and data processing
1. The physicals data
This phase also allowed collecting data on the physical conditions of the Cap Vert (wind,
temperature and pluviometer). The previously mentioned factors occupy an important place
from the point of view of water midships because they govern the marine state into the harbor
domain. Then, it is important to study these factors because they are connected to the marine
dynamism of the Petite Côte.
The data on the hydrodynamism of the water stretch were collected at the same time. This
information allows us to know the functioning of the marine environment through the
conditions hydrodynamics such as the tide, the swell and the sea currents. The data were
generally gathered or reconstituted due to the lack of an accessible database.
2. The topography and the bathymetry
The topography is essentially obtained with the data from SRTM 3arcs seconds. The software
Global Mapper 9 realized the extraction of contour lines. Therefore, the low zones could be
identified for the simulation of the floods in the middle sailor.
The bathymetric data are translated into models three (03) dimensions with the tool to Surfer
8. They are constituted by using a process of three (03) stages: the georeferencing of maps,
the research of geographical coordinates of isobathes and data capture in a table Access. The
bathymetric information is elaborated to obtain three-dimensional data XYZ (coordinates
UTM and depth).
3. The treatment and the analysis
The research required generally the use of cartographic software, statistical treatments, images
and the programs of projection in three dimensions (3D). The diverse employed applications
are intended to make better the question of the vulnerability of the coastal zone.
On one hand, the mapping was made with the images of the Google software Earth Pro. The
downloaded images are georeferenced to complete the data of simulation. On the other hand,
the tool Global Mapper 9 allowed the preliminary treatment of the SRTM. The use of this tool
TS04I - Hydrography-Assisted Monitoring                                                  4/18
Vulnerability of Senegal’s South coast: Perspectives with the climate change’s context
Cheikhou Oumar NDIAYE, Senegal, Alioune KANE, Senegal, Violeta PUSCASU, Romania

FIG Conference 2011
Bridging the Gap Between Cultures –
Marrakech, Morocco, 18-22 May 2011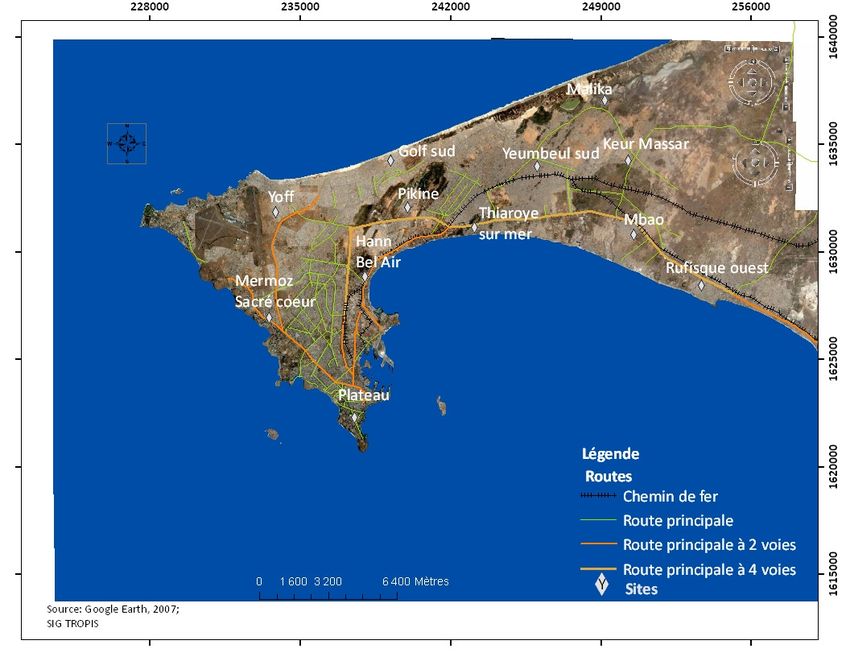
has interest to generate contour lines overall studied zone. The choice of the levels curves is
propped up in an interval of 1 m to be able to observe the low zones and the vulnerable
sectors in the overhang of the sea.
Then, the Surfer program 8.00 is applied in the bathymetric treatment. The data are elaborated
in files DBase IV to be used in the software.

4. RESULTS
I-Slowness of the marine dynamics
The calm of the marine dynamics is approached through the hydrodynamics conditions that
govern the water stretch. Swells (directions and periods), the bathymetry and the climatic
factors allow a better apprehension of the phenomenon and its behavior on the site.

4.1. Circulation of the swell
The variations of the swell come along with a change of the sea’s state. When the height of
the swell is important, the sea becomes agitated. The Senegalese coast is subjected to two
types of swell:
        -   a swell of direction NW,
        -   a swell of direction SW.
The plan of the swell NW knows a progressive diffraction3 of the energy along the coast of
the Cap Vert. The first diffraction is produced at the level of the headland of Almadies and in
the forefront of Fann (cf. Figure 1). This change of waves’ rhythm is going to provoke the
second diffraction in the passage of the Cap Manuel. Then a refraction4 of the swell occurs. It
is due to the decrease of the marine depths on the Cap Manuel’s zone. The swell loses a big
part of its energy upon his arrival in the bay of Gorée. It takes rather a direction quite
perpendicular to coast.
On the other hand, the swell of direction SW tends to shake the sea of the bay of Gorée. This
disturbance is also felt at the internal harbor through the movement of reeling of boats. This
strong swell is explained by the direction change of the swell into NW. The swell SW
changes direction once at the edge of the Cap Manuel for a direction S to SE. It appears generally between
June and November.

3
  Diffraction is defined, in physic, as an undulatory phenomenon in which the wave scatters in passing at the
edge of a solid or by crossing a narrow crack.
4
  Refraction is a change of the direction of the waves resulting from a change of environment.
TS04I - Hydrography-Assisted Monitoring                                                        5/18
Vulnerability of Senegal’s South coast: Perspectives with the climate change’s context
Cheikhou Oumar NDIAYE, Senegal, Alioune KANE, Senegal, Violeta PUSCASU, Romania

FIG Conference 2011
Bridging the Gap Between Cultures –
Marrakech, Morocco, 18-22 May 2011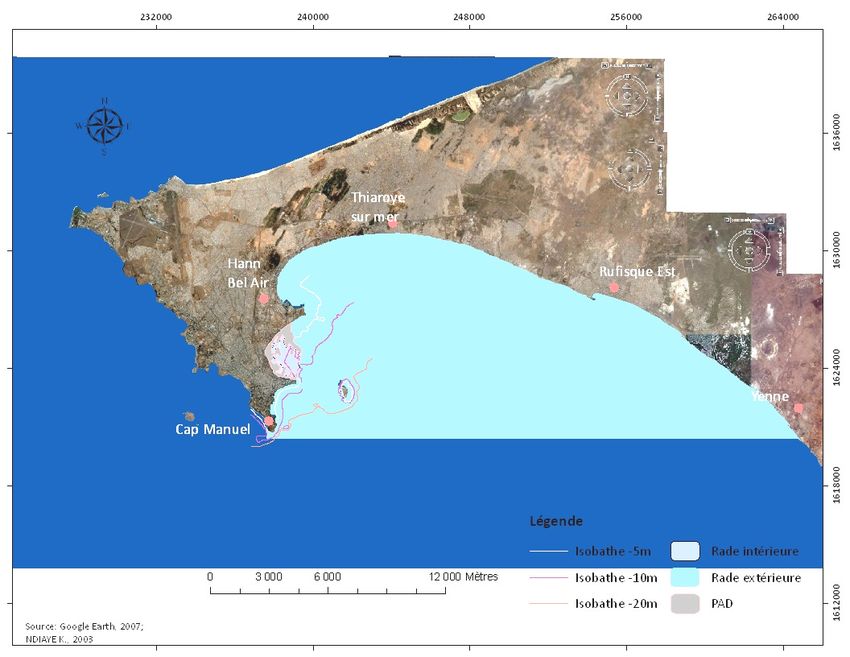
60%

                   50%

                   40%

                   30%

                   20%

                   10%

                    0%
                          janvier-mars     avril-juin   juillet-septembre octobre-décembre

                          indéterminée   calme           11 sec

                         Figure 2 : Swell’s periods in thr south part of Cap Vert
 Source : According to TURMINE V. (2000). Dynamique littorale entre Mbour  et Joal (Petite côte
                   Sénégal), mémoire de maîtrise, université Paris VII, 249p.
Indeed, in the South of the Cap Vert, swells have periods often lower than 5 seconds do. They
do not involve a disturbance of the water stretch. The only excitement on the marine
environment results from swells than periods are superior to 11 seconds. On the scale of year,
these swells have a 4% frequency, so they are weakly distinguished. The months when these
strong swells circulate from the point of view of water extend between October and
December. The tranquillity of the water stretch in the internal harbor is affected by swells in
strong period. (cf. Figure 2Figure 2 : Swell’s periods in thr south part of Cap Vert)
It is important to note also that the swells, which come in the internal harbor of the port, are
often low. This explains by the north and south piers that protect the stretch of water of the
excitements due to the conditions hydrodynamics.

4.2. Bathymetry
The depth, the architecture of the coast and the extent of the water stretch play an essential
role on the strength of the hydrodynamics conditions. They participate to increase the
consequences of the swell and the currents. The depths of the water stretch in the internal
harbor contain isobaths contours -8 to -12 m. In 1997, they are essentially characterized by
isobaths contours -5 m and -10 m.
The bathymetry of the internal harbor evolved during the works of extension and dredgings of
the harbor of Dakar. The realized operations of dredgings are characterized by absences of
information on extracted sediments. Between 1988 and 1990, a total volume of sediments of
541 161 m3 was taken in this environment. They represent a rhythm of 270 580 m3/year
approximately. (BCEOM (2007). Etude de faisabilité pour l’aménagement d’un chenal
d’accès au 3ème poste à quai dragué à -13,00 m pour navires porte-conteneurs, Etude
d’impacts environnementaux, version provisoire.)
The water stretch of the outside harbor is marked by the isobaths ontours -10 and -20 m.
Between the headland of Bel Air and the bay of Hann, the isobath -10 m is situated in 1 500
m of the shore. Between the sector of Thiaroye sur mer sea and the city of Rufisque, it is 2
000 m of the shore. The isobathe -20 m passes in suburb of the Gorée Island towards the
TS04I - Hydrography-Assisted Monitoring                                                      6/18
Vulnerability of Senegal’s South coast: Perspectives with the climate change’s context
Cheikhou Oumar NDIAYE, Senegal, Alioune KANE, Senegal, Violeta PUSCASU, Romania

FIG Conference 2011
Bridging the Gap Between Cultures –
Marrakech, Morocco, 18-22 May 2011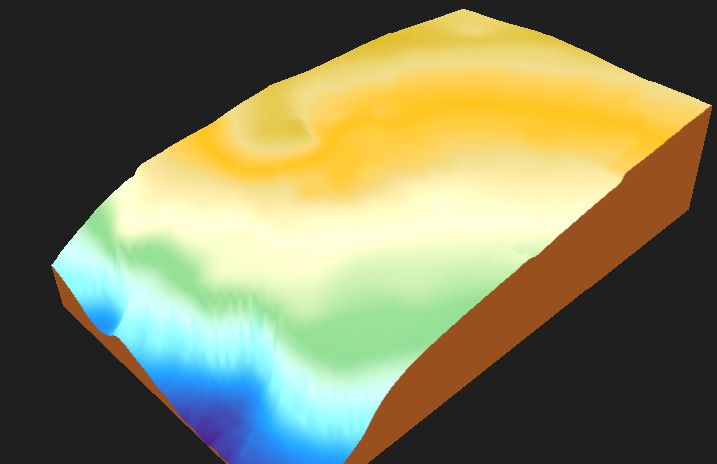
south part. It is respectively situated at a distance of 6 000 m and 4 000 m of the shore of the
bay of Hann and the city of Rufisque. (BCEOM (2007). Etude de faisabilité pour
l’aménagement d’un chenal d’accès au 3ème poste à quai dragué à -13,00 m pour navires
porte-conteneurs, Etude d’impacts environnementaux, version provisoire.)

                                                                            Bathymétrie portuaire (m)

                                                                                            0
                                                                                            -10
                                                                                            -20
                                                                                            -30
                                                                                            -40
                                                                                            -50
                                                                                            -60
                                                                                            -70
                                                                                            -80
                                                                                            -90
                                                                                            -100
                                                                                            -110
                                                                                            -120
                                                                                            -130
                                                                                            -140
                                                                                            -150
                                                                                            -160
                                                                                            -170
                                                                                            -180
                                                                                            -190
                                                                                            -200
                                                                                            -210
                                                                                            -220
                                                                                            -230
                                                                                            -240
                                                                                            -250
                                                                                            -260

                                 Figure 3 : Bathymetry of harbor domain
  Source: According to data of Canadian Hydrographic Service, bathymetry of Senegal (january – april 1976)

The Figure 3 allows us to observe the bathymetry of the harbor domain. The continental shelf
widens more by leaving from the Cap Manuel towards Yenne. Isobaths contours goes away
from the shore when we progress to the south of the harbor domain. This fact justifies the
width of the continental shelf that extends gradually by leaving to the south of the Petite Côte.
The bathymetry of the harbor water stretch is little deep because of the width of the
continental shelf (isobaths contour -20 m about 6 000 m of the shore and going away from the
shore in the South of the Cap Vert). The depth of seabed also intervenes on the strength of
swells registered in the harbor water stretch. When it is important, the heights of the recorded
swells are rather strong.
Slopes also participate into the hydrodynamism of the harbor domain. In the outside
roadstead, they are more important near of the headland than on bays. The slopes of the
headland of Dakar and Bel Air are respectively 0,009 and 0,007. The bay of Dakar presents
slopes situated between 0,004 and 0,006 (BCEOM (2007). Etude de faisabilité pour
l’aménagement d’un chenal d’accès au 3ème poste à quai dragué à -13,00 m pour navires
porte-conteneurs, Etude d’impacts environnementaux, version provisoire.). Their weakness is
bound to the surface of the continental shelf on the harbor domain. Isobaths contours are
spaced out and they make the implementation of low slopes on this middle.

TS04I - Hydrography-Assisted Monitoring                                                                 7/18
Vulnerability of Senegal’s South coast: Perspectives with the climate change’s context
Cheikhou Oumar NDIAYE, Senegal, Alioune KANE, Senegal, Violeta PUSCASU, Romania

FIG Conference 2011
Bridging the Gap Between Cultures –
Marrakech, Morocco, 18-22 May 2011
4.3. Temperature marinades and circulation of the wind
The temperature of the harbor’s water stretch varies between 20°C and 28°C. The salinity of
the seawater is situated approximately in 35‰. Often these factors (temperature and salinity)
vary through the months and according to the seasonal contrasts on the coast of the Cap Vert.
There are two main seasons on the oceanic masses waters into the harbor’s water stretch. We
distinguish a warm season and a cold season marked by phases of transition.
The cold season stretches on November to May. It is characterized by marine temperatures
around 20°C and salinity 35‰ into the harbor’s water stretch. The coastal upwelling settles
down gradually in January to April. It is subjected to the influences of trade winds. Marine
waters are salted and cold and they replace surfaces waters. (cf. Figure 4)
The warm season is included between June to August. The temperature of the seawater is
situated around 27°C with salinity 36‰. Waters are warm and less salted. The current of
Guinea pushes away the waters masses from the current of the Canarian Islands to northward.
These warm sea currents explain the increase of the marine temperatures inside the harbor’s
water stretch. (cf. Figure 4)
Subsequently, temperatures of 28°C and salinity of 35‰ mark the rest of the season.
(NDIAYE K. (2004). La pollution du littoral : la qualité de l’eau du Port Autonome de
Dakar, mémoire DEA, UCAD, 77p.)
30,00
25,00
20,00
°C
15,00
10,00
5,00
0,00
e
e
e
ier
t
e
ai
s
il
in
r
t
û
br
br
br
ar
ille
br
vie
r
m
ju
ao
av
vr
m
em
m
m
to
ju
jan
fé
ce
ve
oc
pt
dé
no
se
Température Moyenne
Figure 4 : Variation of surface water temperature at the costal station of Thiaroye
(1965-1983)
Source: According to FREON, (1986)
Finally, the hydrodynamics conditions of the water stretch are dominated by the winds. The
winds involve vertical movements to the water surface. They make side movements of
pollutants thrown back in the sea. Therefore, the wind counts among the main factors leading
the manuring of pollution. The variations of the dominant directions influence partially the
horizontal movement of the water and then the pollutants at the sea surface.
The Figure 5 puts in relation factors such as the speed of prevailing wind and the temperatures
of the sea and the air observed on the harbor domain.
TS04I - Hydrography-Assisted Monitoring 8/18
Vulnerability of Senegal’s South coast: Perspectives with the climate change’s context
Cheikhou Oumar NDIAYE, Senegal, Alioune KANE, Senegal, Violeta PUSCASU, Romania
FIG Conference 2011
Bridging the Gap Between Cultures –
Marrakech, Morocco, 18-22 May 201130,00 6,00
25,00 5,00
20,00 4,00
m/s
°C
15,00 3,00
10,00 2,00
5,00 1,00
0,00 0,00
e
re
e
ût
e
s
r
in
r
ai
t
ril
ie
br
ar
ie
br
ille
br
ob
m
ao
ju
av
nv
vr
m
m
m
m
ju
t
fé
ve
ja
ce
te
oc
p
no
dé
se
Température moyenne de surface °C Température moyenne de l'air °C
Vitesse moyenne du vent m/s
Figure 5 : relation between wind speed and the temperatures of sea and air (1965-1983)
Source: According to FREON, 1986
The temperatures of sea surface and the air evolve both except during the month of August.
Two cold and warm marine seasons can distinguish themselves. They result essentially from
movements of the oceanic masses on the coast. The cold season stretches from November
until May. The warm season extends between June and October over the harbor domain.
When the temperatures (sea and air) increase, the wind speed becomes low in the place. The
winds importance comes along with a decrease of the surface temperatures and with the air.
The wind circulation influences the direction of sea currents. They perturb the state of the
water stretch during the end of the cold season (in April-May).
II-Rise of the sea level
Tides show the evolution tendency of the marine level, we set as the references observation
from 1907 until 2008. The water heights increased through maxima observed on the last
decade. The level of marine waters began to rise from 1998 on the harbor. The peaks of high
waters are important at1998 but they are especially perceptible in 2007. (cf. Figure 6)
TS04I - Hydrography-Assisted Monitoring 9/18
Vulnerability of Senegal’s South coast: Perspectives with the climate change’s context
Cheikhou Oumar NDIAYE, Senegal, Alioune KANE, Senegal, Violeta PUSCASU, Romania
FIG Conference 2011
Bridging the Gap Between Cultures –
Marrakech, Morocco, 18-22 May 20111,8400
1,8200
1,8000
m
1,7800
1,7600
1,7400
Moyenne annuelle des hauteurs maximales (m)
Moy. mobile sur 4 pér. (Moyenne annuelle des hauteurs
maximales (m))
1,7200
09
12
15
18
21
24
27
30
33
36
39
42
45
48
51
54
57
60
63
66
69
72
75
78
81
84
87
90
93
96
99
02
05
te
da
19
19
19
19
19
19
19
19
19
19
19
19
19
19
19
19
19
19
19
19
19
19
19
19
19
19
19
19
19
19
19
20
20
Figure 6 : Les moyennes annuelles des hauteurs maximales entre 1907 et 2008
Source: D’après données du SHOM, 2008
Between 1907 and 2008, the average level of the middle-tide from in Dakar is 1,003 m
(according to the data of SHOM). The data predicted over 101 years allowed to establish
annual averages, and then they have had a treatment looking for an overall average of the tide
on the chosen scale.
2,20
2,00
1,80
m 1,60
1,40
1,20 Hauteur d'eau maximales (m)
Moy. mobile sur 11 pér.
(Hauteur d'eau maximales (m))
1,00
ja 7
ja 1
ja 5
ja 9
ja 3
ja 7
ja 1
ja 5
ja 9
jan 3
jan 7
jan 1
jan 5
jan 9
ja 3
ja 7
ja 1
ja 5
ja 9
ja 3
ja 7
ja 1
ja 5
ja 9
ja 3
7
-0
-1
-1
-1
-2
-2
-3
-3
-3
-4
4
5
5
5
6
-6
-7
-7
-7
-8
-8
-9
-9
-9
-0
-0
v-
v-
v-
v-
v-
nv
nv
nv
nv
nv
nv
nv
nv
nv
nv
nv
nv
nv
nv
nv
nv
nv
nv
nv
nv
nv
ja
Figure 7 : Evolution of maximal water heights (1907-2008)
Source: According to data of SHOM, 2008
The Figure 7presents the maximal water heights registered on theharbor. She allows noting
the appearance of high tides between 1998 and 2008. The maximal rises of marine waters
became more marked during this previously mentioned period. Year 2007 allowed to observe
peaks in the observations on the maximal water heights.
The circle placed on the figure underlines the increase of the water heights on the harbor
marine environment. The levels of water stretch variation are marked by a rise of the sea,
which asserts itself since 2005.
TS04I - Hydrography-Assisted Monitoring 10/18
Vulnerability of Senegal’s South coast: Perspectives with the climate change’s context
Cheikhou Oumar NDIAYE, Senegal, Alioune KANE, Senegal, Violeta PUSCASU, Romania
FIG Conference 2011
Bridging the Gap Between Cultures –
Marrakech, Morocco, 18-22 May 2011Besides, the seasonal evolutions of the tide are more raised in comparison to the last decade
of the recorded tides. The waters heights are characterized by seasons of very important high
waters between June and October. Between January and March, tides are also high, but they
do not overtake almost 1,85 m.
2,00
1,95
1,90
1,85
1,80
m 1,75
1,70
1,65
1,60
2008
2007
1,55
2006
2005
1,50
janvier février mars avril mai juin juillet août septembre octobre novembre décembre
Figure 8 : Evolution of maximal heights (2005-2008)
Source: According to data of Shom, 2008
The Figure 8 presents the seasonal evolution of the tides’ maxima on the harbor of Dakar. The
distances between maxima can vary 15 even 20 cms over one year of observation (as year
2008).
Indeed, during 2007 the maximal tides got closer to 2 m. The distances between the seasonal
heights can vary from 9 cms to 10 cms. The seasonal heights of water evolved a lot, and they
became very important.
III. Hydrodynamic and vulnerability of shoreline harbor
The vulnerability of the coast due to climate change depends on phenomena of the sea’s
overhang. The low coast is sensitive middles to the marine rise.
The urban zones are generally localized along the coast. Considerable lands losses and
important floods according to the topography of the middle can affect them. However, the
overhang of the sea leads problems of floods or vulnerability for several cities and
installations situated along the harbor coast.
Indeed, the industrial units and the housing environments located on Hann Bel Air, Thiaroye
sur mer and Mbao are subjected to the impacts of the sea level increase. The consequences on
the environment are multiple, and we can hold floods and strong coastal erosions without
quoting the damages of the coastal arrangements and the controls improvements.
TS04I - Hydrography-Assisted Monitoring 11/18
Vulnerability of Senegal’s South coast: Perspectives with the climate change’s context
Cheikhou Oumar NDIAYE, Senegal, Alioune KANE, Senegal, Violeta PUSCASU, Romania
FIG Conference 2011
Bridging the Gap Between Cultures –
Marrakech, Morocco, 18-22 May 2011TS04I - Hydrography-Assisted Monitoring 12/18 Vulnerability of Senegal’s South coast: Perspectives with the climate change’s context Cheikhou Oumar NDIAYE, Senegal, Alioune KANE, Senegal, Violeta PUSCASU, Romania FIG Conference 2011 Bridging the Gap Between Cultures – Marrakech, Morocco, 18-22 May 2011
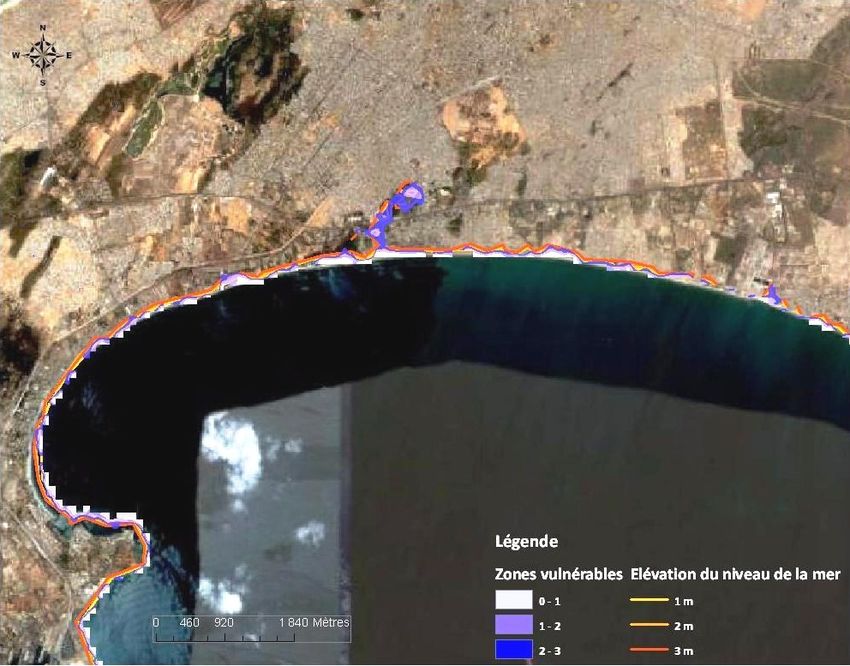
Figure 9 : Vulnérables zones to the sea level rise

TS04I - Hydrography-Assisted Monitoring                                                     13/18
Vulnerability of Senegal’s South coast: Perspectives with the climate change’s context
Cheikhou Oumar NDIAYE, Senegal, Alioune KANE, Senegal, Violeta PUSCASU, Romania

FIG Conference 2011
Bridging the Gap Between Cultures –
Marrakech, Morocco, 18-22 May 2011
The harbor coast is marked by coastal spaces with low topography such as the bay(berry) of
Hann (cf. Figure 9). The effects of 1 m rise besides the current marine level lead important
socioeconomic impacts on the coastal harbor domain. Housing environments and industrial
units situated on the middle will be exposed to the influence of marine waters.
Indeed, the bay of Hann constitutes a sector where the topography is not high enough. The
waters limits in high tides are close to houses situated near of Hann Plage. The se level rise
will induce inevitably a strong vulnerability of the zone. The Figure 10 allows to note the
potential impacts of the sea overhang on the harbor coast. In high tide, marine waters get
closer to houses situated in front of the bay. The risks of erosion are important, they concern
generally the bay of Hann, the sector of Thiaroye and the zone of Rufisque to Bargny.

            Maison à
            Hann Plage                                           Fabrique de glaces
                                                                 à Thiaroye

                   Secteur balayé                                Secteur balayé
                   par la marée                                  par la marée

                    Figure 10 : Vulnerables places to the sea overhang
The sea rise of 5 m involves a sea overhang that can cut the Boulevard du Centenaire of the
municipality of Dakar. Marine waters will occupy the industries in the bay of Hann, and
houses are threatened or flooded by the sea.
In 9 m sea rising, the major part of the peninsula of the Cap Vert will be under waters. The
tombolo of Dakar maybe invaded by the sea and the peninsula risks to be besides cut by the
continent. Nevertheless, the places where the topography is rather high like Yoff and the
Plateau are certainly sheltered from the seawaters rise.

Analysis and discussion
The peninsula of the Cap Vert registers the emergence of several arrangements to modernize
the middle. The city of Dakar develops inward absorbing peripheral zones until Rufisque (cf.
Figure 11). The arrangements line the coast and they put challenges of management effective
of the urban space.

TS number – Session title e.g. TS 1A – Standards, and paper no                            14/18
Author’s name(s) e.g. William Smith and Jane Jones
Title of paper e.g. The First Paper of the FIG Congress 2011

FIG Working Week 2011
Bridging the Gap between Cultures
Marrakech, Morocco, 18-22 May 2011
Figure 11 : les villes portuaires vulnérables à l’avancée de la mer The activities have for point of departure the Plateau, and then they became diversify around the harbor and along the coast. The topographyof this place is low, the effects of the sea level rise can have direct incidents on the stability of the infrastructures. The middle is confronted to the problems of erosion and the sea remains threatening. Through scenarios, the evolution of the coast can be perceived, but it remains limited because of the prediction. Scenarios5 were established to follow the evolution of the water stretch subjected to the effects of the climate change. They rest on certain hypotheses which allow to feign the heights of water by taking coast of rise which will be added a year until approximately 2050. Therefore, the absence of an accessible database on the hydrodynamics conditions does not allow making precise simulations of the rise of the marine level. The research carried in the south part of the Dakar’s region showed a increase rate of the relative sea level by 1,4 mm/year between 1943 and 1965 (NIANG DIOP I. (1995). L’érosion côtière sur la petite côte du Sénégal à partir de l’exemple de Rufisque, thèse 3ème cycle, Université d’Angers, 477p.). The study did not make corrections on the tidals data due to the lack of exhaustive information. It bases itself on scenarios that concern several hypotheses of increase of marine level. The scenarios of sea level rise are made on the data of the middle-tide of the harbor’s water stretch of. The average of the middle-tide between 1907 and 2008 is used to make the 5 A scenario constitutes an approach integrating a series of hypotheses which allows to describe the future state of the marine environment. TS number – Session title e.g. TS 1A – Standards, and paper no 15/18 Author’s name(s) e.g. William Smith and Jane Jones Title of paper e.g. The First Paper of the FIG Congress 2011 FIG Working Week 2011 Bridging the Gap between Cultures Marrakech, Morocco, 18-22 May 2011
scenarios of increase of the heights of water until 2050. Three scenarios of rises of the marine
level taken are: 0,01 m, 0,1 m and 0,2 m.
10
9
8
7
6
m
5
4
3 0,01m
0,1m
0,2m
2
1
0
08
10
12
14
16
18
20
22
24
26
28
30
32
34
36
38
40
42
44
46
48
50
20
20
20
20
20
20
20
20
20
20
20
20
20
20
20
20
20
20
20
20
20
20
Figure 12 : Scenarios of sea level rise
The sea level rise is doubtless a slow process. It is often in the order of some millimeters per
year. The scenarios are modes of forecasts, but they cannot be real on the studied environment
because based on hypotheses.
The Figure 12 presents three (03) scenarios of sea level rise for the harbor domain. The
average data of the middle-tide accompany the projected treatment. The height of 1,00261175
m is obtained by making the average of the annual heights into the definite period (since 1907
to 2008) .Une rise of 0,01 m / year gives a waters height than gets closer to 2 m. When a rise
of 0,2 m / year occurs, the waters heights will go to 9 m. They induice a vulnerability of the
peninsula of the Cap Vert.
Besides, the evaluation of the potential risks can be perceptible only by the basis of modelling
application for the functioning of marine waters. It is also relevant within the framework of
the increase of the current marine level to make projected models of the functioning of the
marine environment.
5. CONCLUSION
The climate changes induice several disturbances on the marine environment. They are
perceptible into the functioning or on the rise of the long-term marine level. Even if the rise is
slow, in order of some millimeters per year, the shoreline spaces are vulnerable to the climate
changes having direct effects on the marine environment.
The sea level rise places the low zones such as the bay of Hann as a vulnerable sector. It leads
a big fragility of the harbor coast. The sea advances gradually on the continent, and marine
waters threaten the industrial, harbor installations and the housing environments. The losses
TS number – Session title e.g. TS 1A – Standards, and paper no 16/18
Author’s name(s) e.g. William Smith and Jane Jones
Title of paper e.g. The First Paper of the FIG Congress 2011
FIG Working Week 2011
Bridging the Gap between Cultures
Marrakech, Morocco, 18-22 May 2011of lands due to an activity of the sea risk affecting the coast within the framework of the
increase of the marine level.
A good knowledge of the phenomena participates into the implementation of projected
models for the coast. It asserts himself like bases of information on the shoreline spaces in
connection with the variability of the marine environment. These aspects remain fundamental
even if they are limited because based on theories. However, they supply appreciations on the
evolution of the middle and the choice on the coastal infrastructures.
The zones that have fewer resources have the most low capacity of adaptation, and they are
the most vulnerable in the effects of the climate change. The climatic impacts on the harbor
coast are multiple, but the only option of the sea level rise causes several marigolds on the
future of the coastal cities.
Bibliographie
1. ANSD (2006). RGPH 3 – Rapport national de présentation des résultats. on line
2. BCEOM (2007). Etude de faisabilité pour l’aménagement d’un chenal d’accès au 3ème
poste à quai dragué à -13,00 m pour navires porte-conteneurs, Etude d’impacts
environnementaux, version provisoire.
3. BENGA A. G. F. (2006). Potentiels et productions Anadara senilis dans la réserve de
biosphère du delta du Saloum perspectives d’exploitation rationnelle, thèse doctorat
3ème cycle, UCAD, 371p.
4. CNUEH, IAGU, PGU (1997). Communauté Urbaine de Dakar, Programme « Dakar,
ville durable », rapport principal plans d’actions : Développement durable de la Baie
de Hann Gestion intégrée des risques industriels.
5. DIAW A. T. et al. (1993). Gestion des ressources côtières et littorales du Sénégal :
Actes des ateliers de Gorée 27-29 juillet 1992, UICN, Gland, Suisse, +484p.
6. DIENG S. (2004). Le port de Dakar : pour une meilleure prise en compte de la
spécificité pêche, mémoire de fin d’études, CESAG, 54p.
7. DIOP S. (1990). La côte Ouest africaine du Saloum à la Mellacorée, édition
ORSTOM, thèse de doctorat, Paris, 366p. on line
8. DPS (2005). Estimation de la population du Sénégal en 2004, 20p.
9. DURAND M. H. et al (1998). Global versus local changes in upwelling systems,
éditions ORSTOM, Paris, 608p. on line
10. FAURE H., FAURE L., DIOP E.S. (1986). Changements globaux en Afrique durant le
Quaternaire, passé présent futur, Symposium International INQUA-ASEQUA Dakar,
21-28 Avril 1986, édition ORSTOM, collection travaux et documents n° 197, Paris,
485p. on line
11. FREON P. (1986). Réponse et adaptation des stocks de cupleides d’Afrique de l’Ouest
à la variable du milieu et de l’exploitation analyse et réflexion à partir du Sénégal,
thèse doctorat 3ème cycle, université d’Aix Marseille, 287p. on line
12. GAMBLIN A. (sous la direction) (1998). Les littoraux espaces de vies, dossier 23,
Dossiers des Images Economiques du Monde, édition SEDES, 368p.
13. KANE B. S. et MBAYE M. (2004). Le Développement durable à l’échelle du
territoire : le cas de la baie de Hann, papier de recherche du cours de développement
durable, D.E.S.S., ENEA, 26p. En ligne
TS number – Session title e.g. TS 1A – Standards, and paper no 17/18
Author’s name(s) e.g. William Smith and Jane Jones
Title of paper e.g. The First Paper of the FIG Congress 2011
FIG Working Week 2011
Bridging the Gap between Cultures
Marrakech, Morocco, 18-22 May 201114. NDIAYE C. O. (2007). Pollution du littoral par les activités du Port Autonome de
Dakar, mémoire de maîtrise, UGB, 131p. En ligne
15. NDIAYE K. (2003). La problématique de manutention des produits dangereux au
Port Autonome de Dakar, mémoire maîtrise, UGB, 138p.
16. NDIAYE K. (2004). La pollution du littoral : la qualité de l’eau du Port Autonome de
Dakar, mémoire DEA, UCAD, 77p.
17. NIANG DIOP I. (1995). L’érosion côtière sur la petite côte du Sénégal à partir de
l’exemple de Rufisque, thèse 3ème cycle, Université d’Angers, 477p.
18. NONN H. (1972). Géographie des littoraux, PUF, 238p.
19. PASKOFF R. (1993). Côte en danger, pratique de la géographie, Masson, Paris,
+247p.
20. PNUE (2000). Les mers régionales une stratégie de survie pour nos océans et nos
côtes.
21. SRSD / Dakar (2006). Situation économique et sociale 2005 Région de Dakar.
22. TURMINE V. (2000). Dynamique littorale entre Mbour et Joal (Petite côte Sénégal),
mémoire de maîtrise, université Paris VII, 249p.
23. UNEP(DEC)/WAF/CP.7/6/F 14 Février 2005. Septième rencontre des parties
contractantes à la convention relative a la coopération en matière de protection et
mise en valeur du milieu marin et côtier de la région ouest africaine, Gabon,
Libreville, 22-23 mars 2005, 19p.
24. UNEP/GPA/IGR.2/4. Réunion intergouvernementale chargée d’examiner la mise en
œuvre du Programme d’action mondial pour la protection du milieu marin contre la
pollution due aux activités terrestres, Deuxième réunion, Beijing, 16-20 octobre 2006,
17p.
CONTACTS
Prof. Dr. VIOLETA PUSCASU
University Dunarea de Jos
Domneasca street, 111, 800201
Galati
ROMANIA
Tel. +40.723.192.324
Fax + 40.336.430.467
Email: violeta.puscasu@ugal.ro
Web site:
TS number – Session title e.g. TS 1A – Standards, and paper no 18/18
Author’s name(s) e.g. William Smith and Jane Jones
Title of paper e.g. The First Paper of the FIG Congress 2011
FIG Working Week 2011
Bridging the Gap between Cultures
Marrakech, Morocco, 18-22 May 2011You can also read