2021 State of High Tide Flooding and Annual Outlook
←
→
Page content transcription
If your browser does not render page correctly, please read the page content below
NOAA High Tide Flooding Report
2021 State of High Tide Flooding and
Annual Outlook
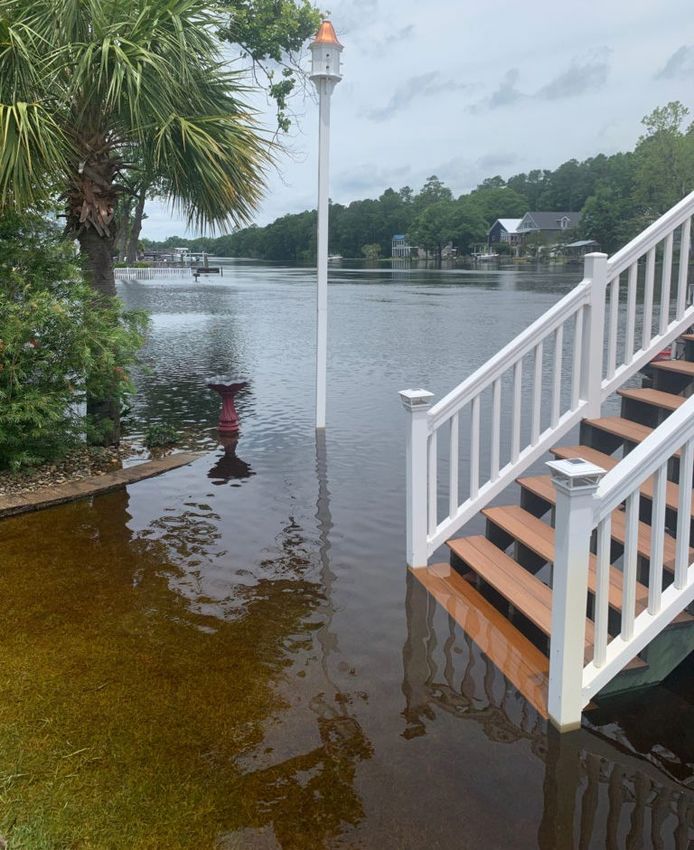
Myrtle Beach, South Carolina. Photo Credit: mycoast.org
Silver Spring, Maryland
July 2021
noaa National Oceanic and Atmospheric Administration
U.S. DEPARTMENT OF COMMERCE
National Ocean Service
Center for Operational Oceanographic Products and Services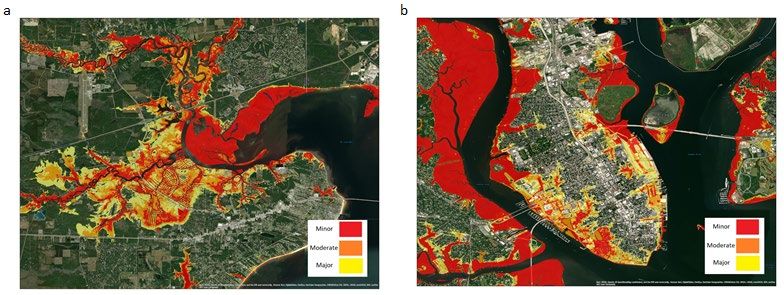
Center for Operational Oceanographic Products and Services
                            National Ocean Service
              National Oceanic and Atmospheric Administration
                        U.S. Department of Commerce

The National Ocean Service (NOS) Center for Operational Oceanographic Products and Services
(CO-OPS) provides the National infrastructure, science, and technical expertise to collect and
distribute observations and predictions of water levels and currents to ensure safe, efficient and
environmentally sound maritime commerce. The Center provides the set of water level and tidal
current products required to support NOS’ Strategic Plan mission requirements, and to assist in
providing operational oceanographic data/products required by NOAA’s other Strategic Plan
themes. For example, CO-OPS provides data and products required by the National Weather
Service to meet its flood and tsunami warning responsibilities. The Center manages the National
Water Level Observation Network (NWLON), a national network of Physical Oceanographic
Real-Time Systems (PORTS®) in major U. S. harbors, and the National Current Observation
Program consisting of current surveys in near shore and coastal areas utilizing bottom mounted
platforms, subsurface buoys, horizontal sensors and quick response real time buoys. The Center:
establishes standards for the collection and processing of water level and current data; collects
and documents user requirements, which serve as the foundation for all resulting program
activities; designs new and/or improved oceanographic observing systems; designs software to
improve CO-OPS’ data processing capabilities; maintains and operates oceanographic observing
systems; performs operational data analysis/quality control; and produces/disseminates
oceanographic products.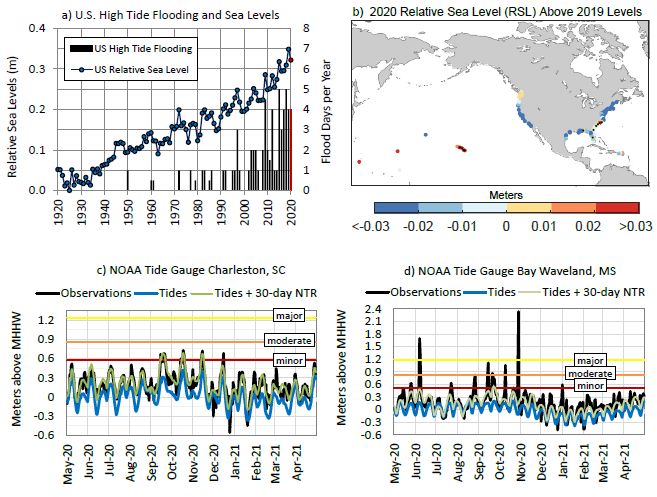
NOAA High Tide Flooding Report

2021 State of High Tide Flooding and
Annual Outlook

William Sweet
Steven Simon
Gregory Dusek
Doug Marcy
William Brooks
Matt Pendleton
John Marra

July 2021

U.S. DEPARTMENT OF COMMERCE
Gina Raimondo, Secretary
National Oceanic and Atmospheric Administration
Dr. Richard Spinrad, Under Secretary of Commerce for Oceans and Atmosphere
National Ocean Service
Nicole LeBoeuf, Acting Assistant Administrator
Center for Operational Oceanographic Products and Services
Richard Edwing, Director
NOTICE

Mention of a commercial company or product does not constitute an endorsement by
NOAA. Use of information from this publication for publicity or advertising purposes
concerning proprietary products or the tests of such products is not authorized.
TABLE OF CONTENTS
TABLE OF CONTENTS ......................................................................................................................................... III
LIST OF FIGURES .................................................................................................................................................. III
EXECUTIVE SUMMARY ........................................................................................................................................ V
1.      INTRODUCTION .............................................................................................................................................. 1
2.      2020 CONDITIONS ...........................................................................................................................................3
3.      2021 HIGH TIDE FLOOD OUTLOOK .......................................................................................................... 7
4.      SUMMARY ........................................................................................................................................................ 9
5.      ACKNOWLEDGEMENTS .............................................................................................................................11
6.      DATA AVAILABILITY..................................................................................................................................11
7.      REFERENCES .................................................................................................................................................11
APPENDIX 1. ............................................................................................................................................................13
ACRONYMS..............................................................................................................................................................20

                                                                LIST OF FIGURES
Figure 1. Map for minor (red), moderate (orange) and major (yellow) HTF layers for a)
          Bay Waveland, Miss. and b) Charleston, S.C. mapped by the same methods as
          NOAA’s Sea Level Rise Viewer. Red is used for the minor HTF layer since it will
          be flooded under all three HTF categories. ................................................................1
Figure 2. a) Median HTFs per year (black bars) from 1920–2020 with the annual-median
          rise in RSL (blue line). 2020 sea level and flood frequency values are shown in
          red. In b) are the individual tide gauge locations showing the difference in RSLs
          between 2019 and 2020 with black dots denoting those that broke historical RSL
          records in 2020. In c) is a time series of 2020 daily highest water level
          observations (black line), the tide component only inherent to the observations
          (blue line) and a combined tide and 30-day lowpass filtered nontidal residual
          (green line) time series at the NOAA tide gauge in c) Charleston, S.C. and d) Bay
          Waveland, Miss. with the minor (red), moderate (orange) and major (yellow)
          HTF height thresholds. .................................................................................................4
Figure 3. Number of days with HTF in 2020 at 97 NOAA tide gauge locations with values
          listed in Appendix 1. Black dots identify locations where HTF did not occur
          during 2020. ...................................................................................................................5
Figure 4. a) Histogram of daily highest water levels and b) exceedance probability for 2020
          water levels at Charleston and Honolulu showing the HTF thresholds (red
          vertical lines) at both locations. ...................................................................................6
Figure 5. a) Locations where HTF in 2020 either tied or broke all-time records, b) the
          percent increase in 2020 HTF days as compared to trend values for year 2000 or

                                                                                   iii
climatological average where no temporal trends exist. Also shown are days with
HTF in 2020 that also reached c) moderate and d) major flood stage. ....................7
Figure 6. Statistical model type used in the 2021 Outlook showing a) where either a linear
or quadratic trend (black dots represent no temporal trend and a 19-yr
climatological mean is used as the outlook) and b) if the model fit (e.g., as shown
in panel a) includes sensitivity to ENSO; where no temporal trend exists, an
ENSO dependency may still exist (e.g., West Coast locations). ................................8
Figure 7. Outlook for the number of HTF days projected to occur in 2021 (May 2021–April
2022) with color-codes associated with the ‘expected’ value, whereas the actual
outlooks are given as a likely range (expected value ±1 standard deviation
provided in Appendix 1). ..............................................................................................9
ivEXECUTIVE SUMMARY
One of the most tangible signs of sea level rise is the increased frequency of high tide flooding
(HTF) occurring along the U.S. coastlines. HTF impacts coastal infrastructure and natural
systems (e.g., flooding of storm and wastewater systems, roadways, commercial/private
property, sandy beaches, and marshes) and typically begins when water levels exceed about
0.5 meter (1.75 feet) above high tide as measured by the National Oceanic and Atmospheric
Administration (NOAA) tide gauges. HTF levels are nationally calibrated against NOAA’s
National Weather Service and local emergency managers’ depth-severity thresholds used in
weather forecasting and impact communications to provide a consistent coastal-climate
resiliency standard. HTF damages infrastructure and creates other economic and ecosystem
impacts within coastal communities, which are largely responsible for finding and funding
mitigative solutions.
NOAA’s National Ocean Service provides annual reports (this is the seventh of an annual
series 1) tracking historical HTF frequency changes, mapping current exposure footprints, and
providing next-year outlooks and multi-decadal projections of flood frequency changes. Decadal
projections are based upon a range of relative sea level (RSL) rise considered more likely to
occur based upon the Fourth U.S National Climate Assessment. 2 These reports are designed to
inform the public of the accelerating upward trajectory of climate-driven coastal flooding, and
support partners and coastal communities as they plan and make decisions regarding increasingly
disruptive and expensive impacts.
In 2020 (May 2020–April 2021), U.S. coastlines continued to experience HTF at a rate
(4 days/year—national median) that is twice what it was just 20 years ago. In total, 14 locations
tied or broke HTF records along the U.S. Southeast Atlantic and Gulf coastlines due to a
combination of effects from a record-breaking hurricane season and/or continued RSL rise (12
locations tied/set records for RSL levels). For perspective, as compared to HTF frequencies
typical in 2000, these regions experienced a (median values) 400–1100% increase in 2020 (e.g.,
14 and 22 days for Charleston, S.C. and Bay Waveland, Miss. in 2020 versus 2 and 3 days in
2000, respectively). Over 80% of East and Gulf Coast tide gauge locations are now experiencing
annual acceleration (nonlinear rise) in HTF frequencies with most others linearly increasing.
For 2021 (May 2021–April 2022), continued acceleration in HTF and its impacts are expected
with 3–7 days (national median) of HTF likely under near-neutral conditions of the El Niño
Southern Oscillation. The 2021 HTF Outlook is 7–15 days along the Western Gulf, 6–11 days
along the Northeast Atlantic, 3–7 days along the Southeast Atlantic and Eastern Gulf, and
upwards of 3 and 7 days along the Southwestern and Northwestern Pacific, respectively. No HTF
is likely along Hawaii or the U.S. Pacific or Caribbean coastlines. That said, this outlook does
not discount that local flooding might occur at water levels less than the HTF height threshold
used here, and it does not explicitly account for wave, rainfall, and elevated groundwater effects.
By 2030, the national median HTF frequency rate is likely to increase about 2–3 times (7–15
1
An interactive map of this year’s results is available at
https://tidesandcurrents.noaa.gov/HighTideFlooding_AnnualOutlook.html
2
https://nca2018.globalchange.gov/chapter/appendix-3/
vdays) without further adaptation measures; by 2050, it is likely to increase 5–15 times higher
(25–75 days). In addition to minor flooding events, moderate and major HTF (starting at about
0.8 meter and 1.2 meters [2.75 feet and 4 feet] above high tide), which trigger coastal flood
warnings for significant risks to life and property, will become much more commonplace as we
approach mid-century.
vi1. INTRODUCTION
Tide gauge observations of the National Oceanic and Atmospheric Administration (NOAA)
National Ocean Service (NOS) along the U.S. coastline are used traditionally to define our
nautical boundaries, facilitate safe and effective maritime commerce, establish tidal datums
critical to coastal mapping and engineering, and support emergency response preparedness.
NOAA’s tide gauge data is now increasingly important to achieve coastal resilience through
planning for impacts from relative sea level (RSL) rise. Paired with NOAA coastal flood
thresholds for local impacts, NOAA tide gauges are documenting a rapid growth in coastal
flooding occurring within many U.S. coastal communities (Sweet et al., 2014). Flooding that
decades ago happened only during a severe storm can now occur during a full-moon tide or with
a change in prevailing winds or currents. Such high tide flooding (HTF) is becoming common
and causing concerns within U.S. coastal communities.
HTF begins when coastal water levels exceed about 0.5 m (about 1.75 ft) above the mean higher
high water (MHHW) level. At these levels, HTF impacts are typically more minor, with deeper
and more severe moderate and major HTF occurring about 0.8 m and 1.2 m (about 2.75 ft and 4 ft)
above MHHW, respectively. 3 Site-specific HTF height-severity thresholds vary by a location’s
tide range (Sweet et al., 2018), which facilitates mapping of potential exposure to these flood
categories using NOAA’s VDatum model (https://vdatum.noaa.gov/) and best available elevation
data provided by NOAA’s Digital Coast (Figure 1).
Figure 1. Map for minor (red), moderate (orange) and major (yellow) HTF layers for a) Bay Waveland, Miss. and
b) Charleston, S.C. mapped by the same methods as NOAA’s Sea Level Rise Viewer. 4 Red is used for the minor
HTF layer since it will be flooded under all three HTF categories.
The HTF height-severity thresholds are calibrated to those of NOAA’s National Weather Service
(NWS) Weather Forecasting Offices and on-the-ground local emergency managers, which are
the official thresholds used to communicate imminent flood impacts in weather forecasting and
3
HTF counts exceeding the minor threshold will also include more severe events; so, although most events are
likely less severe, more substantial surge events (e.g., from tropical cyclones or nor’easters) will also be captured.
4
https://coast.noaa.gov/data/digitalcoast/pdf/slr-high-tide-flooding.pdf
1communications (NOAA, 2020). However, the NWS coastal flood thresholds are typically
representative for only a particular area and do not exist at all U.S. coastal locations. Therefore,
the HTF thresholds, which are a best-fit solution (via linear regression) of the NWS thresholds
with tide range, are used to provide a nationally consistent method to define infrastructure
vulnerabilities for coastal-climate resilience purposes (Sweet et al., 2018). As such, there are
some locations (e.g., the Florida Keys; Honolulu, Hawaii) that might experience minor flooding
at heights below the local HTF threshold, and conversely, there are some locations that may not
experience flooding (e.g., directly behind the seawalls in St. Petersburg, Fla. or Galveston, Tex.)
but still experience subsurface impacts like storm-water infiltration or overland flooding impacts
further up- or down-coast.
This past year, there were numerous media reports concerned with RSL rise and impacts ranging
from threatening ecosystems 5 to taxpayer-supported mortgages. 6 These media reports add to the
growing list of concerns documented over the last several years about the degradation and under-
capacity of storm and wastewater systems, as well as flooding of properties, roadways, and
businesses—affecting real-estate prices and disrupting commutes and commerce. There were
also some exciting advances to help us better understand the spatial footprint of flooding used to
calibrate community-scale models for smart planning using citizen science observations. 7
This report is the seventh in an annual series to assess HTF that occurred last year to raise
awareness of the growing impact of RSL rise. It also is to inform decision-making about what to
expect, not only next year (e.g., budgeting and allocating for necessary coastal flood responses)
but over the longer term (e.g., major infrastructure upgrades and land-use planning) to ensure
resilience to sea level rise impacts. Specifically, this report provides an assessment of HTF that
occurred in 2020 (May 2020–April 2021) and for the first time, further distinguishes HTF into
minor, moderate, and major categories. 8 This report also maps select locations’ exposure from
minor, moderate, and major HTF and provides a 2021 (May 2021–April 2022) HTF outlook
based upon temporal trends and predicted strength of the El Niño-Southern Oscillation (ENSO).
Note: the outlook predicts flooding only at or above the minor threshold. This report and
accompanying NOAA website 9 also continue to provide projections of HTF by Sweet et al.
(2018) based upon the range of RSL rise likely (Intermediate Low to Intermediate Scenarios) to
occur by 2030 and 2050 using projections of Sweet et al. (2017) adopted by the Fourth National
Climate Assessment.
5
https://theconversation.com/sea-level-rise-is-killing-trees-along-the-atlantic-coast-creating-ghost-forests-that-are-
visible-from-space-147971
6
https://www.politico.com/news/2020/11/30/climate-change-mortgage-housing-environment-433721
7
https://www.theatlantic.com/science/archive/2020/11/predicting-floods-before-strike/617208/
8
Data available at https://tidesandcurrents.noaa.gov/api-helper/url-generator.html
9
https://tidesandcurrents.noaa.gov/HighTideFlooding_AnnualOutlook.html
22. 2020 CONDITIONS
During 2020 (May 2020–April 2021), La Niña conditions prevailed (average Oceanic Niño
Index [ONI] value of -0.79 10) and the U.S. Atlantic experienced a record-setting hurricane
season. 11 There were 30 named storms (with top winds of 39 mph or greater) and 12 landfalling
storms mostly impacting the Gulf and Southeast Atlantic Coasts. The national (median) number
of days with HTF was 4 (Figure 2a), which matches 2019 as the second highest on record. This
continued the upward accelerating trend and was within range of last year’s outlook (2–6 days;
Sweet et al., 2020). Though occurrences of moderate and major HTF are also becoming more
likely due to continued RSL rise—some locations set a few records in 2020 (see below)—their
national (median value) frequencies are still less than once per year.
Relative sea levels in 2020 were slightly lower than in 2019 as a whole (median difference of
~2.5 cm); however, they were still elevated and attained the second highest level on record with
almost 0.3 m (1 ft) rise in the last 100 years (linear trend of 2.7 mm/yr). When viewed regionally
and locally (Figure 2b), RSL was slightly lower along most U.S. coasts, which at least along the
West Coast was likely in response to La Niña conditions that lower sea levels. There were 12
locations that did, however, break or tie RSL records including locations along the Southeast
Atlantic, Eastern Gulf, and along the Hawaiian and Pacific Islands. Though not record-setting,
RSLs in 2020 were slightly elevated as compared to 2019 along the Northwest Pacific.
Closer inspection of two locations—Charleston, S.C. and Bay Waveland, Miss.—help illustrate
the nature of processes contributing to HTF during 2020 (Figure 2c-d). Both locations were
exposed to a varying degree of tropical cyclones, though the storm tracks were generally
offshore in the case of Charleston and regionally onshore for the case of Bay Waveland. 12 Both
locations set HTF records in 2020 (14 days and 22 days, respectively) and Charleston had
record-setting RSLs. Charleston’s HTF record was almost completely in response to monthly-
scale RSL variability that lifted the astronomical tides above the HTF/minor flood threshold
(Figure 2c, green line). On the other hand, of the 22 HTF days at Bay Waveland (Figure 2d),
nearly all were due to short-period storm surges, which caused moderate (10 days—broke
record) and major (3 days) HTF.
10
https://origin.cpc.ncep.noaa.gov/products/analysis_monitoring/ensostuff/ONI_v5.php
11
https://www.noaa.gov/media-release/record-breaking-atlantic-hurricane-season-draws-to-end
12
https://www.nhc.noaa.gov/tafb_latest/tws_atl_latest.gif
3Figure 2. a) Median HTFs per year (black bars) from 1920–2020 with the annual-median rise in RSL (blue line).
2020 sea level and flood frequency values are shown in red. In b) are the individual tide gauge locations showing
the difference in RSLs between 2019 and 2020 with black dots denoting those that broke historical RSL records
in 2020. In c) is a time series of 2020 daily highest water level observations (black line), the tide component only
inherent to the observations (blue line) and a combined tide and 30-day lowpass filtered nontidal residual (green
line) time series at the NOAA tide gauge in c) Charleston, S.C. and d) Bay Waveland, Miss. with the minor (red),
moderate (orange) and major (yellow) HTF height thresholds.
Along U.S. coastlines (Figure 3), HTF occurred the most along the Western Gulf (17 days,
median value) and to a lesser extent, along the Eastern Gulf and Southeast Atlantic Coasts
(9 days and 8 days), respectively, related to a combination of high tropical cyclone activity and
continued RSL rise. The Northeast Atlantic experienced 6 days (median value) of flooding, and
RSLs were generally lower in 2020 relative to 2019 (Figure 2b). No HTF occurred along the
Southwest Coast likely due to suppressed RSLs and a northward shift in storm track related to
higher near-surface pressures over the Eastern North Pacific due to La Niña conditions (personal
communication with Martin Hoerling with NOAA Physical Sciences Laboratory) that
contributed to 3 HTF days along the Northwest Pacific. In terms of how observed 2020 HTF
days related to the 2020 outlook produced last year (Sweet et al., 2020), most fell within the
outlook range (61 locations), with 15 locations below the 2020 outlook (mainly along the
Northeast Atlantic and Southwest Pacific) and 20 locations above the outlook (along the
Southeast Atlantic and Gulf Coasts).
4Figure 3. Number of days with HTF in 2020 at 97 NOAA tide gauge locations with values listed in Appendix 1.
Black dots identify locations where HTF did not occur during 2020.
Although the Hawaiian Islands hit record RSLs in 2020, no HTF occurred. However, Honolulu
experienced more than 45 days when water levels exceeded 0.3 m above MHHW with some
local impacts (Habel et al., 2020). The lack of HTF occurrences can be explained in terms of the
height of the HTF threshold itself (>0.5 m MHHW) and the fact that Hawaii experiences less
overall observed storm-tide variability as compared to a location with a wider and shallower
continental shelf, as is found along the Atlantic or Gulf Coasts. Of note, the HTF statistics and
outlooks are based upon tide gauge measurements, which generally do not account for wave
effects (Sweet et al., 2015). A comparison of daily highest water levels at Honolulu and
Charleston during 2020 (Figure 4a) shows higher variability at Charleston, which together with
higher RSL rates over the last two decades 13 explains the difference in recorded HTF days in
2020 (Figure 4b). Though there were reports of coastal flooding in Honolulu during 2020
primarily related to wave runup effects, 14 rising seas and rising groundwater tables are posing a
13
https://tidesandcurrents.noaa.gov/sltrends/sltrends.html
14
https://www.staradvertiser.com/2020/07/24/breaking-news/king-tide-takes-out-waikiki-lifeguard-tower/
5host of other subsurface problems such as wastewater and industrial waste contamination. 15 In
general, places with a small range in storm-tides will quickly transition from little overland
flooding to chronic flooding as sea levels rise, as would be the case for Honolulu with about
20 cm of additional RSL rise above 2020 levels (Figure 4b).
Figure 4. a) Histogram of daily highest water levels and b) exceedance probability for 2020 water levels at
Charleston and Honolulu showing the HTF thresholds (red vertical lines) at both locations.
In all, 14 locations broke or tied historical HTF records along the Southeast and Gulf Coasts
(Figure 5a) related to high tropical cyclone activity and in some locations, elevated RSLs. HTF
records occurred in Galveston, Corpus Christi, and Bay Waveland (>20 days); Dauphin Island,
Grand Isle, Pensacola, Trident Pier, Charleston, Port Isabel, Rockport, and Panama City Beach
(10–20 days); and Panama City, Fernandina Beach, and Mayport (8–9 days). Compared to trend
HTF values in year 2000 (e.g., based upon a trend fit or 19-year average), 2020 was a notable
year along the Southeast Atlantic (400% median increase), the Eastern Gulf (600% increase),
and the Western Gulf (1100% increase) as illustrated in Figure 5b. In some instances and
locations, HTF days actually caused (and are also categorized as) moderate and major HTF
(Figures 5c–d) mostly along the Southeast Atlantic and Gulf Coast associated with tropical
cyclone activity. The highest number of days with moderate HTF, which also set historical
records, occurred in Bay Waveland, Corpus Christi, Galveston, and Eagle Point (5–10 days); of
these, major flood thresholds were surpassed on 1–3 days except at Eagle Point, where no major
HTF occurred. Exposure associated with the various HTF depth-severity categories is illustrated
for Bay Waveland and Charleston in Figure 1.
15
https://www.hakaimagazine.com/features/the-rising-tide-underfoot/
6Figure 5. a) Locations where HTF in 2020 either tied or broke all-time records, b) the percent increase in 2020
HTF days as compared to trend values for year 2000 or climatological average where no temporal trends exist.
Also shown are days with HTF in 2020 that also reached c) moderate and d) major flood stage.
3. 2021 HIGH TIDE FLOOD OUTLOOK
The basis for the 2021 HTF Outlook, similar to the past outlooks, uses annual counts of HTF
days since 1950 through the most recent year (2020 for this report). These data are fit using
either a quadratic or linear regression (significance above the 90% level, p valuesthe Pacific Islands. This implies that HTF is now accelerating or linearly increasing at all but one
East and Gulf Coast location (Key West) with ENSO affecting flood frequencies along portions
of most U.S. coastlines.
Figure 6. Statistical model type used in the 2021 Outlook showing a) where either a linear or quadratic trend
(black dots represent no temporal trend and a 19-yr climatological mean is used as the outlook) and b) if the
model fit (e.g., as shown in panel a) includes sensitivity to ENSO; where no temporal trend exists, an ENSO
dependency may still exist (e.g., West Coast locations).
In Appendix 1, the 2021 Outlook is the predicted likely range (i.e., ±1 standard deviation) with
the median/expected value shown in Figure 7. As a whole (median value of local ranges), U.S.
coastlines are projected to experience 3–7 days of HTF. Regionally, the Western Gulf and
Northeast Atlantic are projected to experience the most HTF in 2021 (median range values of 7–
15 days and 6–11 HTF days, respectively). The Southeast Atlantic and Eastern Gulf are
projected to experience 3–7 HTF days, with the Northwest and Southwest Pacific projected to
experience 0–7 and 0–3 days, respectively. No HTF days (reaching >0.5 m above MHHW) are
projected for Hawaii, the U.S. Pacific, and Caribbean Islands. Again, failing to exceed the HTF
thresholds used in this report does not necessarily mean flooding will not occur, as flooding can
occur in some places at lower water levels. Since this assessment is based on tide gauge data,
generally it does not include flooding from wave runup effects, elevated groundwater tables, or
localized rainfall.
8Figure 7. Outlook for the number of HTF days projected to occur in 2021 (May 2021–April 2022) with color-
codes associated with the ‘expected’ value, whereas the actual outlooks are given as a likely range (expected
value ±1 standard deviation provided in Appendix 1).
4. SUMMARY
NOAA tide gauges continue to measure an increase in RSL, which is driving greater frequency
of HTF along U.S. coastlines. An individual HTF event typically causes minor impacts, which
are not overly damaging or of lasting concern if viewed as singular events. However, the
cumulative repercussions from rising frequencies and durations of floods are beginning to
damage infrastructure and cause other economic and ecosystem impacts within coastal
communities, which are largely responsible for finding and funding solutions. Thus, HTF is a
growing concern to coastal residents, emergency managers, community planners, and resource
managers alike. NOAA intends to continue providing next-year outlooks and projections for the
coming decades to support both preparedness and planning.
In 2020 (last year: May 2020–April 2021), U.S. coastlines experienced (median value) 4 days of
HTF. The 2020 HTF day count matched that from the year prior (2019) but continues to define
an accelerating trend seen over the last several decades. HTF in 2020 was twice the rate normal
in 2000 (e.g., the median value of all locations’ trend-based values in 2000 was 2 days of HTF).
9HTF in 2020 was most prevalent along the Western Gulf, Eastern Gulf, and Southeast Atlantic
Coasts (17 days, 9 days, and 8 days—median values, respectively), with 14 locations breaking or
tying historic HTF records due to a combination of effects from a record-breaking hurricane
season and rising RSLs. In many locations and instances, the HTF that occurred reached the
moderate and major HTF levels. Twelve locations broke RSL records, including several in the
Southeast Atlantic and the Gulf, but also the Hawaiian Islands coastline, which could be related
to the prevailing La Niña conditions. La Niña conditions typically suppress West Coast RSLs
and HTF, at least along California coastlines, due to a northward shift in regional coastal storm
tracks.
Next year (2021), the acceleration in HTF nationally along U.S. coastlines is expected to
continue, with 3–7 days of HTF likely (median of 5 days ±2 days, which is 1 standard deviation).
The 2021 Outlook by region is listed below:
● 6–11 days along the Northeast Atlantic
● 3–7 days along the Southeast Atlantic
● 0 days along the Caribbean
● 3–7 days along the Eastern Gulf
● 7–15 days along the Western Gulf
● 0–7 days along the Northwest Pacific
● 0–3 days along the Southwest Pacific
● 0 days along the Hawaiian and Pacific Islands
By 2030, the national HTF frequency is likely to be about 2–3 times greater (national median of
7–15 days) than today without additional flood-management efforts. By 2050, HTF is likely to be
5–15 times higher (national median of 25–75 days), and potentially in some locations reaching
nearly 180 days per year, effectively becoming the new high tide. These projections do not
consider future floodplain management/adaptation efforts and are based upon those of Sweet et al.
(2018) using the relative sea level projections considered likely (Intermediate Low and
Intermediate Scenarios) to occur by the Fourth National Climate Assessment (Sweet et al., 2017).
105. ACKNOWLEDGEMENTS
The authors acknowledge the NOAA Center for Operational Oceanographic Products and
Services Data Processing Team for verifying the hourly water level data for the stations
presented in this report and Dr. Matthew Widlansky at the University of Hawaii Sea Level
Center for information on Honolulu and insightful discussions about Pacific Island flood risk.
6. DATA AVAILABILITY
An interactive map of the outlook can be found at:
https://tidesandcurrents.noaa.gov/HighTideFlooding_AnnualOutlook.html
The high tide flooding data referenced in this report can be accessed via the CO-OPS API at:
https://tidesandcurrents.noaa.gov/api-helper/url-generator.html
High tide flooding and sea level rise inundation layers, digital elevation models and map services
are available at:
https://coast.noaa.gov/digitalcoast/tools/slr.html
U.S. sea level rise scenarios of the Fourth National Climate Assessment can be found at:
https://scenarios.globalchange.gov/sea-level-rise
7. REFERENCES
Habel, S., Fletcher, C. H., Anderson, T. R., and Thompson, P. R. (2020). Sea-Level Rise induced
Multi-Mechanism flooding and contribution to Urban infrastructure failure. Sci. Rep. 10, 1–12.
NOAA (2020). National Weather Service Instruction 10-320. Surf Zone Forecast and
Coastal/Lakeshore Hazard Services.
http://www.nws.noaa.gov/directives/sym/pd01003020curr.pdf
Sweet W., J. Park, J. Marra, C. Zervas and S. Gill (2014). Sea level rise and nuisance flood
frequency changes around the U.S. NOAA Technical Report NOS CO-OPS 73, 53 pp.
http://tidesandcurrents.noaa.gov/publications/NOAA_Technical_Report_NOS_COOPS_073.pdf
Sweet, W.V., J. Park, S. Gill, and J. Marra (2015). New ways to measure waves and their effects
at NOAA tide gauges: A Hawaiian‐network perspective. Geophys. Res. Lett., 42(21),
9355-9361.
Sweet, W.V., R.E. Kopp, C.P. Weaver, J. Obeysekera, R.M. Horton, E.R. Thieler, and C. Zervas
(2017). Global and Regional Sea Level Rise Scenarios for the United States. NOAA Tech.
Rep. NOS CO-OPS 083. National Oceanic and Atmospheric Administration, National Ocean
Service, Silver Spring, MD. 75 pp.
https://tidesandcurrents.noaa.gov/publications/techrpt83_Global_and_Regional_SLR_Scenar
ios_for_the_US_final.pdf
11Sweet, W.V., G. Dusek., J. Obeysekera, J. Marra (2018). Patterns and Projections of High Tide
Flooding Along the U.S. Coastline Using a Common Impact Threshold. NOAA Tech. Rep.
NOS CO-OPS 086. National Oceanic and Atmospheric Administration, National Ocean
Service, Silver Spring, MD. 44 pp.
https://tidesandcurrents.noaa.gov/publications/techrpt86_PaP_of_HTFlooding.pdf
Sweet, W. V., G. Dusek, G. Carbin, J. J. Marra, D. C. Marcy, and S. Simon (2020). 2019 State of
US High Tide Flooding with a 2020 Outlook. NOAA Tech. Rep. NOS CO-OPS 92 17 pp.
https://tidesandcurrents.noaa.gov/publications/Techrpt_092_2019_State_of_US_High_Tide_
Flooding_with_a_2020_Outlook_30June2020.pdf
12APPENDIX 1.
Location-specific high tide flood (HTF) occurrences and projections. U.S. Regions, NOAA
tide gauges, NOAA minor HTF threshold (meters above MHHW), HTF frequency typical of year
2000 based upon trend fits, historical annual HTF day counts through last year (2019: May 2019–
April 2020), number of HTF days during 2020, the moderate and major HTF height thresholds,
HTF day counts that also reached the moderate and major levels in 2020, the 2020 Outlook, and
HTF range considered likely by 2030 and 2050 (Sweet et al., 2018).
Region Tide Gauge NOAA ID HTF HTF HTF HTF Moderate Moderate HTF 2030 2050
Location Height Typical Record in and Major and Major 2021 HTF HTF
in 2000 through 2020 HTF HTF in Outlook (days/ (days/
(m, (days/ 2019 (days/ Heights 2020 (days/ year) year)
MHHW) year) (days/ year) year)
year)
Pacific Is. Nawiliwili, HI 1611400 0.522 0 1 0 0.82, 1.19 0, 0 0 0 1-30
Honolulu, HI 1612340 0.523 0 0 0 0.82, 1.19 0, 0 0 0 2-30
Mokuoloe, HI 1612480 0.526 0 0 0 0.82, 1.2 0, 0 0 0 3-30
Kahului, HI 1615680 0.527 0 1 0 0.82, 1.2 0, 0 0 0 4-55
Kawaihae, HI 1617433 0.526 0 0 0 0.82, 1.2 0, 0 0 0 0-15
Hilo, HI 1617760 0.529 0 1 0 0.82, 1.2 0, 0 0 0-1 10-65
Midway Island 1619910 0.515 1 6 0 0.81, 1.19 0, 0 0-2 3-4 8-60
Apra Harbor, 1630000 0.529 0 1 0 0.82, 1.2 0, 0 0 0 2-45
Guam
Pago Pago, A.S. 1770000 0.497 0 0 --- 0.79, 1.17 --- 0 0-0 0-2
Kwajalein 1820000 0.548 0 2 0 0.84, 1.22 0, 0 0-1 10-20 40-
Island 100
13Wake Island 1890000 0.529 0 2 0 0.82, 1.2 0, 0 0 1-2 6-55
NE Bar Harbor, ME 8413320 0.639 7 30 13 0.9, 1.31 0, 0 4-14 20-35 45-90
Atlantic
Portland, ME 8418150 0.621 5 21 7 0.89, 1.29 0, 0 7-13 15-30 35-80
Boston, MA 8443970 0.625 6 22 11 0.89, 1.3 1, 0 11-18 20-35 45-95
Woods Hole, 8447930 0.527 2 10 5 0.82, 1.2 0, 0 3-7 8-20 35-
MA 135
Nantucket 8449130 0.544 2 11 3 0.83, 1.21 0, 0 3-7 7-15 30-
Island, MA 125
Newport, RI 8452660 0.547 2 11 6 0.84, 1.22 0, 0 3-7 10-25 40-
125
Providence, RI 8454000 0.559 3 15 8 0.84, 1.23 0, 0 6-11 15-30 40-
105
New London, 8461490 0.537 2 10 4 0.83, 1.21 0, 0 3-7 8-15 25-
CT 120
Bridgeport, CT 8467150 0.589 3 11 6 0.87, 1.26 0, 0 6-11 15-30 35-
105
Montauk, NY 8510560 0.531 3 11 6 0.82, 1.2 0, 0 4-7 10-25 40-
150
Kings Point, 8516945 0.597 5 15 5 0.87, 1.27 2, 0 7-13 20-35 40-
NY 110
The Battery, 8518750 0.562 5 15 13 0.85, 1.23 0, 0 9-14 20-40 50-
NY 135
Bergen Point, 8519483 0.567 4 13 7 0.85, 1.24 0, 0 7-12 15-35 45-
NY 130
Sandy Hook, NJ 8531680 0.564 5 20 11 0.85, 1.23 1, 0 10-15 25-45 70-
160
Atlantic City, 8534720 0.556 5 22 11 0.84, 1.23 0, 0 9-15 20-35 65-
NJ 155
Cape May, NJ 8536110 0.566 3 14 4 0.85, 1.24 0, 0 5-10 15-30 55-
135
14Philadelphia, 8545240 0.582 3 12 4 0.86, 1.25 0, 0 4-8 10-20 30-
PA 105
Reedy Point, 8551910 0.571 1 5 0 0.85, 1.24 0, 0 1-3 6-15 25-
DE 100
Lewes, DE 8557380 0.557 4 15 8 0.84, 1.23 0, 0 7-12 15-30 50-
135
Cambridge, MD 8571892 0.525 1 11 4 0.82, 1.2 0, 0 5-8 9-20 40-
150
Tolchester 8573364 0.519 2 17 7 0.81, 1.19 0, 0 7-12 15-25 50-
Beach, MD 160
Baltimore, MD 8574680 0.520 2 12 7 0.82, 1.19 0, 0 5-9 15-25 50-
160
Annapolis, MD 8575512 0.518 2 18 7 0.81, 1.19 0, 0 7-11 15-25 55-
170
Solomons 8577330 0.518 1 11 2 0.81, 1.19 0, 0 5-8 10-20 45-
Island, MD 165
Washington, 8594900 0.539 3 22 3 0.83, 1.21 0, 0 5-10 10-20 35-
DC 120
Wachapreague, 8631044 0.564 3 17 7 0.85, 1.23 0, 0 8-15 15-25 40-
VA 120
Kiptopeke, VA 8632200 0.536 3 11 4 0.83, 1.21 0, 0 4-8 10-20 40-
120
Lewisetta, VA 8635750 0.518 2 20 5 0.81, 1.19 0, 0 9-14 15-25 50-
170
Windmill Point, 8636580 0.532 3 17 1 0.83, 1.2 0, 0 5-11 15-25 45-
VA 160
Sewells Point, 8638610 0.534 5 15 14 0.83, 1.2 0, 0 9-14 20-35 65-
VA 170
SE Duck, NC 8651370 0.545 5 18 11 0.83, 1.22 0, 0 6-12 20-30 55-
Atlantic 135
Oregon Inlet, 8652587 0.514 1 8 2 0.81, 1.18 0, 0 3-6 7-15 35-
NC 165
15Beaufort, NC 8656483 0.543 0 10 5 0.83, 1.21 0, 0 2-4 6-15 25-
100
Wilmington, 8658120 0.557 1 14 5 0.84, 1.23 1, 1 2-6 4-9 15-65
NC
Springmaid 8661070 0.568 2 11 9 0.85, 1.24 1, 1 4-9 10-20 30-75
Pier, SC
Charleston, SC 8665530 0.570 2 13 14 0.85, 1.24 0, 0 5-9 10-20 35-90
Fort Pulaski, 8670870 0.591 2 13 12 0.87, 1.26 0, 0 5-9 15-25 40-95
GA
Fernandina 8720030 0.580 2 9 9 0.86, 1.25 0, 0 3-7 9-15 25-70
Beach, FL
Mayport, FL 8720218 0.557 1 6 8 0.84, 1.23 0, 0 2-4 5-10 20-65
Trident Pier, FL 8721604 0.537 0 12 14 0.83, 1.21 0, 0 9-14 7-15 25-65
Virginia Key, 8723214 0.518 0 9 6 0.81, 1.19 0, 0 4-7 2-5 10-55
FL
Vaca Key, FL 8723970 0.512 0 1 0 0.81, 1.18 0, 0 0 1-3 9-65
Key West, FL 8724580 0.522 0 2 0 0.82, 1.19 0, 0 0 0-2 8-60
Eastern Naples, FL 8725110 0.535 1 3 1 0.83, 1.21 0, 0 0-2 2-4 9-55
Gulf
Fort Myers, FL 8725520 0.516 1 6 3 0.81, 1.19 2, 0 1-4 3-6 15-80
St. Petersburg, 8726520 0.528 1 4 2 0.82, 1.2 1, 0 2-3 3-7 15-85
FL
Clearwater, FL 8726724 0.540 1 5 3 0.83, 1.21 0, 0 4-6 2-4 10-55
Cedar Key, FL 8727520 0.546 2 11 6 0.84, 1.22 0, 0 4-7 5-10 20-70
16Apalachicola, 8728690 0.520 1 10 9 0.82, 1.19 1, 0 4-8 4-8 10-50
FL
Panama City, 8729108 0.516 1 7 9 0.81, 1.19 1, 0 2-6 4-7 10-65
FL
Panama City 8729210 0.517 1 8 11 0.81, 1.19 2, 0 2-7 4-6 10-50
Beach, FL
Pensacola, FL 8729840 0.515 2 10 14 0.81, 1.19 3, 1 3-7 5-8 15-70
Dauphin Island, 8735180 0.512 1 10 18 0.81, 1.18 2, 0 5-11 6-10 30-95
AL
Bay Waveland, 8747437 0.522 3 14 22 0.82, 1.19 10, 3 10-16 25-40 110-
MS 205
Western Grand Isle, LA 8761724 0.428 0 6 16 0.73, 1.1 2, 0 4-9 9-20 145-
Gulf 270
Morgans Point, 8770613 0.535 2 22 17 0.83, 1.21 3, 0 13-21 30-45 110-
TX 215
Eagle Point, TX 8771013 0.494 0 64 38 0.79, 1.16 5, 0 38-53 --- ---
Galveston, TX 8771450 0.517 3 18 27 0.81, 1.19 5, 1 9-16 15-30 100-
215
Rockport, TX 8774770 0.504 1 7 11 0.8, 1.17 0, 0 2-5 7-15 60-
165
Corpus Christi, 8775870 0.529 1 18 22 0.82, 1.2 6, 1 7-15 10-20 55-
TX 150
Port Isabel, TX 8779770 0.517 1 9 12 0.81, 1.19 0, 0 2-6 7-15 40-
135
SW San Diego, CA 9410170 0.570 2 13 0 0.85, 1.24 0, 0 3-7 10-15 30-60
Pacific
La Jolla, CA 9410230 0.565 2 8 0 0.85, 1.24 0, 0 1-4 10-15 25-55
17Los Angeles, 9410660 0.567 1 6 0 0.85, 1.24 0, 0 1-3 6-10 15-40
CA
Santa Monica, 9410840 0.566 2 7 0 0.85, 1.24 0, 0 0-3 8-15 20-50
CA
Port San Luis, 9412110 0.565 1 6 0 0.85, 1.24 0, 0 0-2 3-5 8-25
CA
Monterey, CA 9413450 0.565 1 7 0 0.85, 1.24 0, 0 0-2 3-5 10-30
San Francisco, 9414290 0.571 0 6 0 0.85, 1.24 0, 0 0-1 2-3 6-25
CA
Alameda, CA 9414750 0.580 1 10 0 0.86, 1.25 0, 0 0-2 1-2 3-15
Point Reyes, 9415020 0.570 2 8 0 0.85, 1.24 0, 0 0-3 4-7 15-40
CA
Port Chicago, 9415144 0.560 1 15 0 0.85, 1.23 0, 0 0-3 2-2 4-15
CA
Arena Cove, 9416841 0.573 2 14 0 0.86, 1.24 0, 0 0-4 5-7 10-30
CA
NW Humboldt Bay, 9418767 0.584 4 15 4 0.86, 1.25 0, 0 4-10 15-20 45-80
Pacific CA
Port Orford, CA 9431647 0.572 4 23 2 0.85, 1.24 0, 0 0-8 9-15 15-40
Charleston, OR 9432780 0.593 5 27 3 0.87, 1.26 0, 0 0-8 9-15 15-35
South Beach, 9435380 0.602 7 25 8 0.88, 1.27 1, 0 1-9 15-20 30-50
OR
Toke Point, WA 9440910 0.609 12 33 16 0.88, 1.28 3, 0 4-16 15-20 20-35
Port Angeles, 9444090 0.586 4 12 2 0.86, 1.26 0, 0 0-5 5-7 8-15
WA
Port Townsend, 9444900 0.604 3 13 3 0.88, 1.27 0, 0 0-4 5-6 9-20
WA
18Seattle, WA 9447130 0.639 2 11 3 0.9, 1.31 0, 0 1-5 5-6 9-20
Cherry Point, 9449424 0.612 3 15 3 0.88, 1.28 0, 0 0-5 4-5 5-10
WA
Friday Harbor, 9449880 0.595 4 17 4 0.87, 1.27 0, 0 0-5 6-7 9-20
WA
Caribbean Lime Tree Bay, 9751401 0.509 0 1 0 0.81, 1.18 0, 0 0 0 0-3
VI
Charlotte 9751639 0.510 0 1 0 0.81, 1.18 0, 0 0 0 0-7
Amalie, VI
San Juan, PR 9755371 0.519 0 1 0 0.81, 1.19 0, 0 0 0 0-9
Magueyes 9759110 0.508 0 1 0 0.81, 1.18 0, 0 0 0 0-3
Island, PR
19ACRONYMS
cm centimeter
CO-OPS Center for Operational Oceanographic Products and Services
°C degree Celsius
ENSO El Niño Southern Oscillation
ft feet
HTF high tide flooding
m meter
mm millimeter
MHHW mean higher high water
NOAA National Oceanic and Atmospheric Administration
NOS National Ocean Service
NWS National Weather Service
ONI Oceanic Niño Index
RSL relative sea level
yr year
20You can also read