INVESTOR PRESENTATION - July 2018 - ALIMENTATION COUCHE-TARD INC.
←
→
Page content transcription
If your browser does not render page correctly, please read the page content below

ALIMENTATION COUCHE-TARD INC.

INVESTOR PRESENTATION

               July 2018
FORWARD-LOOKING INFORMATION AND CAUTIONARY LANGUAGE

    This presentation and the accompanying oral presentation contain forward-looking statements within the meaning of applicable securities legislation.
    Forward-looking statements are typically identified by words such as “projected”, “estimate”, “may”, “anticipate”, “believe”, “expect”, “plan”, “intend” or
    similar words suggesting future outcomes or statements regarding an outlook. All statements other than statements of historical fact contained in
    these slides are forward-looking statements.

    Forward-looking statements involve numerous assumptions, risks and uncertainties. A variety of factors, many of which are beyond Alimentation
    Couche-Tard Inc.’s (“Couche-Tard”) control, may cause actual results to differ materially from the expectations expressed in its forward-looking
    statements. These factors include, but are not limited to, the effects of the integration of acquired businesses and the ability to achieve projected
    synergies, fluctuations in margins on motor fuel sales, competition in the convenience store and retail motor fuel industries, foreign exchange rate
    fluctuations, and such other risks as described in detail from time to time in documents filed by Couche-Tard with securities regulatory authorities in
    Canada, including those risks described in Couche-Tard’s management’s discussion and analysis (MD&A) for the year ended April 29, 2018. Couche-
    Tard’s MD&A and other publicly filed documents are available on SEDAR at www.sedar.com.

    Unless otherwise required by law, Couche-Tard does not undertake to update any forward-looking statement, whether written or oral, that may be
    made from time to time by it or on its behalf. No financial information presented in this presentation as of a date more recent than April 29, 2018 has
    been audited.

    While the information contained in this presentation is believed to be accurate, Couche-Tard expressly disclaims any and all liability for any losses,
    claims or damages of whatsoever kind based upon the information contained in, or omissions from, this presentation or any oral communication
    transmitted in connection therewith. In addition, none of the statements contained in this presentation are intended to be, nor shall be deemed to be,
    representations or warranties of Couche-Tard and its affiliates. Where the information is from third-party sources, the information is from sources
    believed to be reliable, but Couche-Tard has not independently verified any of such information contained herein.

    This presentation is not, and under no circumstances is to be construed as, a prospectus, an offering memorandum, an advertisement or a public
    offering of securities. Under no circumstances should the information contained herein be considered an offer to sell or a solicitation of an offer to buy
    any securities.

2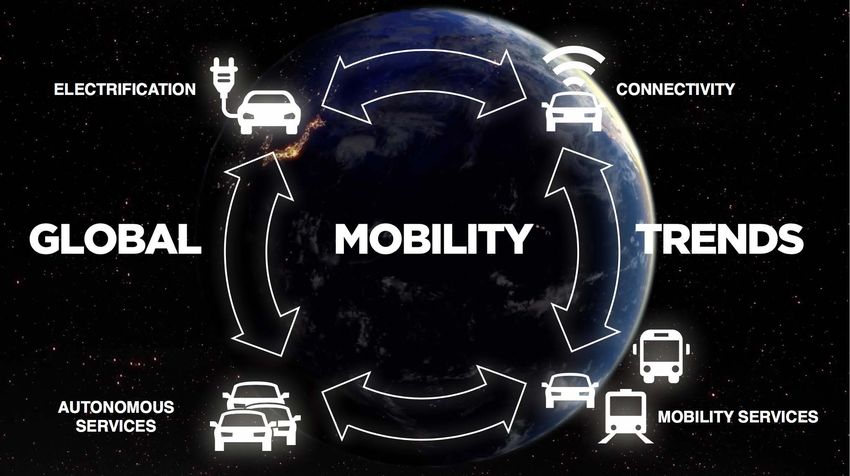
AGENDA

    1.    Company Highlights (1)
    2.    Ambitions & Strategy
    3.    Value Creation & Financial Review (1)
    4.    Recent acquisitions summary

         (1) All data presented is excluding CAPL unless specifically mentioned.

3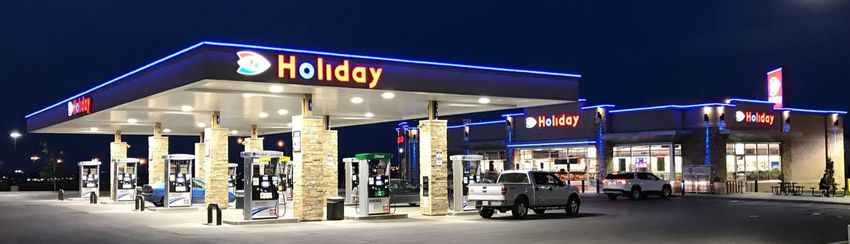
KEY DATA
• Listed on the Toronto Stock Exchange ATD.B
• Market Cap1 Approx. CA$33B
• Revenue US$50.0B Fiscal Year 2018
• Gross Profit US$8.0B Fiscal Year 2018
• EBITDA US$2.9B Fiscal Year 2018
• Number of stores2 16,108
North America 10,015
Europe 2,725
CAPL network 1,346
Circle K branded sites under
licensing agreements 2,022
• Net Debt / Leverage3
FY2018 US$7.7B / 2.46x
• Ratings
S&P BBB (Stable outlook)
Moody’s Baa2 (Stable outlook)
1. As at June 26, 2018.
2. Includes Couche-Tard’s Company-Owned/Dealer-Operated and Dealer-Owned-Dealer-Operated sites as at April 29, 2018.
3. Long term interest-bearing debt, net of cash and cash equivalents and temporary investments divided by EBITDA adjusted for non-recurring
items. Refer to the Corporation’s MD&As for more details.
4
ALIMENTATION COUCHE-TARD INC.

COMPANY HIGHLIGHTS
OUR COMPANY TIMELINE

                    Acquisition of the assets                                             Acquisition of The Pantry Inc., a
                   of Johnson Oil Company,                                              leading convenience store operator
                   Inc., owner of 225 Bigfoot                                            in the southeastern United States.
                    stores, all located in the
                                                                                         Global Circle K brand is launched
                          U.S. Midwest
                                                                                                                                  Acquisition of 278 Esso-
                                                          Couche-Tard becomes
                                                                                                                                branded Canadian fuel and
                                                          an active player in the
                                                                                                                                convenience sites located in
                                                               US market
                                                                                                                                 Ontario and Québec from
                                                              consolidation.
                                                                                                                                        Imperial Oil

   Start of operations with
                                             Acquisition of The               Acquisition of Statoil               Acquisition of Topaz,       Acquisition of CST Brands, 4th
    the opening of a first
                                           Circle K Corporation              Fuel & Retail, a leading                   the leading            largest chain in North America,
     convenience store
                                           from ConocoPhillips                 Scandinavian road                   convenience and fuel          and Holiday Stationstores, a
 located in Laval, Québec.
                                                 Company                      transport fuel retailer                retailer in Ireland.           Midwest powerhouse
     Consolidation of
     Canadian Market
WHO WE ARE
     Couche-Tard is a canadian based group and a world leader in the convenience store
     and road transportation fuel retail sector
     • In North America, Couche-Tard is the largest independent convenience store operator in terms of
       number of company-operated stores.
     • In Europe, Couche-Tard is a leader in convenience store and road transportation fuel retail in
       Scandinavia, Ireland and the Baltic countries, with a significant presence in Poland.

                                            • 10,015 convenience stores throughout North America, including 8,705 stores offering road
                                              transportation fuel in all 10 Canadian provinces and 48 U.S. States, and employing about
                           North America      105,000 people.
                                            • More than 1,300 locations in the U.S. supplied with road transportation fuel through
                                              CrossAmerica Partners LP.

                                            • 2,725 stores, comprising a broad retail network across Scandinavia (Norway, Sweden and
                                              Denmark), Ireland, the Baltics (Estonia, Latvia and Lithuania), Poland and Russia. Including
                                Europe        employees at its branded franchise stations, about 25,000 people work in its retail network,
                                              terminals and service offices across Europe.

                                            • More than 2,000 stores operated by independent operators under the Circle K banner in 14 other
                            International     countries or territories worldwide which brings the number of sites in Couche-Tard’s network to
                                              over 16,000.

    Store count as at April 29, 2018.

7
A DISCIPLINED CONVENIENCE STORE OPERATOR AND INTEGRATOR
                                                     • World class retailer and leading C-store operator with geographically diverse footprint
    Broad Geographic Footprint with Leading Market
                                                     • Strong banners, with our new global convenience brand “Circle KTM” and our fuel banner “Ingo” at unmanned stations in
                      Positions                        Scandinavia

                                                     • Increasing focus on private label, fresh food products and famous for concepts
                Superior Product Offerings           • Industry leading merchandise gross margin

                                                     • Proven integrator
    Track Record of Highly Disciplined Growth and    • Well positioned to lead further consolidation in fragmented industry
                   Debt Reduction                    • Committed to investment grade credentials post acquisition

                                                     •Steady industry performance throughout downturns with strong projected growth
                Attractive Sector Dynamics           •C-store sector well positioned to gain share from traditional food retail
                                                     •Industry-leading returns in recessions

                                                     •Strong and consistent financial performance throughout all economic cycles
                Powerful Financial Results           •Prolific history of positive same-store comps and 25.0% Return on equity1
                                                     •Significant FCF generation (2013-2018) CAGR of 14%

                                                     •Proven ability to extract significant synergies from acquisitions
                Attractive Synergy Potential         •Transferring best practices across entire platform

                                                     •Management team with strong track record.
            Disciplined Management Culture           •Decentralized operating model

      Proven Capacity to Transform and Innovate      •Company successfully went trough 3 transformations over its existence

      (1) As of April 29, 2018.

8
NORTH AMERICAN NETWORK                                           Largest independent convenience store
                                                                     operator in the US in terms of number of
                                                                     company operated stores
                                                                     • In the US, the convenience sector is
                                                                       fragmented and in a consolidation phase
                                                                     • On June 28, 2017, Couche-Tard acquired
                                                                       100% of the outstanding shares of CST
                                                                       Brands, the 4th largest chain in North America.
                                                                     • On December 22, 2017, Couche-Tard acquired
                                                                       all the membership interest of Holiday
                                                                       Stationstores, LLC., an important convenience
                                                                       store and fuel player in the U.S. Midwest
                                                                       region.
                                                                     Leader in the Canadian convenience store
                                                                     industry
                                                                     • In Canada, the convenience store sector is
                                                                       dominated by a few major players including
                                                                       Couche-Tard and integrated oil companies.
                                                                       Some of the latter are selling, or expected to
                                                                       sell their retail assets.

                            Total network of 10,015 stores in North America

    As at April 29, 2018.

9
EUROPEAN NETWORK

                                                                 Leader in convenience store and road transportation
                                                                 fuel retail in the Scandinavian and Baltic countries and
                                                                 Ireland
                                                                 • The European convenience store sector is often
                                                                    dominated by a few major players, including
                                                                    integrated oil companies. Some of these are in the
                                                                    process of selling, or are expected to sell their retail
                                                                    assets

                             2,725 stores in 9 countries or regions in Europe
     As at April 29, 2018.

10
INTERNATIONAL PRESENCE
Central / South
Asia
America
China
United Arab
80
Emirates
Saudi 33
Arabia
4
• Convenience stores
operated by independent
Mexico Hong Kong operators under the
715 333 Circle K brand
Egypt
Philippines • License agreement to
12
25 use the brand name
Macau Circle K
Honduras
29 Guam
28
Costa Rica 13
Vietnam
10
272
Malaysia Indonesia
14 454
More than 2,000 licensed Circle K stores in Asia, Costa Rica, Egypt, Honduras,
Mexico, U.A.E and Saudi Arabia
As at April 29, 2018.
11CONSOLIDATED NETWORK RECAP
Canada U.S. Europe Total
COCO(1) 1,587 6,133 1,998 9,718
CODO(2) 250 138 334 722
DODO(3) - 659 392 1,051
Franchise/Affiliated(4) 370 878 1 1,249
Number of sites, end of period 2,207 7,808 2,725 12,740
CAPL network - - - 1,346
Circle K branded sites under licensing agreements (5) - - - 2,022
Total network 16,108
Of which: Automats - - 978 978
# With fuel 1,200 7,505 2,723 11,428
% With fuel 54% 96% 99.9% 89.7%
(1) Sites for which the real estate is controlled by Couche-Tard (through ownership or lease agreements) and for which the stores (and/or the service stations) are operated by
Couche-Tard or one of its commission agents.
(2) Sites for which the real estate is controlled by Couche-Tard (through ownership or lease agreements) and for which the stores (and/or the service stations) are operated by an
independent operator in exchange for rent and to which Couche-Tard sometimes provides road transportation fuel through supply contracts. Some of these sites are subject to a
franchise agreement, licensing or other similar agreement under one of our main or secondary banners.
(3) Sites controlled and operated by independent operators to which Couche-Tard supplies road transportation fuel through supply contracts. Some of these sites are subject to a
franchise agreement, licensing or other similar agreement under one of our main or secondary banners.
(4) Stores operated by an independent operator through a franchising, licensing or another similar agreement under one of our main or secondary banners.
(5) Stores operated by independent operators under the Circle K banner in other countries or regions worldwide.
As at April 29, 2018.
12COUCHE-TARD IS A WORLD LEADER
Couche-Tard is a leading global convenience store operator with EBITDA of $3.0 billion
• Well diversified across geographies
• Focus on growing high margin categories
REVENUES
Merchandises and services Motor Fuel Other Total
$12,899M $35,831M $1,270M $50,001M
Europe US Canada
2% Merchandise and
11% 2% Other
Europe services
2%
Revenues 21% 26%
By Products Canada
16%
LTM Q4
2018 Canada
14%
US
65% Europe
US Motor fuel
96% 72%
73%
GROSS PROFITS
Merchandises and services Motor Fuel Other Total
$4,450M $3,317M $225M $7,992M
Europe US Other
Europe 3%
31% 10% Merchandise and
13%
Gross Profit services
Canada 56%
By Products 12%
Canada
LTM Q4 16%
2018
US Europe Motor fuel
Canada 56% 78%
US 41%
71% 13%
Financial data presented for the LTM as of Q4 2018.
13A HISTORY OF STRONG FINANCIAL PERFORMANCE
Gross Profit Same Store Sales Growth
2013 2014 2015 2016 2017 2018
(in millions of US Dollars)
Merchandise sales
+11% CAG 7,992
US 1.0% 3.8% 3.9% 4.6% 1.6% 0.8%
Europe 1.6% 2.0% 2.8% 2.7% 2.7%
6,482
6,082
5,268 Canada 2.0% 1.9% 3.4% 2.9% -0.9% 0.4%
4,988
4,610
Motor Fuel Volume
US 0.6% 1.7% 3.4% 6.6% 1.7% -0.4%
Europe 2.5% 2.4% 2.6% 0.7% 0.0%
2013 2014 2015 2016 2017 2018
Canada 0.0% 1.3% -0.1% 0.9% -0.2% -1.4%
EBITDA Free Cash Flow (1)
(in millions of US Dollars) (in millions of US Dollars)
+16% CAG +14% CAG
2,919
2,331 2,396 1,226
1,876 979 1,065
1,640 865 890
1,376
614
2013 2014 2015 2016 2017 2018 2013 2014 2015 2016 2017 2018
Proven track record of consistent growth
(1) Free Cash Flow defined as: EBITDA minus total CAPEX (excluding price paid for acquisitions), net dividends paid, net
interests paid and net income taxes paid plus proceeds from disposal.
14STELLAR STOCK PERFORMANCE
800% 800%
700% 700%
600% 600%
500% 500%
400% 400%
300% 300%
200% 200%
100% 100%
0% 0%
2013-06-12 2014-06-12 2015-06-12 2016-06-12 2017-06-12 2018-06-12
2013-06-12 2014-06-12 2015-06-12 2016-06-12 2017-06-12 2018-06-12
Couche-Tard C-Stores Grocery
Couche-Tard Casey's Delek
Home Improv. Drugstores Mass Merch.
Marathon Murphy CST Brands(1)
Dollar Stores
Source: Yahoo Finance. As of June 13, 2018.
(1) On June 28, 2017, ACT acquired CST Brands.
15ALIMENTATION COUCHE-TARD INC. AMBITIONS & STRATEGY
OUR VISION

       TO BECOME THE WORLD’S PREFERRED
     DESTINATION FOR CONVENIENCE AND FUEL

17
OUR GLOBAL BRAND: CIRCLE K
REBRANDING STATUS

             Project well under way: More than 3,350 stores(1) in North America and more than 1,650 stores(1)
             in Europe are now proudly displaying our new global convenience brand Circle K
                    • Statoil sites completed
                    • Scandinavia and Baltics markets already completed – Outstanding success
                    • Canada is underway and results up to now are promising
                    • United States ongoing

              (1) As of April 29, 2018.

19
THE PROMISE BEHIND THE BRAND 20
NEW GLOBAL BRAND – SAME APPROACH TO SERVING OUR CUSTOMERS

     SUPER GLOBAL
                          SUPER LOCAL

21
STRATEGIC VISION & PRIORITIES: WORKING AT TWO-CLOCK SPEED
FOCUSING ON TO
LOOKING THE
THE CORE
FUTURE BUSINESS
To enhance company value, we are focusing on:
• Key Categories of FoodToandremain
Fuel a growth company for
• Growing Customer basethe shareholders we must find the
recipe for the future
• Lean and Efficient Operations
• Engaged and Productive Employees
LOOKING
FOCUSING INTO
ON THE CORETHE FUTURE
Strategic
To enhance initiatives:
company value, we need to focus
• Executing our Brand Vision
on our core business priorities:
• Digital
• Key Categories
• Growing of Food and Fuel
the Global Network
• Growing Customer
• Food Journey base
• Lean and Efficient Operations
• Mobility
• Engaged and Productive EmployeesOUR TWO STRONGEST PRODUCT CATEGORIES
TIME & CONVENIENCE
23TIME & CONVENIENCE
Shoppers recognize the c-store channel of trade for its convenient
locations, extended hours of operations, one-stop shopping, grab-
and-go foodservice, variety of merchandise and fast transactions
Industry offers speed of service to time-starved consumers who
want to get in and out of the store quickly
Addresses consumer desires to satisfy and immediate need for food,
refreshment and fuel
83% of the in-store merchandise that convenience stores sell is
consumed within one hour of purchase, and 65% is immediately
consumed
24US C-STORE INDUSTRY FACTS
Convenience stores have an unmatched speed of transaction: The average time it
takes a customer to walk in, purchase an item and depart is between 3 to 4 minutes
Convenience stores are everywhere. There are 155 thousand convenience stores in
the United States—or one store for about every 2,100 people— and c-stores account
for more than one-third (34.1%) of all outlets in the United States.
The convenience store industry is a destination for food and refreshments
An average convenience store selling fuel has around 1,100 customers per day, or
more than 400,000 per year. Cumulatively, the U.S. convenience store industry alone
serves nearly 160 million customers per day, and 58 billion customers every year.
The convenience store industry is America's primary source for fuel - Self-serve at the
pump is a part of most convenience stores' fueling operations
25MAKING IT EASY BRAND PILLARS SUPPORTING OUR PROMISE 26
BRAND PILLARS – PRODUCTS FOR PEOPLE ON THE GO

                                   Cold
                Hot Dispensed
         Food                   Dispensed   Car Wash   Private Label   Fuel
                 Beverages
                                Beverages

27
BRAND PILLARS – EASY VISITS
Predictable in-store and forecourt experience
Clean In-stock Fast transaction
#2 reason impacting shoppers’ Out-of-stock is #1 reason for 88% of US adults want their store
decision of which c-store to visit missed sale in checkout experience to be faster
(after location) c-stores
Source Convenience store news
28BRAND PILLARS – FAST & FRIENDLY SERVICE
Recruitment Employee Employee Service Physical
& Hiring Training
engagement turnover standards appearance
29We completed the
LOCATION
construction,
relocation or
reconstruction of 88
stores during
fiscal 2018.
30STRATEGIC INIATIVES - PREPARING FOR THE ROAD AHEAD 31
AN OPEN DOOR ON NEW TECHNOLOGIES
DIGITAL – CONTROL OUR DESTINY AND CREATE OUR FUTURE
                  Employee Experience                                                                           Customer Experience
                          &                                                                                              &
                   Value Proposition                                                                               Brand Promise

                                                                       Fuel

                                                                                   Construction   Operations   Network,
                                         Procurement   Warehousing     Logistics        &             &        Format &     Sales &
                                                                                   maintenance      HSE        Concept      Service

                                                                     Convenience

               Backbone                 Stem                                                                       Front-end
               Make it easy             Define right quality and deliver at lowest possible cost                   Constantly sharpen
               to hit the                                                                                          the customer offer
               target

               We view digitialization as a tremendous opportunity to drive growth and create value
                                             throughout our organization.

33
OUR VIEWS ON DIGITAL
It is not a temporary thing … it is part of
every aspect of how we do business
It is not a one-time program … it is a
shift of mindset and way of working
It is not just IT or Marketing … it is
orchestration across the entire arrow
34OUR NEXT GEN RETAIL TECH IS ALL ABOUT MAKING IT EASY
Easy access to
Easy visits Easy tools
customer insight
Cloud enabled Mobile Hardware independent Internet of
forecourt payments software Things
App payment at In-store app Centralized Location based
forecourt payment management marketing
Real time access Easy integration Seamless “Things” status i-eg.
to data with loyalty and deployment which coffee
Forecourt IoT other systems Bring your own machines are not
device working
Connected Seamless Real time
cars Mobile POS integrations data
Payment by car Access through Open architecture Real time
Pre-ordering Web browser Easy integrations campaign results
2 ways Can be opened at through APIs Real time stock
communication any device eg. Loose coupling counts
with customer in phone, tablet, etc. Micro services Real time upselling
the carMOBILITY IS CHANGING – BRINGING SIGNIFICANT OPPORTUNITIES 36
TRANSPORTATION VEHICLES - USEFUL FACTS

                                               Global vehicle fleet is more                                  Worldwide electric vehicle
                                                                               2016 Worldwide electric
                   Average lifecycle of        than 1.2 billion vehicles and                                   fleet is approximately
                                                                                vehicle sales % total:
                  vehicles is 16-19 years         is expected to reach                                       2 million vehicles or 0.2%
                                                                                        1.10%
                                                     2 billion in 2035                                               of total fleet

                                                 Currently, total cost of
                   US electric vehicles           ownership for electric       Limited line-up of electric   #1 selling vehicle in the US:
                penetration is less than 1%      vehicles is significantly              vehicles                      Ford F-150
                                                higher than ICE vehicles

                Charging infrastructure and       Electric vehicle range        Number of vehicles is        Number of miles driven per
                  technology not mature              remains limited                increasing                 vehicle is increasing

                                                US fuel retail industry is
                                                highly fragmented. More                                       Countries that sopped or
                                                                                Countries with high EV
                In the US, the electric grid    than 60% of the 154k c-                                         significantly reduced
                                                                                 penetration heavily
                    is highly carbonized         stores are operated by                                       subsidies have seen EV
                                                                                   subsidize EVs
                                               single store or small chain                                          sales plunge
                                                 operators (
COUCHE-TARD’S VIEW
Gradual and
manageable
change
process
Continuous Industry’s
monitoring reaction
Opportunity
Continued ACT’s
focus on competitive
business advantages
38A GRADUAL AND MANAGEABLE CHANGE PROCESS
Global mobility trends will change how we think about cars and demand for
fuel is going to decline but Couche-Tard believes that this change is going
to happen gradually because
In order for substantial electric vehicle penetration:
• Cost of electric vehicles will need to move closer to traditional internal combustion engine cars
whether through reduction in manufacturing/battery costs or significant subsidies from the
government authorities (which we do not believe are sustainable in most countries)
• Charging infrastructure needs to expand, adapt and move to a more standard, predictable offer in
order to convince the consumers of the practicality of the product and its resistance to obsolescence
• Selection of electric vehicles needs to substantiate in order to meet needs and expectation of
consumers
• Range of EVs will need to increase in order to adapt to North American driving habits
In order to deliver significant GHG emission reductions, transport electrification
needs to go hand-in-hand with the decarbonisation of electricity generation
Electric grid needs to be adapted in terms of capacity and battery production
capabilities need to significantly ramp-up
39 12.7.2018POSSIBLE OFFSETS TO DECLINING FUEL DEMAND
Possible decline in number of stations and fuel volume consolidation. Out of 155k
convenience stores in the US, 60% are operated by single store operators
Increased fuel margins
Higher share of premium fuels (higher margins)
Expansion of current convenience offer towards higher margin categories
Increasing number of vehicles
Increasing number of miles driven per vehicle
Industry’s participation in the electrification process
40 12.7.2018ACT’S COMPETITIVE ADVANTAGES
Experience in
Scale & Buying Decentralized
transforming
Power model
and adapting
Strong balance
Proven capacity
Norway sheet and
to transform and
Laboratory capacity to
Innovate
invest
41COUCHE-TARD’S CONTINUED FOCUS ON OPTIMIZING BUSINESS
Continued commitment towards growing and improving our current
fuel business
• Continued improvement of offer and adaptation to changing customers needs
• Excellence in execution and capacity to innovate
• Continued adaptation of our fuel branding strategy
• Improved supply conditions
• Cost-efficiency of the our fuel value chain and other parts of the business
• Leverage our scale and competitive supply condition in order to further consolidate
the market
Continued work towards our the transformation of our concept
mainly through leveraging:
• Using our past experience in adapting to changing market conditions (ex. Tobacco,
grocers’ extended hours of operations)
• Testing and introducing new and innovative convenience concepts
• Using Norway as a live-pilot for upcoming changes
42 12.7.2018CONTINOUS MONITORING
Although we believe that changing global mobility trends are going
to happen gradually and that US fuel demand is going to continue to
increase or be stable for another 5-10 years, we are committed to
proactively monitor the change in trends and to work towards
adapting our business model in order to take advantage of the
opportunities these new trends will bring to our business.
43ALIMENTATION COUCHE-TARD INC. VALUE CREATION AND FINANCIAL REVIEW
OUR FOUR PILLARS OF VALUE CREATION – THE EQUATION

          Value Drivers            Protect Value & Enable Growth

                                                       Capital
     Organic                            Cost         Structure &    Value
                    Acquisitions
     Growth                           Discipline      Financial    Creation
                                                      Discipline

45
ORGANIC GROWTH
Customer
Focus
Digital Key Categories
Network Innovation
Development
Organic
Growth
Branding Execution
Continuous
Private Label
Improvement
46ORGANIC – FISCAL 2018 TOP-LINE GROWTH
Europe SSS
+2,7%
Canada SSV Europe SSV
(-1.4)% 0.0%
Organic Growth
Canada SSS US
SSS
+0.4% +0.8%
US
SSV
(-0.4)%
SSS: Same-store merchandise sales
SSV: Same-store volume
47ORGANIC – SUSTAINABLE TOP-LINE GROWTH
Merchandise & Service Sales Road Transportation Fuel Volume
(millions of US dollars) (millions of gallons)
12,899 14,525
+11% CAG +15% CAG
10,724
10,072 11,793
8,276 10,502
7,596 7,953
7,626 8,135
6945
2013 2014 2015 2016 2017 2018 2013 2014 2015 2016 2017 2018
Same-store Merchandise Revenue Road Transportation Fuel Same-Store
Growth Volume Growth
5% 5%
2013 2014 2015 2016 2017 2018 2013 2014 2015 2016 2017 2018
-5% -5%
US Europe Canada
US Europe Canada
CAG: Five-year compounded annual growth - fiscal 2018 over fiscal 2013.
48ORGANIC GROWTH –
LEADING TO STRONG MARGINS IN ALL GEOGRAPHIES
Europe
44.0%
Organic
Growth
United
Canada
States
34.4%
33.6%
FISCAL 2018 MERCHANDISE & SERVICE MARGIN
49NO CLEAR CORRELATION BETWEEN FUEL PRICES & MARGINS
U.S Market
16.99 18.77 18.11 21.74 • No clear correlation between fuel selling
20.15 18.56 19.39 price and margins
• Our margins are not directly impacted by
lower fuel selling prices
3.54 3.51 3.41 2.89 2.20 2.18 2.37
• Lower fuel prices leave customers more
money in their pockets for their in-store
2012 2013 2014 2015 2016 2017 2018 shopping
Motor fuel price (US dollars per gallon) Motor fuel margin (US cents per gallon)
U.S Fuel Margins (CPG) Canadian Fuel Margins (CPL) Norwegian Fuel Margins (NOK PL)
12.00 1.4
30.00
1.2
10.00
25.00
1
8.00
20.00
0.8
6.00
15.00 0.6
4.00 0.4
10.00
2.00 0.2
5.00
0
- -
Q1 2013
Q3 2013
Q1 2014
Q3 2014
Q1 2015
Q3 2015
Q1 2016
Q3 2016
Q1 2017
Q3 2017
Q1 2018
Q3 2018
Q1 2012
Q3 2012
Q1 2013
Q3 2013
Q1 2014
Q3 2014
Q1 2015
Q3 2015
Q1 2016
Q3 2016
Q1 2017
Q3 2017
Q1 2018
Q3 2018
Q1 2012
Q3 2012
Q1 2013
Q3 2013
Q1 2014
Q3 2014
Q1 2015
Q3 2015
Q1 2016
Q3 2016
Q1 2017
Q3 2017
Q1 2018
Q3 2018
CA margins (CPL) Trend
US margins (CPG) Trend NOK margins per litre Trend
0.9 Swedish Fuel Margins (SEK PL) 0.9
Danish Fuel Margins (DKK PL)
0.8
0.8
0.7
0.7
0.6
0.6
0.5
0.5
0.4
0.4
0.3
0.3
0.2
0.2
0.1
0.1
0
0
Q1 2013
Q3 2013
Q1 2014
Q3 2014
Q1 2015
Q3 2015
Q1 2016
Q3 2016
Q1 2017
Q3 2017
Q1 2018
Q3 2018
Q1 2013
Q3 2013
Q1 2014
Q3 2014
Q1 2015
Q3 2015
Q1 2016
Q3 2016
Q1 2017
Q3 2017
Q1 2018
Q3 2018
SEK margins per litre Trend DKK margins per litre Trend
50US FUEL MARGINS TRENDS
Year-over-year volatility – Long term trend is up
ACT Historical US Fuel Margins (CPG) US Industry Historical Fuel Margins (CPG)
24.00 24.00
22.00 22.00
+1.9 CAG
20.00 20.00
18.00 18.00
16.00 16.00
14.00 14.00
12.00 12.00
10.00 10.00
2006 2007 2008 2009 2010 2011 2012 2013 2014 2015 2016 2017 2018 2006 2007 2008 2009 2010 2011 2012 2013 2014 2015 2016
• Large integrated oil companies out of retail. Market • Large integrated oil companies out of retail. Market
dominated by pure play retailers who need to maintain dominated by pure play retailers who need to maintain
and grow margins in order to maintain profitability and grow margins in order to maintain profitability
• Higher premium fuel penetration • Higher premium fuel penetration
• Improved, more sophisticated pricing strategies
• Improved, more sophisticated execution
• Improved supply conditions
ACT: Fiscal Year / Industry: Calendar Year
Sources: ACT reporting documents and NACS SOI Annual Report.
51ACQUISITIONS ROADMAP
Strike the
Identify the Secure Swift and Realization of Reverse
right deal at
right acquired efficient available synergies and Deleverage
the right
opportunities talent integration synergies learnings
pricePROVEN TRACK RECORD OF SUCCESSFUL ACQUISITIONS Acquisitions
Garvin oil
Compac
Revenue ($)
Food Stores
Winners
Sterling
Stores
Pump N Shop
2004 2005 2006 2007 2008 2009 2010 2011 2012 2013 2014 2015 2016 2017 2018
Leverage ratio(1) 2.2 0.8 0.4 1.5 1.3 1.0 0.8 0.3 0.4 2.0 (2) 1.3 1.2 (3) 1.0 (3) 1.1 (3) 2.5 (3)
Stores
1,706 45 75 421 46 107 70 47 326 2,506 166 1,660 515 442 2,055
Acquired
(1) This ratio represents the following calculation: long term interest-bearing debt, net of cash and cash equivalents and
temporary investments divided by EBITDA (Earnings before Interest, Tax, Depreciation, Amortization and Impairment)
adjusted for specific items. Refer to the Corporation’s MD&As for more details.
53 (2) Including full-year results for SFR.
(3) Pro forma The Pantry for 2015, Topaz for 2016, ESSO for 2017 and CST and Holiday for 2018.EXCEPTIONAL DELEVERAGING TRACK RECORD Acquisitions
ACT is committed to maintaining a strong balance sheet and sustaining its investment grade credit rating
Topaz, IOL, CST, Cracker Barrel,
Circle K Acquisition No Transformational Acquisition SFR and The Pantry Acquisition Holiday and Jep Pep stores
Acquisitions
2,453 Stores Acquired 1,017 Stores Acquired 2,299 Stores Acquired 4,203 Stores Acquired
Rapid deleveraging Leverage post SFR
$804M
Acquisition after acquisition lower than
transformational Strong credit metrics for several years $3.6B Circle K
Acquisition
(5)
acquisition $1.7B
Adjusted Leverage ratio
$0.3B Acquisition
$1.7B Acquisition $5.4B
4.2 Acquisition Acquisition
3.6
3.0 3.2 3.2 3.1 3.1
2.9 2.7
2.5 2.4
2.1 2.1 2.2 2.0 2.0
F2004 F2005 F2006 F2007 F2008 F2009 F2010 F2011 F2012 Pro Forma F2013 F2014 F2015 (1) F2016 (2) F2017 (3) F2018 (4)
Demonstrated track record of rapid deleveraging after acquisitions
(1) Pro forma The Pantry
(2) Pro forma Topaz
(3) Pro forma Esso
(4) Pro forma CST and Holiday
54 (5) This ratio represents the following calculation: long-term interest-bearing debt, net of cash and cash equivalents and
temporary investments divided by EBITDA (Earnings Before Interest, Tax, Depreciation, Amortization and Impairment)
adjusted for specific items.DELIVERING ON SYNERGIES THROUGH OUR ACQUISITIONS Acquisitions
Synergies Statoil Fuel and Retail Synergies The Pantry
• Target: $150M - $200M
• Target for the first 24 months: $125M
• Realized: >$200M • Realized: >$125M
Synergies CST Brands, Inc Synergies Holiday Stationstores
• Target for the first 36 months: $215M • Target for the first 36-48 months: $50M-$60M
• Realized for the first 10 months: $153M
55COST CONTROL – PART OF OUR DNA
Disciplined Culture
Year over year expense growth
Optimization of
Continuous
Shared Services
Benchmarking
Strategy
2.1% 2.0%
1.5%
0.8%
Sharing of Best
0.2% AI, Robotics Cost Control Practices
2014 2015 2016 2017 (1) 2018
Scalable
Organization, Cost Efficient
Systems & Systems
Processes
5-YEAR AVERAGE: +1.3% Economies of
Scale
(1) The fiscal 2017 includes 53 weeks.
56CAPITAL STRUCTURE & FINANCIAL DISCIPLINE
Competitive
cost of debt
Rapid
delevera-ging Well spread
after maturities
acquisitions
Capital
Structure &
Financial
Access to
Disposal of Discipline liquidities –
non-core
Cash and
assets
credit facilities
Careful
Dividend
allocation of
growth
capital
57STRONG CAPITAL STRUCTURE & FINANCIAL DISCIPLINE
Free Cash Flow
(in million dollars US)
Adjusted
Leverage Ratio
3.13:1
1,226
+14 % CAG Average Cost of Investment Grade
1,065 Debt 3.0 % Credit Profile
979
865
890
614
Capital Structure &
Financial Discipline
$7.7 Billion
Free Cash Flow of senior
unsecured notes
~$1.2 Billion in USD, CAD,
EURO and NOK
2013 2014 2015 2016 2017 2018
~$1.1 billion
~$684 millions in
available under
Cash
credit facilities
Standard&Poors: BBB (Stable) Moody’s: Baa2 (Stable)
58Capital
Structure &Capital
STRONG AND SCALABLE FREE CASH FLOW CONVERSION
Financial
Structure &
Discipline
Financial
Discipline
81
1,226
95 890
1,065
215
979 102 2,919
276
85
865 2,396 360
2,331 162
614 351
63 145
1,876
104
1,640 279
77 79
1,376
172 172 87
65 1,056
56
899
807
81
899
807
563
457
459
95
2,396
2,331
1,876
1,640
1,376
563
457 459
(17)
2013 2014 2015 2016 2017 2018
EBITDA Business disposals Net capex Dividends Distributions received from CAPL Income tax paid Interest paid FCFCapital
Structure &
Financial
DISCIPLINED CAPITAL ALLOCATION
Discipline
CAPITAL EXPENDITURES ALLOCATION
23% 27%
Income 40% 32% Income
producing producing
73% 41% 73%
38%
2017 2018 (1)
Development Commercial Programs Maintenance
Continuous improvement in capital allocation efficiency
(1) Excluding one-offs CAPEX.RESULT OF THE VALUE CREATION EQUATION : ADJUSTED DILUTED NET
EARNINGS PER SHARE AND RETURN ON EQUITY GROWTH
Adjusted Diluted Net Earnings Return on Equity
per Share (USD)
Value
Creation
+19% CAG
2.60
27.0%
2.21 24.9% 24.80%
2.08 22.6% 22.5%
21.5%
1.79
1.35
1.11
2013 2014 2015 2016 2017 2018 2013 2014 2015 2016 2017 2018
61RESULT OF THE VALUE CREATION EQUATION : DIVIDEND GROWTH
Dividends Paid – US Millions
162
Value
145
+24 % CAG Creation
104
87
65
56 Dividend vs Free cash flow
1,226
FCF +14 % CAG 1,065
2013 2014 2015 2016 2017 2018
979
865 890
Quarterly dividend increased twice during
fiscal 2017, from CA 7.75¢ per share to CA 614
9.00¢ per share, an increase of 16%. In the
162
fourth quarter of fiscal 2018, the quarterly 145
104
dividend increased to CA 10.00¢ per share, 87
56 65
an increase of 11%.
2013 2014 2015 2016 2017 2018
Free cash flow Dividend
62RESULT OF THE VALUE CREATION EQUATION : STOCK VALUE GROWTH
5-Year Stock Performance
Value
450.0%
Creation
350.0%
250.0%
150.0%
50.0%
-50.0%
Variance ACT stock price (%) Variance TSX index (%)
Source: Bloomberg. As of June 4th, 2018.
63ALIMENTATION COUCHE-TARD INC. ACQUISITIONS COMPLETED DURING FY18 Value Creation
CST TRANSACTION SUMMARY & OVERVIEW

     Transaction Summary
     • Acquired 100% of the outstanding shares of CST Brands Inc.
       (“CST”),     representing   a    total    enterprise   value    of
       US $4.4 billion or approximately US, $4.2 billion excluding the
       value of CST’s equity participation in CrossAmerica Partners LP
       (“CAPL”).
     • In order to meet Canadian regulatory authorities’ requirements,
                                                                                                                      Gross Profits (2)
       ACT sold to Parkland Fuel Corporation a large portion of CST’s
       assets in Canada and retained 157 company-operated stores.
                                                                                                          5%
     • In order to meet US regulatory authorities’ requirements, ACT sold
                                                                                                                                           30%
       70 sites to Empire Petroleum Partners, LLC. And retained 1,106                                         54%
                                                                                                    41%
       sites                                                                                                                                     70%

     Strategic & Financial Impact
                                                                                             Merch. & Serv.    Fuel    Others             US     Canada
     • Transaction is expected to generate US$215M in annual
       synergies to be realized over the next 3 years
     • Provides ACT control over CAPL’s General Partner, ownership of
       associated Incentive Distribution Rights and equity stake of 21.4%
       in CAPL (CAPL is a distributor of branded and unbranded
       petroleum for motor vehicles in the U.S.)

         (1)   As of March 31, 2017. Excludes CrossAmerica Partners LP.
         (2)   LTM for the period ended March 31, 2017. Excludes CrossAmerica Partners LP.

65
• On December 22, 2017, Alimentation Couche-Tard Inc. acquired all the membership interest of
Holiday Stationstores, LLC and certain affiliated companies (“Holiday”). Holiday is an important
convenience store player in the Upper Midwest United-States, with 516 sites, 2 food
commissaries and a fuel terminal in Newport, Minnesota, which supplies one third of the stations.
At the closing of the transaction, 373 stores are operated by Holiday, 143 by franchisees and 27
by dealer contracts.
• Holiday has a strong car wash business with 234 locations at the closing date.
• Allows Couche-Tard to expand it’s geographic footprint into the Upper Midwest U.S. and to gain a
strong position in the Greater Twin Cities metropolitan area. The acquired sites are located in the
following states: Minnesota, Wisconsin, Washington State, Idaho, Montana, Wyoming, North
Dakota, South Dakota, Michigan and Alaska.
• The transaction have been completed in the third quarter of Couche-Tard’s fiscal year 2018. The
Corporation has financed the transaction by using its available cash and existing credit facilities.
66A DISCIPLINED CONVENIENCE STORE OPERATOR AND INTEGRATOR
Broad Geographic Track Record of Highly
Superior Product
Footprint with Leading Disciplined Growth and
Offerings
Market Positions Debt Reduction
Attractive Sector Powerful Financial Attractive Synergy
Dynamics Results Potential
Disciplined Management Proven Capacity to
Culture Transform and Innovate
Optimistically transforming our future
67You can also read