The South African Power Sector - Energy Insight Gabrielle Dyson - Energy and Economic Growth
←
→
Page content transcription
If your browser does not render page correctly, please read the page content below
The South African Power Sector
Energy Insight
Gabrielle Dyson

March 2020
EEG Energy Insight                                                                                        March 2020

Introduction to the complex dynamics of South Africa’s power sector

South Africa has the most developed electricity sector        well as by class. Post-apartheid governments have
in (sub-Saharan) Africa, with 54 gigawatts (GW)               rolled out various initiatives to extend services and
installed generation capacity, mostly from coal-fired         improve economic outcomes for poor
plants. This is almost half the total installed power in      (overwhelmingly black) populations, with mixed
sub-Saharan Africa.1 South Africa’s Department of             success. National electricity access rates grew rapidly
Energy has been celebrated internationally for its            from the mid-1990s to reach 86.1% in 2018 (jumping
competitive renewable energy auction programme,               47% in 20 years), thanks to ambitious programmes to
the Renewable Energy Independent Power Producer               provide grid connections in disadvantaged
Procurement Programme (REI4P), which over three               communities.3 Parallel policies in health and
rounds produced a 70% price reduction for renewable           educational access have tried to close the racial-
generation. Still, the power sector has ample room for        economic divide. But a quarter-century after the fall of
growth in renewable generation, which makes up just           apartheid, 10% of the population still own between
5% of total generation. This offers important                 70% to 95% of the country’s wealth.4 It is no
opportunities to decarbonise the energy mix, increase         coincidence that 9% of the population is recorded as
regional energy security, and create green jobs.              ‘white’ in the latest population census. 5 Meanwhile,
                                                              the poorest 60% control only 7% of the country’s
As the second largest African economy, South Africa’s
                                                              assets. Income per capita for black South Africans has
annual GDP growth has averaged 1.5% in the past
                                                              hovered constantly at around 15% of the average
decade.2 Growth has been especially stagnant in the
                                                              income of white citizens since 1996.6 Only a small
years since 2014, as chronic power generation
                                                              black elite have succeeded in overcoming these odds.
shortages have provoked successive waves of
scheduled load shedding. Targeted power cuts have             Wealth distribution, race, access, labour, and
affected all sectors in this period, contributing to          environmental health data add complex layers to the
acute unemployment rates. Globally-publicised                 challenge of power sector policymaking. Persistent
scandals of state capture and corruption, notably in          economic barriers to low-income groups create
the power sector, have exacerbated the economic and           unequal patterns of electricity use, benefits, and
financial uncertainties. Eskom, the embattled                 impacts among South African citizens and residents,
vertically-integrated power utility, faces unsustainable      with knock-on effects in other areas, including
debts and insecure supply levels as it recovers from a        economic, health, and environmental outcomes. Most
governance crisis that transformed its operations into        wealthy households use electricity—the cleanest
opportunities for rent-seeking.                               source of energy at the point of use—for lighting and
                                                              cooking, while the poorest households are forced to
The power sector in South Africa, one of the world’s
                                                              substitute dirtier sources to meet basic lighting needs.
most unequal countries, must grapple with major
                                                              Poor households also suffer disproportionately from
socioeconomic questions, as well as the traditional
                                                              air pollution from local coal plants, at levels that
financial and operational problems of infrastructure.
                                                              violate national air safety standards. With its coal-
The economy remains divided along racial lines, as

11
   Includes 48 GW Eskom-owned capacity; 4.8 GW municipal and privately-owned plants; 1 GW small distributed
generation set below 1 megawatts (MW). Eskom (2019) ‘Integrated Resource Plan 2019’.
www.energy.gov.za/files/docs/IRP%202019.pdf. Eberhard, A. (2018) ‘IPP Investment Trends and Lessons in SSA’.
2
  Average annual percentage growth of 1.5% from 2008 to 2017, projected to remain around at 1.7% in 2020.
https://data.worldbank.org/indicator/NY.GDP.MKTP.KD.ZG?end=2018&locations=ZA; World Bank (2019) ‘The World
Bank in South Africa’, available [online] at: www.worldbank.org/en/country/southafrica/overview
3
  Department: Energy, Republic of South Africa, www.energy.gov.za/
4
  Orthofer, A. (2016) ‘Wealth Inequality in South Africa: Insights from Survey and Tax Data’,
www.redi3x3.org/sites/default/files/Orthofer%202016%20REDI3x3%20Working%20Paper%2015%20-
%20Wealth%20inequality.pdf
5
  Statistics South Africa (2012) ‘Census 2011. Census In Brief’,
www.statssa.gov.za/census/census_2011/census_products/Census_2011_Census_in_brief.pdf
6
  Financial Times ‘Black South Africans lose out as economic divide bites’, www.ft.com/content/42ef27d2-6c13-11e9-
a9a5-351eeaef6d84

© Applied Research Programme on Energy and Economic Growth                                                           2
EEG Energy Insight March 2020
centred generation mix, South Africa is the 14th out a scoping study on behalf of the UK Department
greatest greenhouse gas emitter worldwide. 7 But for International Development in South Africa, as well
black workers also represent the majority of workers as in several other countries. The scoping study for
in coal mining and coal power plant operations, South Africa provides key socioeconomic information
meaning a transition away from coal could hurt black and context, followed by an overview of the power
communities hardest, unless it is accompanied by sector, including its structure, key actors and policies,
measures to educate, reskill, and provide alternative and the main challenges it is facing. This paper
employment opportunities to coal workers. The presents the key characteristics and challenges in the
solutions needed to fix the sector’s ongoing power South African power sector, as well as the
supply and governance challenges must also take opportunities for transitioning the sector towards a
these dimensions into account, in order to develop just future.
nuanced mechanisms for a ‘just transition’ to build an
The sections that follow offer an overview of the
equitable, climate-resilient, low-carbon economic
institutional structure and legal and policy
future.
environment of the South African power sector, as
Recent policy and strategy documents outline well as some key data on supply and demand, before
pathways for South Africa’s long-term development, discussing the different dimensions of Eskom’s crisis
including through reforming the power sector in line and the solutions needed for a just transition to a low-
with a ‘just transition.’ The 2012 National carbon electricity future.
Development Plan (NDP), and the 2019 Roadmap for
Eskom in a Reformed Electricity Supply Industry Institutional structure
(RERESI) and Integrated Resource Plan (IRP) 2019,
prioritise investment in energy infrastructure to The vertically-integrated, state-owned national power
secure decent jobs and deliver reliable, efficient, and utility, Eskom, dominates the South African power
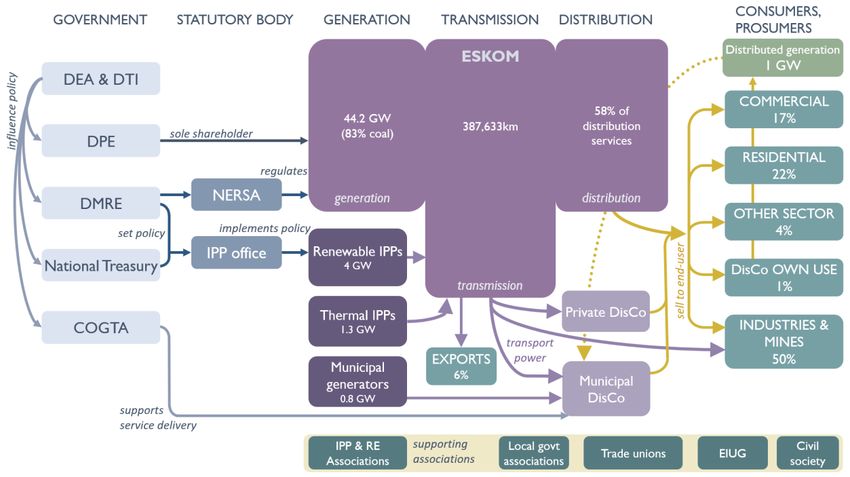
affordable electricity. They also underline the need for sector (see the structure of key sector actors in Figure
greater social equity through expanding access to 1). As a public company, Eskom is subject to national
affordable energy, and call for reducing pollution to legislation and regulations. Eskom owns and operates
protect environmental sustainability. The RERESI in 90% of total generation capacity, as well as all 387,633
particular outlines reforms to unbundle the state- km of transmission lines in the country, supplying
owned monopoly utility by establishing an power to large industrial consumers and to other
independent transmission company to operate South African distribution utilities, and exporting to
transmission and carry out power planning, the Southern African Power Pool (SAPP). As a
procurement, and contracting functions, separate distributor, Eskom also sells power to retail residential
from generation and distribution entities. The and commercial customers.
document envisions a transformation of the power
sector through scaling up utility-scale generation from The sector operates as a hybrid between a natural
renewables, managed through smart grids with monopoly and single-buyer model, where privately-
flexible baseload and storage facilities, as well as well- owned independent power producers (IPPs) are
tuned distribution business models and electricity allowed to generate and sell electricity to the Eskom-
pricing mechanisms to allow sustainable growth of owned grid in parallel to Eskom’s incumbent
distributed generation.8 generation capacity. Alongside Eskom, 186 companies
are licensed to distribute and sell power to
This article is a product of the Energy and Economic consumers, including 173 municipal or local
Growth (EEG) applied research programme, which
addresses policy questions in low-income countries to
help shift energy systems towards a more sustainable,
efficient, reliable, and equitable paradigm. EEG carried
7
Carbon Brief (2018) ‘2015 figures. The Carbon Brief Profile: South Africa’, www.carbonbrief.org/the-carbon-brief-
profile-south-africa [Accessed 15 October 2019].
8
South African Department of Public Enterprises (2019) ‘Roadmap for Eskom in a reformed electricity supply
industry’, https://m2u7e2f8.stackpathcdn.com/wp-content/uploads/2019/10/ROADMAP-FOR-
ESKOM_0015_29102019_FINAL1.pdf
© Applied Research Programme on Energy and Economic Growth 3EEG Energy Insight March 2020
government service providers and 13 private
distributors.9
Figure 1. The structure of the South African electricity sector and key sector entities
Source: OneWorld, 2019
IPPs have increasingly participated in the sector since embedded generation (SSEG)). SSEG installations
the Government launched a large-scale renewable under 1 MW can interconnect to the distribution grid,
energy auction programme in 2011, but they still feeding power back in under certain circumstances.
produce less than 5% of electricity. End-users and Such customers (known as ‘prosumers’) both consume
distribution companies also increasingly invest in grid power and produce their own.
distributed generation of electricity (or small-scale
Table 1. Actors involved in shaping or implementing policy in the South African power sector
Institution Role/mandate in the electricity sector
Policy-setting and planning bodies
National Treasury Manages public spending and approves departmental budgets.
Department of Mineral Resources and Drafts power sector legislation, policies, and plans, including pricing
Energy policy for National Energy Regulator of South Africa (NERSA) to
regulate tariffs, to secure sustainable energy and mineral resources.
Oversees: IPP Office Conducts competitive procurement for new generation from IPPs.
Sole shareholder of Eskom; oversees efficiency and financial
Department of Public Enterprises (DPE)
sustainability of all state-owned enterprises.
Dept. of Cooperative Governance and
Supports municipalities to deliver core services of electricity supply.
Traditional Affairs
Drafts legislation on air quality standards, and promotes clean,
Department of Environmental Affairs
efficient energy in line with international obligations.
Drafts commercial and industrial policy to promote inclusive and
Department of Trade and Industry
equitable economic development.
9
StatsSA (2016) ‘The state of basic service delivery in South Africa: In-depth analysis of the Community Survey 2016
data’.
© Applied Research Programme on Energy and Economic Growth 4EEG Energy Insight March 2020
Expert advisory body to draft, promote, and monitor
implementation of the NDP.
National Planning Commission
Consults public on pathways for a just transition in line with the
NDP.
State-owned enterprise
Vertically-integrated state-owned electricity generation, transmission,
Eskom
distribution, and retail company.
Statutory regulatory agencies
Regulates and determines electricity tariffs following Electricity
Pricing Policy.
NERSA Grants licences for generation, transmission and distribution
operators according to the IRP.
Sets and monitors technical supply and service standards.
Private sector, civil society, unions
Various IPP associations advocate for IPPs’ interests in the country,
Renewable energy industry and IPP
e.g. to improve the policy environment for private participation, run
associations
transparent auctions, and increase renewable energy share in the IRP.
Represents large industrial and mining customers of Eskom, which
collectively make up 40% of Eskom sales.
Energy-Intensive Users Group
Lobbies for favourable prices for large industrial customers, and
now backs regulatory reforms for competition from IPPs.
Advocate for electricity sector workers’ interests and on the
affordability of power.
Trade unions
Oppose Eskom restructuring and decommissioning of coal
generation due to expected job losses.
Various community groups and non-governmental organisations voice
Community, social, and environmental civil society concerns, including for social and environmental justice in
groups realising a just transition, e.g. the Centre for Environmental Rights,
Earthlife Africa, Greenpeace, Project 90 by 2030.
Policy and planning environment
Policy, legislation, planning, and strategy documents shape the regulatory environment of the sector. Table 2
describes key documents that outline future planning and regulatory frameworks for sectoral regulation.
Table 2. Key documents defining the policy, planning, and regulatory environment
Document Year Provisions/function
Sets goals for energy investing to ensure reliable, efficient, and
affordable electricity delivery for economic growth and social equity.
Notes the need to reduce energy-related pollution and greenhouse gas
emissions to mitigate climate change impacts, in line with Nationally
NDP 2030 2012
Determined Contributions (NDC) to the United Nations Framework
Convention on Climate Change.10
Creates an independent transmission system operator, endowed with
power planning, procurement, and contracting functions.
10
The NDC outlines emissions reductions targets over a 15-year timeframe, through diversifying and transforming the
electricity mix to ensure energy security and environmental health. It identifies mechanisms to reduce emissions
through investment in energy efficiency, renewable generation, nuclear energy, and advanced biofuels.
© Applied Research Programme on Energy and Economic Growth 5EEG Energy Insight March 2020
Detailed vision of electricity sector, drafted through expert and public
IRP 2010–2030 consultation, laying out a 20-year plan to allocate future power
generation needs and priority sources.
Offers a legal basis for generation procurement for Eskom and the IPP
2011
Office, guiding investments across the power sector and defining the
overall generation mix.
Updated: Updates to the IRP often face uphill battles due to the politically-charged
nature of the sector.
Generation capacity additions of 39.7 GW from 2019 to 2030.
Ease the impact of decommissioning coal plants to protect the security
and stability of the future power grid (recognising promise of new
generation).
Prioritise private generation investments (except in nuclear power).
Add 7.2 GW new coal sources, 1.9 GW of nuclear (extending life of
IRP 2019 2019 Koeberg Power Station), and 3 GW of gas/diesel turbines.
Add 25.4 GW from renewable generation, including 2.5 GW from
hydropower (through interconnection with the Democratic Republic of
Congo), 22.9 GW from wind, solar PV, and concentrated solar power.
Add 2 GW of storage capacity and 500 MW/year other capacity
additions, e.g. distributed generation (from retail, commercial, and
industrial customers), co-generation, biomass, and landfill (waste-to-
energy).
Sets out steps for long-term sector sustainability, including restructuring
Eskom.
Sets out incremental process to separate Eskom’s core functions of
generation, transmission, and distribution into distinct subsidiary
entities.
Created a separate transmission operator in March 2020 to fulfil role of
RERESI, DPE 2019 purchasing, system operation, and grid management.
Legally separates generation, transmission, and distribution entities by
2021.
Offers a much-needed package of fiscal injections amounting to 105
billion South African Rand (ZAR) (US$ conversion) to service debt
obligations, determined by National Treasury and DPE and according to
Eskom’s performance, restructuring, and cost reduction.
Defines NERSA’s powers and functions of tariff-setting, licensing, and
setting technical standards.
Empowers ministers responsible for energy to determine how much
energy may be procured in a certain timeframe, and the authorised
parties to the transaction.
Electricity Pricing Policy (2008) outlines tariff-setting and pricing
Electricity Regulation Act 2006
methodologies.
Only awards generation licences to new plants according to the capacity
allocation defined by the IRP’s planned generation mix.
SSEGs of up to 1 MW are exempt from licensing requirements, reducing
obstacles for third parties to connect small renewable generation
facilities to the grid.
© Applied Research Programme on Energy and Economic Growth 6EEG Energy Insight March 2020
Power supply, sales, and demand
Abundant and historically cheap coal continues to fuel natural intermittency). The REI4P renewables auction
just under three-quarters of South Africa’s total programme—conducted in three rounds since 2011—
installed generation capacity of 54.2 GW (see Figure 2 has allowed Eskom to procure privately-financed
for a breakdown by source). Its coal-heavy generation renewable generation at increasingly competitive
mix serves to rank South Africa as 14th greatest global prices.12 This has made a small dent in the dominance
greenhouse gas emitter.11 Renewable technologies of coal, which generated 83% of electricity output in
make up around 8% of installed capacity but still only 2019, compared to over 88% in 2013.13
contribute 5% of total electricity supply (due to their
Figure 2. Breakdown of South Africa’s total generation capacity
Department of Mineral Resources and Energy (2019b) IRP 2019. https://t.co/PCXvWbKPaV
Eskom owns and operates 29 power plants—89% of (distribution service providers) buy 42% of Eskom’s
total generation capacity—most of which are coal- electricity, and heavy load industry and mining
powered, as well as Koeberg, the continent’s only customers buy about 40%. Eskom also distributes
nuclear power plant. IPPs and private industrial electricity directly to some residential and commercial
generators (such as co-generation plants at pulp and customers.
sugar refineries, as well as solar PV installations) own
Exports make up 6% of Eskom’s sales. In 2019, it
about a tenth of installed capacity, while
exported 12,461 GWh of electricity to SAPP, the
municipalities own just 1%. Distributed generation or
longest-serving multilateral trading platform on the
SSEG, such as solar PV systems and diesel generators,
continent.15 In the same period, Eskom imported
is growing and now totals 1 GW.14
7,355 GWh from neighbouring Lesotho, Mozambique,
Eskom’s total electricity sales were 208,319 GW per Zambia, and Zimbabwe. With Eskom’s installed
hour (GWh) in 2019 and have declined progressively capacity representing 80% of the total in SAPP, South
since 2007. Electricity sales per capita have declined Africa plays an important role to address supply
by 7% in the past two years alone. Municipalities shortages among its neighbours. Conversely, South
11
Carbon Brief (2018) ‘The Carbon Brief Profile: South Africa’, www.carbonbrief.org/the-carbon-brief-profile-south-
africa.
12
Eberhard, A., Gratwick, K., Morella, E., and Antmann, P. (2017) ‘Independent Power Projects in Sub-Saharan Africa:
Investment Trends and Policy Lessons’, Energy Policy 108, pp. 390–424, https://doi.org/10.1016/j.enpol.2017.05.023.
13
StatsSA (2018) ‘Electricity: Coal use inches lower as solar, wind and diesel rise’, www.statssa.gov.za/?p=11292;
Eskom (2019) ‘Integrated Report’, www.eskom.co.za/IR2019/Documents/Eskom_2019_integrated_report.pdf
14
GreenCape (2019) ‘Energy Services 2019 Market Intelligence Report’,
www.greencape.co.za/assets/Uploads/ENERGY-SERVICES-MARKET-INTELLIGENCE-REPORT-WEB.pdf
15
Eskom (2019) ‘Integrated Report’, www.eskom.co.za/IR2019/Documents/Eskom_2019_integrated_report.pdf
© Applied Research Programme on Energy and Economic Growth 7EEG Energy Insight March 2020
Africa’s recent supply challenges represent a threat to in sub-Saharan Africa (aside from Cabo Verde, a small
the whole region’s energy security. island state). Rural access rates (77%) still hover at
around 20% below those of urban areas, having
Access, demand, and consumption increased almost three-fold since the massive
electrification programme was rolled out in the 1990s
With 86% of the population connected to the grid, following the end of apartheid.
South Africa has the highest rate of electricity access
Figure 3. South Africa electricity access compared to sub-Saharan continental average
100
80
60
40
20
0
South Africa Sub-Saharan Africa
Source: World Bank, Sustainable Energy for All (SE4ALL) database from the SE4ALL Global Tracking Framework led jointly by the World Bank,
International Energy Agency, and the Energy Sector Management Assistance Program
Demand, and consumption in turn, have shrunk since consumption to compensate. For example, some have
2007, in part due to stagnating economic growth. practised fuel switching to liquefied petroleum gas
Rising tariffs—trying to catch up with Eskom’s (LPG) for cooking, water and general heating
ballooning operating costs, including coal and purposes. Those with capital have invested in SSEG,
salaries—have contributed to declining demand. including solar PV and diesel generators. While retail
Tariffs have risen sharply, nearly three-fold since 2007, consumers and businesses are dismayed at Eskom’s
in real terms (see Figure 4). Large commercial and financial mismanagement, which has caused their
industrial customers have made energy efficiency power bills to spike, Eskom recently won a court battle
investments to reduce their growing electricity costs. against the regulator, NERSA, which will mean
Households have also adapted their energy electricity tariffs increase even more in future years.16
Figure 4. Average tariff increases from 1970 to 2018
80
60
40
20
0
% annual increase Nominal c/kWh Real 2017 c/kWh
Eskom (2019) ‘Tariff History: Historical Average Price Increase’, www.eskom.co.za/CustomerCare/TariffsAndCharges/Pages/Tariff_History.aspx
1616
Reuters 92020) ‘South African court sides with Eskom in 2018/19 tariff dispute’,
https://af.reuters.com/article/southAfricaNews/idAFL8N2B34UE
© Applied Research Programme on Energy and Economic Growth 8EEG Energy Insight March 2020
Eskom’s debt and governance crises to shore up its balance sheet. Eskom, as a monopoly
that is considered too big to fail, continues to impose
Eskom’s supply shortages have escalated since 2014, an unsustainable burden on the state, which bails out
resulting in major load shedding programmes that the utility at every turn.
have disrupted electricity supply and, by extension,
Electricity tariffs present a problem, rather than a
the wider economy. This not only knocks business
clear pathway to increase Eskom’s revenues. NERSA
productivity, but also harms ordinary residential
has approved above-tariff hikes to catch up with ever-
customers, who lose access to essential services for
growing power sector debt and operating costs, but
hours at a time. Inadequate maintenance, and failure
tariffs still fail to cover the utility’s costs. At the same
to build new capacity, combined with widespread
time, electricity is increasingly unaffordable for
mismanagement, have left the utility unable to meet
average South African households. Those customers
demand, despite steadily slowing consumption. The
who can afford to avoid increasing power costs
successive waves of load shedding since 2014 are
(usually larger, more lucrative accounts) reduce their
estimated to have cost the economy from ZAR 140 to
grid consumption by investing in SSEG or energy
281 billion (around US$ 9.4 to 18.9 billion).
efficiency upgrades—in turn, reducing Eskom’s
The supply crisis results in part from the utility’s revenue through sales.
financial and governance crises. Widening debt
squeezes its ability to invest in new capacity and in the
The power sector’s contribution to
maintenance of existing plants. Meanwhile, electricity
inequality and environmental justice
sales are slowly shrinking, just as its debts and
operating costs have continued to grow.17 Eskom’s
Electricity poverty in South Africa remains endemic:
labour costs, per employee, increased by 145% from
16% of the population still lack electricity access, with
2007 to 2019; and coal costs grew by 485%, even
electricity use divided by class and race. The large
though coal purchases remained stagnant. These
minority without power connections are poor black
dynamics have contributed to Eskom’s debt ballooning
communities in remote areas or overcrowded shanty
by 988%, while revenues have increased by only 357%.
towns (often bordering wealthy urban suburbs). The
Eskom generates less than half of the cash it needs to
richest 20% of South Africans overwhelmingly use
cover its debt obligations.
electricity for lighting and cooking (over 90% of rich
The debt crisis has shone a light on rent-seeking and households), compared to only 73% (for lighting) and
patronage scandals that have engulfed the power 55% (for cooking) among the poorest 20% of
utility and damaged its reputation. Eskom’s households.20 Electricity-poor households must resort
governance structures, designed to create barriers to to dirtier or costlier alternatives like biomass and
transparency in the pre-democratic era, helped to paraffin. The same households that lack a connection
entrench and intertwine political and industrial to the grid also experience disproportionate
interests.18 Conditions were ripe for managers to take unemployment and lower access to healthcare and
advantage of the utility’s monopoly on power education. Delivering electricity to those populations
production, leading to major fraud allegations represents an essential means to power
surrounding both Eskom directors and national complementary services and offer opportunities for
leaders.19 Eskom’s credit rating fell into junk territory,
further complicating efforts to secure external funding
17
Eskom (2019).
18
Lawrence A. (2020) ‘Eskom and the Dual Character of the South African State’. In: South Africa’s Energy Transition.
Progressive Energy Policy, Palgrave Pivot, Cham.
19
The Economist (2019) ‘A decade of “state capture” has damaged South Africa’s institutions’,
www.economist.com/special-report/2019/04/25/a-decade-of-state-capture-has-damaged-south-africas-institutions;
BBC News (2019) ‘Eskom crisis: Arrests over $50m South Africa power station “fraud”’, www.bbc.com/news/world-
africa-50854186
20
Department of Energy (2012) A survey of energy-related behaviours and perceptions in South Africa: The Residential
Sector,
www.energy.gov.za/files/media/Pub/Survey%20of%20Energy%20related%20behaviour%20and%20perception%20in
%20SA%20-%20Residential%20Sector%20-%202012.pdf
© Applied Research Programme on Energy and Economic Growth 9EEG Energy Insight March 2020
development, through improved healthcare, The plan also prepares the sector to adapt to, and take
education, and entrepreneurial conditions. full advantage of, new disruptive innovations. These
promise pathways to decarbonise the economy
Pollution and environmental inequalities pose further
through a ‘just’ and ‘green’ transition, notably thanks
problems for the power sector. South Africa is likely to
to renewable generation at utility scale and SSEG,
experience more intense climate change effects than
storage, and smart grids.
the global average, and will suffer those effects more
intensely than wealthier, advanced economies in the Disruptive technologies are changing energy sectors
global North.21 Yet Eskom’s coal power plants worldwide beyond recognition, notably with the
routinely violate legal minimum emissions standards changing economics of wind and solar technologies. At
for air quality.22 This disproportionately harms poor a global level, these innovations light the way for a
communities that live and work near coal plants, and transition away from fossil fuel-based generation.
exacerbates South Africa’s struggle to meet its NDC They also offer power consumers new opportunities
targets for reducing greenhouse gas emissions under to take a role in selecting the source (with competition
global climate change conventions. At the same time, from ‘green’ providers at retail level), or even to invest
South African labour unions fiercely protect the coal in their own power generation through SSEG, storage,
industry, which holds a central place in the country’s or community-based solutions. SSEG such as solar PV
political economy and accounts for over 130,000 (including for residential, commercial, and industrial
jobs.23 customers) also challenge the traditional distribution
model by disrupting daily demand curves, reducing
A just, green transition in South Africa revenues from electricity sales, and requiring
investment in low-carbon backup technologies to
The structural failures, political patronage networks, support the intermittency of renewable generation. At
and entrenched socioeconomic inequalities that have a larger scale, renewable technologies offer industrial
grown around the power sector call for urgent, well- customers a new way to interact with the power
planned reform to allow a just transition to a low- system, as well as providing opportunities for IPPs to
carbon power sector. The President’s Eskom invest and sell power to the grid or specific customers.
Sustainability Task Team has outlined strategies to Small renewable-powered systems with storage for
achieve such a transition. Notably, it proposes a off-grid applications (including mini-grids and
restructuring plan to separate the transmission system standalone solar-powered systems) offer ways to
operation, planning, and power procurement from supply electricity in under-electrified rural or urban
generation ownership and operation, and from communities. Such off-grid models can be scaled up
distribution concerns. The proposed structure is through licensed and regulated private or third-party
designed to free up the system operator to buy least- providers, in the right regulatory conditions. Publicly-
cost electricity, through fair, transparent, and funded models can also expand off-grid services
competitive procurement (by removing pre-existing through targeted funding or subsidy mechanisms, to
interests in Eskom’s own generation plants). However, be rolled out by existing distribution companies or
the Government has not yet taken further concrete specially-mandated rural electrification bodies. These
measures to unbundle Eskom and to create more service models will offer South Africa new tools for
competition. serving the most marginalised and vulnerable
21
Maure, G., Pinto, I., Ndebele-Murisa, M., Muthige, M., Lennard, C., Nikulin, G., Dosio, A., and Meque, A. (2018) ‘The
southern African climate under 1.5 ◦C and 2 ◦C of global warming as simulated by CORDEX regional climate models’,
Environmental Research Letters.
22
The National Environmental Management Act: Air Quality Act (Act No. 39 of 2004) requires coal power plants to
meet emissions standards, or be declared non-compliant and lose legal right to operate. Sahu, R. (2018) ‘Eskom Power
Station Exceedances of Applicable Atmospheric Emission License (AEL) Limit Values for PM, SO2 & NOx During April
2016 to December 2017’, https://cer.org.za/wp-content/uploads/2018/12/Eskom-plant-exceedances-of-AEL-Limits-
Ron-Sahu-15-November-2018.pdf
23
Strambo, C., Burton, J., Atteridge, A. (2019) ‘The end of coal? Planning a “just transition” in South Africa’, SEI report,
www.sei.org/wp-content/uploads/2019/02/planning-a-just-transition-in-south-africa.pdf
© Applied Research Programme on Energy and Economic Growth 10EEG Energy Insight March 2020
populations, which too often miss out on the wishing to invest in disruptive power infrastructure
economic benefits of electricity services. technologies at any scale—from utility-scale
renewable generation to off-grid generation and
The changing landscape of tomorrow’s power sector
distribution systems, as well as storage, SSEG, and
in South Africa calls for urgent policy and regulatory
energy efficiency service providers—need clear
certainty. Incumbent distribution service providers
regulatory and policy signals about market entry
need forward-looking regulatory guidance through
options, licensing, grid connection, and service
tariffs and updated service standards to evolve their
standards. Future policies for implementing this just,
business models. This will allow them to continue to
green transition must take into account the need to
serve existing customers with affordable electricity
reskill, educate, and offer new job opportunities to
services, and to expand their service offering, such as
communities that risk losing livelihoods associated
to provide ‘backup’ grid services to SSEG owners, or
with the coal industry.
even to offer energy efficiency services. Other actors
About the author
Gabrielle Dyson is a specialist in electricity economics and policy, and is Energy Transition Consultant at the University
of Cape Town’s Power Futures Lab. As founder of Paris-based social science research group kōtare.network, her work
explores the agriculture-energy-water nexus, global and local inequalities, and pathways towards an inclusive,
sustainable global economy. Gabrielle leads research and consulting projects to advise government agencies and
international organisations on the themes of renewable energy, electrification, and inclusive development. She has
analysed energy and environmental policy in dozens of developing and small island countries across sub-Saharan
Africa, South Asia, Latin America and the Caribbean, and the Middle East. Her latest paper on the development
impacts of electricity was recently published by CDC Group (UK). Other recent clients include the Africa-Europe Energy
Partnership, the African Development Bank, and the World Bank. Gabrielle holds a M.Sc. in environmental policy from
the University of Oxford.
Front cover image: Roger Sedres / Alamy
The views expressed in this Energy Insight do not necessarily reflect the UK government's official policies.
© Applied Research Programme on Energy and Economic Growth 11You can also read


