HOW AMERICA'S 4G LEADERSHIP PROPELLED THE U.S. ECONOMY - CTIA
←
→
Page content transcription
If your browser does not render page correctly, please read the page content below
HOW AMERICA’S 4G LEADERSHIP
PROPELLED THE U.S. ECONOMY

Introduction

Today, the United States is a global leader in 4G wireless. Our 4G leadership has created
millions of jobs and literally changed the trajectory of the wireless industry’s economic impact.
With 4G leadership, American companies set the pace for global innovation—built on the hard
work of American wireless carriers and sufficient spectrum with flexible use characteristics.

In earlier mobile generations—2G and 3G—other countries and regions led the world in wireless
and reaped the economic benefits that leadership entailed. But these countries and regions did
not maintain their wireless leadership as mobile generations evolved—and jobs were lost and
economic momentum was stalled.

In this report, we examine how American companies shifted from lagging in earlier wireless
generations to seize global 4G leadership. The answer is clear: industry innovation and
investment as well as by smart wireless policymaking. In addition, we delve into what makes
leadership in a generation of wireless so important, with particular focus on exploring the
economic value of US 4G leadership and the costs other countries have incurred by losing
wireless leadership.

This all underscores the importance of America retaining its wireless leadership as the transition
to 5G networks occurs. The stakes are high for American consumers, companies and the
country’s global competitive position. The performance of a country in one generation is not a
guarantee of success in the next generation. In fact, no country or region has—to date—held
global leadership in consecutive generations of wireless.

Economic Benefits of America’s 4G Wireless Leadership

    •   Growing the Economy: US leadership in 4G accounted for nearly $100 billion of the
        increase in annual GDP by 2016 as the trajectory of the wireless industry’s contribution to
        US GDP shifted from a projected $350.3 billion in 2016 to a realized $445.0 billion.
    •   Creating Jobs: The launch of 4G in the US increased total wireless-related jobs by 84%
        from 2011 to 2014.
    •   Increasing Domestic Revenues: US 4G leadership also meant roughly $125 billion in
        revenue to American companies that could have gone elsewhere if the US hadn’t seized
        4G leadership. US 4G leadership also resulted in more than $40 billion in additional app
        store revenue flowing to US companies and app developers.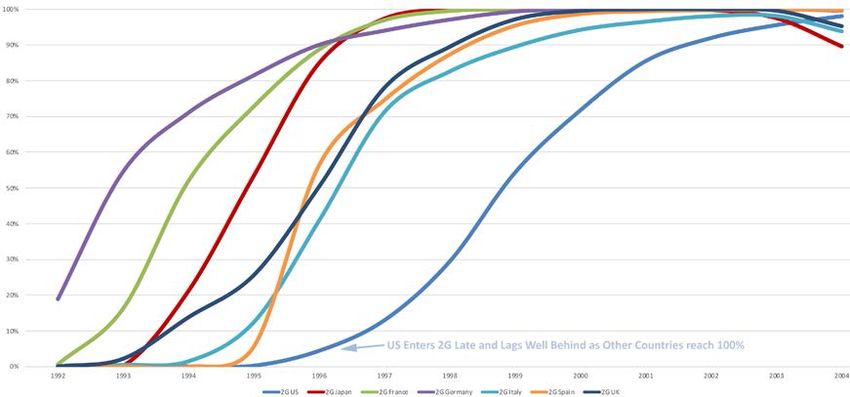
How America’s Leading Position In 4G Propelled the Economy | April 16, 2018                                                                        2

HOW AMERICA’S 4G LEADERSHIP PROPELLED THE U.S. ECONOMY ..............................1

Introduction ...................................................................................................................................... 1
   Economic Benefits of America’s 4G Wireless Leadership ................................................................... 1

Wireless Generations Ebbs and Flows ................................................................................................. 3
  Europe Wins in the 2G Era .............................................................................................................. 3
  Japan Takes the Lead in 3G ............................................................................................................. 4
  The US Comes on Strong and Leads 4G ............................................................................................ 6

The Benefits of the US Winning 4G Leadership .................................................................................... 9
  A Remarkable Expansion in Wireless-Related Employment Continues .............................................. 10
  4G Has Driven Costs Down, and Usage Up ...................................................................................... 10

The Costs of Losing Generational Leadership..................................................................................... 12
  What does it mean to lose generational leadership? ....................................................................... 12
  Lucent ......................................................................................................................................... 12
  Europe Loses Its Lead: The OS Ecosphere as a Symbol and Symptom................................................ 14

Conclusion: What 5G Leadership Could Mean for the US ................................................................... 16
  Is the US Ready for the 5G Era? ..................................................................................................... 16
How America’s Leading Position In 4G Propelled the Economy | April 16, 2018                        3

Wireless Generations Ebbs and Flows

Significant economic benefits—GDP and jobs—have flowed to the global leader in each wireless
generation. When those regions/countries lost their mobile leadership, their economies took a hit.
This paper will detail each wireless generation from 2G onward to reveal those patterns and
outline the real-world effects the timing of a country’s entry into a generation had on its mobile
ecosystem, consumers, and economy.

Specifically, we will show how an early entry benefits a country, its consumers and its mobile
players. At the same time, we will describe how a late entry, or a poorly coordinated entry,
harmed those same constituents and their economic positions.

Europe Wins in the 2G Era

Europe led the world in 2G. The European community and its manufacturers adopted a single
digital standard—GSM—and common spectrum bands to establish a broad base of networks and
users to serve as the foundation for technological innovation.

Germany was first in 2G, with France, the UK, Italy, Spain and other European countries’ carriers’
2G networks all up and running with substantial adoption ahead of other countries and regions.
By the mid-1990s, Europe had the most widespread adoption of 2G, with key European countries
reaching 80% penetration.

Disjointed approaches to wireless standards and poor regulatory policies hindered other
countries’ 2G efforts. Japan went its own way with the PDC standard. The US fragmented on
standards by using TDMA, CDMA, iDEN, as well as GSM. 1 In addition, FCC regulations required
analog 1G networks to be kept operational in the US longer than necessary.

To compare the different trajectories, in December 1994, the US had 0.1% digital wireless
penetration and Germany had 71% penetration. The US reached 86% penetration in 2001; by
contrast, Germany had reached 100% a year earlier, in 2000. The US was so far behind that it
was still adding customers to 2G technologies when other countries were already transitioning to
3G (see Exhibit 1).

2G leadership imparted significant economic benefits to Europe. European consumers and
companies, like Nokia and Ericsson, reaped the benefits of technology leadership because they
How America’s Leading Position In 4G Propelled the Economy | April 16, 2018                       4

 EXHIBIT 1: 2G Adoption Curve—US, Japan, France, Germany, Italy, Spain, UK

 Source: Ovum Forecaster, 2017 and Recon Analytics analysis

had the most advanced networks supporting the most advanced devices at an earlier date. This
meant that technologies often would be developed and rolled out in Europe well in advance of
release in the US or elsewhere.

This innovation leadership yielded tangible economic benefits for European countries, including
the strong economic contributions of wireless manufacturers to their balance of trade, the
employment of hundreds of thousands, and the generation of intellectual capital and property
rights.

2G leadership enabled the rise of the European wireless tech industry, ranging from Nokia,
Ericsson, Alcatel, and Siemens, which employed hundreds of thousands of people. In 1993
Ericsson accounted for 60% of the global market for digital cellular equipment, while Nokia
became the largest mobile phone supplier in Europe, and second largest in the world. 2 By the
end of the decade, Ericsson accounted for 50% of global GPRS (2.5G) sales, as well. 3 That year,
in 2000, Nokia’s exports were 24% of total Finnish goods and service and approximately 80% of
the telecommunications equipment the country exported. 4 Nokia shares also made up 70% of the
market value of the Helsinki stock exchange. At one point, the Helsinki stock exchange removed
Nokia—representing more than half of the market capitalization of companies listed at the
Helsinki stock exchange—from its index because that index reflected the performance of Nokia
more than the Finnish economy as a whole.

Maintaining wireless leadership is not easy, however. As mobile networks and devices grew more
powerful, the importance of mobile operating systems (OSs) increased. While Europe was a
pioneer with the Symbian operating system, it failed to assemble the pieces (a common user
interface (UI) and a means of finding and downloading diversely-developed apps) necessary to
grow the market for vertical services that would ultimately be developed elsewhere. This new
market for vertical services would give Japan an opening to seize leadership in 3G.

Japan Takes the Lead in 3G

While European operators spent heavily on 3G wireless licenses, they become hesitant when it
was time to invest in actually building 3G networks because they viewed the business case as
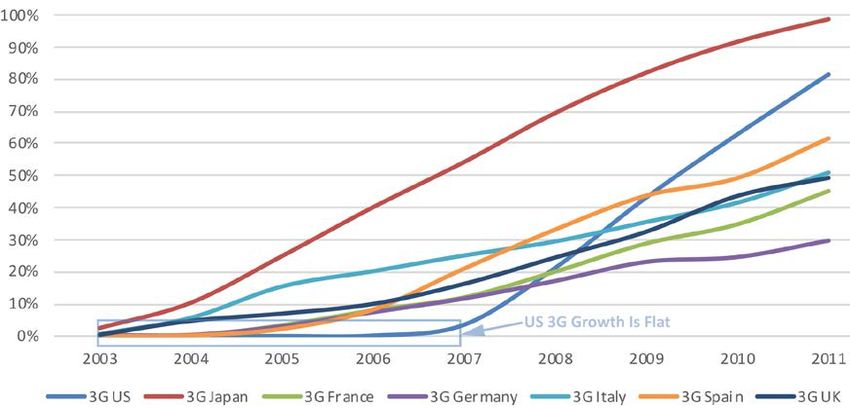
How America’s Leading Position In 4G Propelled the Economy | April 16, 2018                    5

uncertain. This was partially because Europe had not built an effective ecosphere around the
Symbian operating system.

EU operators were also restrained by a regulatory requirement tying a specific network
technology to a spectrum band. This forced EU operators to wait for a specific 3G auction and
required them to win that auction in order to deploy 3G services, rather than being able to
repurpose 2G spectrum to deploy 3G. This drove up the cost of licenses and delayed deployment
at the same time, harming consumers with a belated roll-out of more expensive service.

Japan seized this opportunity with a new way to monetize mobile. In 1999, in the late stages of
2G, i-mode was created and provided Japanese carriers with the business cases needed to spur
investment in new 3G networks. Japan’s i-mode trail-blazed social networking and music
services. i-mode’s closed ecosystem made it very straightforward for companies to get paid for
their services and consumers to pay for services rendered.

Consumers that used an i-mode service—ranging from directions to social networks—paid on a
per-packet basis and partner companies received 91% of the proceeds. This led to rapid adoption
of the i-mode service and a proliferation of services that utilized the carrier’s network. i-mode
developers were earning $9 billion a year by 2007 and $12.8 billion by 2008.

Japan saw the launch of three 3G networks in the space of just over a year, from October 2001 to
December 2002, as network operators invested in “infrastructure development and user-oriented
R&D [to support] high speed mobile Internet or handsets to use e-payment and entertainment
services anywhere at any time.” 5

With this cycle of momentum in the mobile ecosystem, Japan quickly reached 50% 3G
penetration in 2007. At the same date, Germany had only 12% and Italy had 25% 3G adoption. In
contrast, the US had 3.5% penetration of 3G in 2007—the same year the 2G iPhone was
launched. A year later, the 3G iPhone was launched, along with the app store, and the revolution
advanced with networks and devices evolving in tandem. In the wake of the iPhone launch and
the subsequent smartphone revolution, a mere four years later the US reached 82% 3G
penetration, second only to Japan, which had 99% penetration.

In contrast, by 2011 European countries had 3G penetration rates that ranged between 29% and
61%. A look at the adoption curve of 3G shows the fast start Japan had and how much the US
lagged and then made solid progress. Indeed, from 2003 to 2006, the US was essentially flat (see
Exhibit 2).
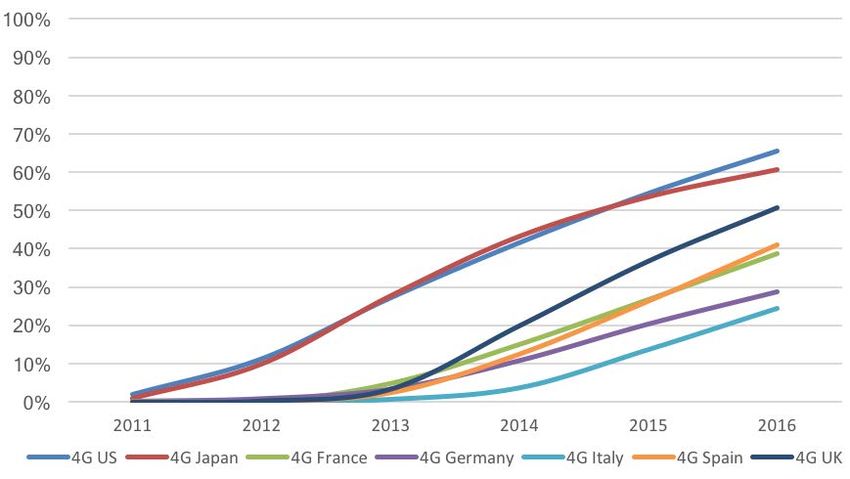
How America’s Leading Position In 4G Propelled the Economy | April 16, 2018                        6

 EXHIBIT 2: 3G Adoption Curve—US, Japan, France, Germany, Italy, Spain, UK

 Source: Ovum Forecaster, 2017 and Recon Analytics analysis

The US Comes on Strong and Leads 4G

While the US had been slow to roll-out 3G, they corrected their error, as advanced smartphones
made a major impact, industry investment grew, and regulators made smart wireless policy
decisions. This contributed to a late U.S. rally in 3G that laid the groundwork for the US’ 4G
leadership, much as i-mode had done for Japan in the 2G to 3G transition.

From 2007 to 2011, the US added around 20 percentage points a year to its 3G penetration. Over
those years, US mobile operators invested more than $117 billion in their networks. 6 Between
2005 and 2008, the FCC auctioned more than 3,000 PCS, AWS and 700 MHz licenses, and in
2009 the FCC adopted a shot clock to expedite tower siting. 7 This last measure helped address a
long-standing issue that had hampered numerous network operators in the US as they sought to
extend and upgrade their networks during the 2G and 3G eras.

The increasing supply of spectrum, the flexible way US operators were allowed to shift spectrum
to any technology when business and technological needs allow and demand—and accelerated
cell siting rules helped the US to speed up its shift to 3G. As a result, the US created a solid
foundation and gained 4G leadership—and a host of American companies created an entire
ecosphere with consumers benefitting handsomely from it.

The US and Japan were fast out of the gate with 4G in 2011. The two countries had similar
growth through the next five years, with the US pulling ahead in 2016 (see Exhibit 3). Europe was
still drawing the wrong conclusions from its slow adoption of 3G networks and continued with a
policy of requiring a new auction to roll out 4G services followed by tepid 4G deployment.
How America’s Leading Position In 4G Propelled the Economy | April 16, 2018                           7

 EXHIBIT 3: 4G Adoption Curve—US, Japan, France, Germany, Italy, Spain, UK

 Source: Ovum Forecaster, 2017 and Recon Analytics analysis

But even as Japan initially kept pace with the US, it was losing a parallel battle over the broader
mobile ecosystem.

The i-mode system and domestically-designed and manufactured and highly-specialized Japan-
centric devices dominated the Japanese market in 2007. In 2007, Japanese companies like
Sharp, Panasonic, NEC, Fujitsu and Toshiba divided up the overwhelming majority of the
domestic handset market, with no significant non-Japanese players. 8

The Galapagos effect, 9 though, limited their ability to capture a significant share of the global
market, and ultimately made them vulnerable to entry by a super-competitor. Following Apple’s
entry in 2008, Japanese manufacturers’ market share fell to 57% in 2014. NEC and Panasonic
left the market in 2013, followed by Mitsubishi, Sanyo, and Toshiba. When Fujitsu announced in
2017 that it would exit the smartphone business, Japan was left with only three domestic phone
manufacturers (Kyocera, Sharp, and Sony). 10

From 2011 onward i-mode subscribership fell steadily until DoCoMo announced in 2016 that it
would discontinue the service to anyone but senior citizens, having fallen 72% from its peak in
2010.

As the number of users of i-mode fell, Japanese handset manufacturers’ market share also fell,
with the majority of new smartphones being sourced from international competitors like Apple,
Samsung, HTC, and Huawei 11 (see Exhibit 4).
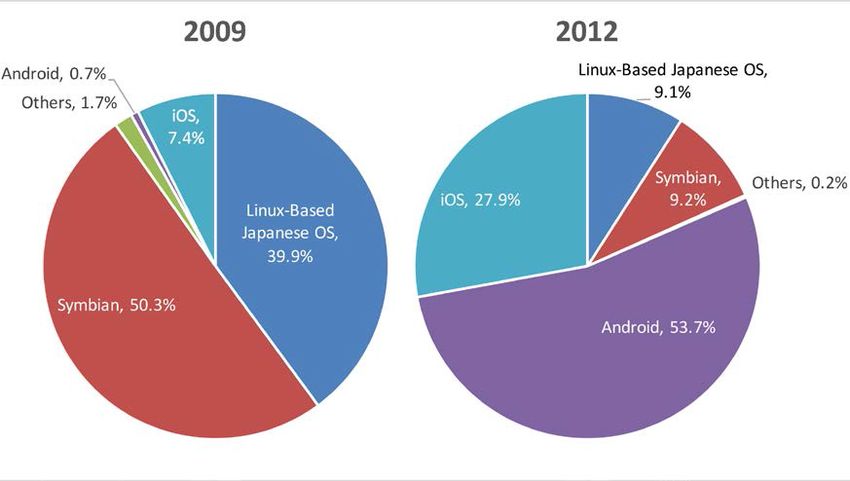
How America’s Leading Position In 4G Propelled the Economy | April 16, 2018                   8

 EXHIBIT 4: How i-mode Subscribers Fell as Smartphone Ownership Rose
 (in millions of subscribers)

 Source: Recon Analytics research from public sources, 2017

Over the period depicted in Exhibit 4, Apple not only grew its market share in Japan—it
dominated the market entirely. In 2017, it controlled nearly 70% of the Japanese smartphone
market, holding double the share of all the other companies combined.

At the same time, other elements of the Japanese ecosystem were also manifesting the impact of
the new super-competitors. As Exhibit 5 indicates, in 2009 Japan’s domestically-developed Linux-
based mobile OS had a 39.9% share of the market, while Symbian held more than 50%. At that
time, the new entrants, iOS and Android, held a combined total of 8.1% of the mobile OS market.
By 2012, the new entrants’ share had risen to 81.6%, while Linux had fallen to 9.1%, and
Symbian to 9.2%. By the beginning of 2016 iOS and Android accounted for 99.3% of mobile OS
in Japan. 12
How America’s Leading Position In 4G Propelled the Economy | April 16, 2018                         9

 EXHIBIT 5: How US Operating Systems Displaced Japan’s Incumbent OSs

 Source: Smartphone OS Market Shares (MIC, 2013), reprinted in Hitoshi Mitomo, Hidenori
 Fuke, Erik Bohlin, The Smart Revolution Towards the Sustainable Digital Society

Advanced wireless networks are necessary for technology leadership, as a platform and engine
for innovation, but they are not alone a guarantee of leadership. In spite of Japan’s initial network
rivalry with the US, the US won the crown for 4G leadership, as a center for broader wireless
innovation and value creation.

The Benefits of the US Winning 4G Leadership

The US lead in 4G has had a significant impact on the US economy. It has created global and
domestic GDP growth, job expansion, cost savings, and a broadly deployed network-driven
innovation engine.

In 2011, wireless industry GDP totaled $195.5 billion. In 2014, when 4G reached 40% penetration
in the US, wireless industry GDP was $332.9 billion. In the space of three years, the GDP
contribution of the US wireless industry had grown 70%.

The US’ 4G leadership was responsible for $43.6 billion of the increase in GDP between 2011
and 2014, as Exhibit 5 shows, contrasting the impact of 4G’s immediate availability on actual
GDP compared to the GDP projected based on the prior 3G trajectory.

The impact of the US’ 4G lead grew even more in 2016, when the difference between the prior
3G trajectory and 4G’s reality amounted to almost $100 billion in additional annual GDP.

The $445.0 billion in realized GDP in 2016 is a product of the advantages provided by
accelerated 4G-based network coverage and speed, and the expanded economic activity
surrounding, supporting, and being supported by these core networks, including imports and
exports.
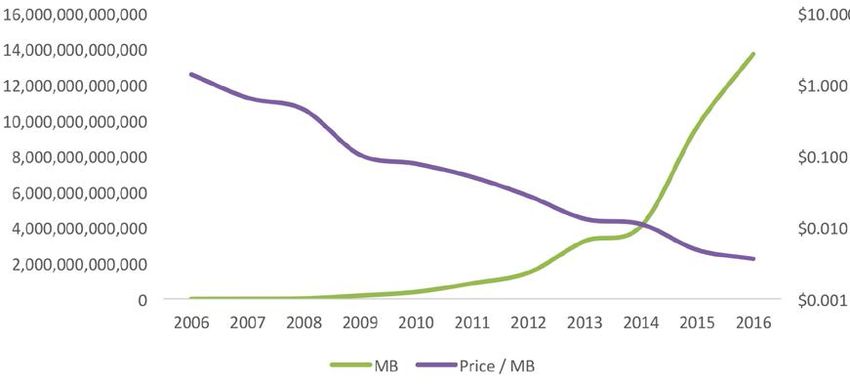
How America’s Leading Position In 4G Propelled the Economy | April 16, 2018                     10

As a result, in 2016, the impact of the wireless industry on the US economy was larger and
broader than ever before.

 EXHIBIT 6: US 4G Leadership and the Changing Trajectory of Wireless GDP

 Source: Ovum Forecaster, 2017 and Recon Analytics analysis

A Remarkable Expansion in Wireless-Related Employment Continues

The impact of the launch of 4G is clear when we compare job figures from 2011 to 2014 when
U.S. providers were rapidly building out 4G networks.

In the 3G era, total core wireless (direct, indirect, and support) jobs grew 4% from 2.4 million in
2004 to 2.5 million in 2011. In the period of the 4G launch, from 2011 to 2014, these core wireless
jobs grew 84%. 13

4G Has Driven Costs Down, and Usage Up

Innovation and competition has driven the cost of service down over time. From 2006 (in the 3G
era) through 2016, the cost per MB fell 99.7%, even as data usage grew from 1.677 billion MBs in
2006 to 13.719 trillion MBs in 2016. That means U.S. wireless consumers have seen a dramatic
increase in the value they get from wireless service.

The cost per megabyte has steadily declined. For example, in 2006, it cost $1.37 per MB. To
download a typical 4 MB song, a user would spend $5.48 using a wireless connection. Songs are
bigger now because of higher encoding levels, but, even if we say the song is 10 MB, the cost of
downloading that song over a wireless connection would be significantly cheaper. The implied
per-MB cost of a MB of data is an astounding $0.0036 14, making that song, even at 10MB, cost
about 3.5 cents (see Exhibit 7).
How America’s Leading Position In 4G Propelled the Economy | April 16, 2018                       11

 EXHIBIT 7: US Wireless Price per MB and Volume of Data Usage

 Source: Recon Analytics research, 2017
 Note: We used a logarithmic scale to better depict the rate of the unabated price decline. We
 depicted the volume of data on a standard scale.

Benefits in the 4G Age

International Revenues

With the wireless ecosystem increasingly an international one, US 4G leadership has brought
billions in revenues to American companies that could have gone elsewhere if the US hadn’t
seized 4G leadership. International revenues were significant in 2016 and depended on the 4G
leadership that the US has built. International end-user payments to device manufacturers and
resellers added up to $64.9 billion. App and content stores saw $25 billion in international
revenues. And device component suppliers saw revenue of $35.6 billion from international
sources. In total, $125.5 billion came in to American companies that could have gone elsewhere if
the US hadn’t seized 4G leadership.

App and Content Store Revenues

In 2011, the stores were coming into their own, with $8.20 billion in revenue. 2014 revenues—the
first measurement reflecting the launch of the 4G network era—came in at $38.90 billion, a delta
of $30.7 billion in three years. In 2016, revenue came in at $54.1 billion, reflecting both domestic
and international revenue (see Exhibit 8).
How America’s Leading Position In 4G Propelled the Economy | April 16, 2018 12
Exhibit 8: App and Content Store Revenues
(in billions of US$)
2004 2011 2014 Delta 2016 Delta
Revenues in $0.00 $8.20 $38.90 $30.70 $54.10 $15.20
Billions of US$
Source: Recon Analytics, Various publicly available sources, 2004-2017
The Costs of Losing Generational Leadership
What does it mean to lose generational leadership?
Wireless networks are the foundational nexus of an entire ecosphere of network equipment
providers, device providers, as well as application and service providers. The tale of the
sequential rise and fall of differing nations’ wireless technology leadership demonstrates the real
costs of losing global wireless leadership, costs that manifest themselves across the entire
ecosystem, and have lasting effects. We can see this in multiple countries—and in multiple
companies through the following case studies.
Lucent
Lucent was a US company, founded when AT&T spun it off in 1996 and focused on telecom and
internet infrastructure equipment. Few companies have been endowed with such valuable assets
as Lucent was when it came into being in 1996 at a value of $15 billion, with $22 billion in sales. 15
By 1999, the company would have an enviable market capitalization of $252 billion, making it the
eighth most valued company in the world. 16 But as the US was unable to seize 2G global
leadership, Lucent faced significant consequences.
Lucent’s reliance on wireline and internet made it vulnerable to the 2001 dot-com bubble, and its
burst had a calamitous impact on Lucent’s overall business. Its internet business dried up and its
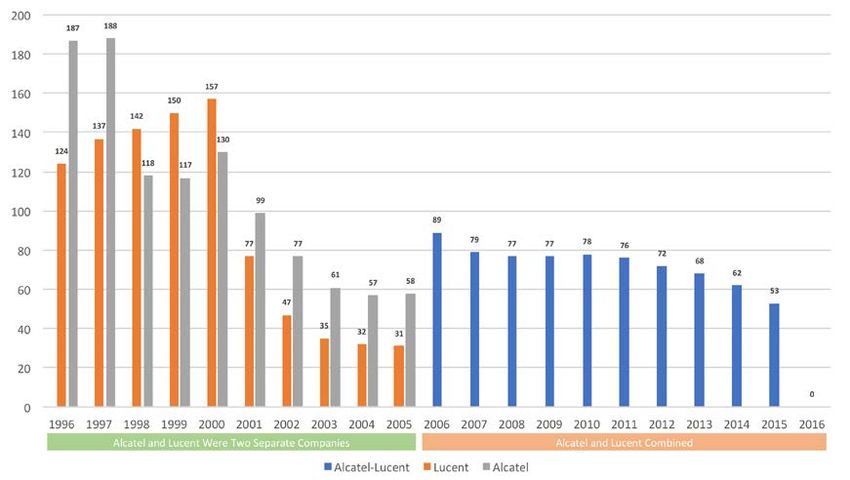
wireline business, already in a secular decline, kept heading in the wrong direction.How America’s Leading Position In 4G Propelled the Economy | April 16, 2018 13 2G wireless leadership in the US could have been a saving grace. But Lucent did not make sufficient inroads in the GSM market to take advantage of the growing global market, and the fragmentation of the American market into GSM, CDMA, TDMA and iDEN limited its 2G opportunities. The failure to achieve 2G leadership had real costs. Lucent began in 1996 with 124,000 employees. By 2000, it peaked at 157,000 employees. By 2001, with a significant decline under way, it would shrink to 77,000 employees—a loss of 80,000 jobs in one year. The total number of employees would continue to shrink to hit 31,000 in 2005. Alcatel saw a similar decline in employees, from a height of 188,000 in 1997 to 58,000 in 2005. Lucent and Alcatel combined in 2006, with a total of 89,000 employees. By 2015, that number had shrunk to 53,000. And, with the absorption of Alcatel-Lucent into Nokia in 2016, the stand- alone number dropped to zero. Somewhere around 300,000 jobs disappeared because two companies, once separate and then together, failed to ride the tidal wave of wireless technology evolution (see Exhibit 9). EXHIBIT 9: The Decline in Alcatel-Lucent Employees (in thousands) Source: Recon Analytics research, 2017 Note: 1998 decline in Alcatel employment is attributable to split with Alstom, which had an IPO on June 22, 1998 Other companies suffered similar fates to Lucent. Motorola’s network group stumbled and, in 2010, Nokia-Siemens bought Motorola’s mainly US and Japan network equipment business (which accounted for only 3% of the global market and focused mainly on CDMA and WiMAX) for $1.2 billion. After being absorbed, the Motorola business eventually disappeared, just as CDMA and WiMAX did.
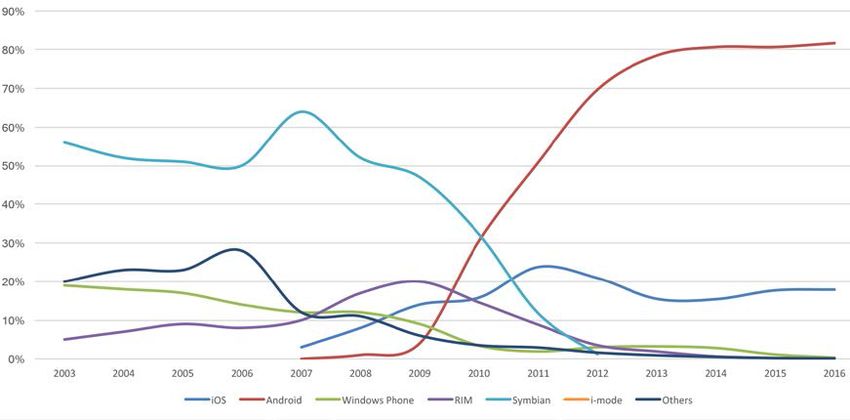
How America’s Leading Position In 4G Propelled the Economy | April 16, 2018                       14

Europe Loses Its Lead: The OS Ecosphere as a Symbol and Symptom

In the 2G era, European manufacturers dominated only to have their lead dwindle away. In
Germany, Nokia was so dominant that the name of its early Handy mobile phone series became
the colloquial expression synonymous with the term “mobile phone.”

Nokia pioneered the smartphone after recognizing mobile devices are suitable for more than just
phone calls, adding more functionality, including popular games like Snake, a phonebook, and a
calendar to make the device more than a mere phone, and building a smartphone operating
system, called Symbian. Significant elements of Symbian were in an open source development
model, foreshadowing Android, but Symbian did not come with a user interface, and each
company licensing Symbian had to build its own UI. This significantly limited the number of
companies capable of building Symbian devices. A further limit to the ability of Symbian to help
build the next generation of wireless was the fateful decision not to build a centralized app store
and to make it easy for other companies to build apps for consumers and monetize their efforts.

Broader ecospheres, like the ones Apple and Google built with their app stores, are critical to the
success of the modern smartphone, running on the latest networks. When the iPhone launched in
2007, there were just 10,000 apps available for the Symbian platform, a number that had taken
more than seven years to achieve. Sales of Symbian-based apps remained low and were soon
dwarfed by Apple, which had 100,000 apps in its store one year after launch. The launch of
Android in 2008 produced a multi-device vendor ecosphere that implemented the lessons that
Symbian failed to learn. It was easy for users to find and install apps. Both the Apple and Android
app stores provided developers with access to significant revenue—no matter where in the world
they took place. Nokia’s attempt to respond by introducing Ovi, its umbrella term for its N-Gage
platform and the Nokia Music Store, failed to meet the challenge of satisfying a critical part of the
ecosphere—the developers. One survey found that only half of developers were satisfied with the
store, with 69% saying their revenues were lower than they expected. Finally, 84% of developers
said that the Apple App Store was simply better. 17

The result was that while Symbian’s initial success had been widespread—and not limited to
Europe—the fall was swift and far.

Before iOS and Android arrived on the scene, Symbian was the clear smartphone leader. In
2003, Symbian had 56% of the early global smartphone market (see Exhibit 10). That share grew
to an overwhelming 64% in 2007. But its steady decline commenced as soon as the iPhone
debuted in 2007 and was hastened by the rise of Android a year later.

From its height in the year the iPhone was introduced, Symbian saw its share fall to 52% in 2008,
47% in 2009, 32% in 2010, 12% in 2011 to 1% in 2012 before disappearing completely. It was not
alone in suffering a decline, other smartphone operating systems, like Windows and RIM, also
saw sharp declines. Of the two rising operating systems, iOS moved from 3% in 2007 to 18% in
2016, while Android moved from a 1% share in 2008 to 82% in 2016 (see Exhibit 10).
How America’s Leading Position In 4G Propelled the Economy | April 16, 2018                      15

 Exhibit 10: Mobile Phone Operating System Market Share, 2003 - 2016

 Source: Recon Analytics research from public sources, 2017

The loss of leadership in this space was not manifested just in a decline in OS market share.
Another result was that, as the European Commission’s spokesman for digital economy and
society said, in the “mobile equipment industry, we had 80 percent of the market in 2008 and
because we were not ready for 4G mass deployment, the EU industry lost almost its entire
market share for mobile phones.” 18

Various theories have been advanced as to why Europe lost its leadership, from over-confident
reliance on its prior network leadership, to the lack of a unitary European wireless market, to
relocation of manufacturing jobs and innovative R&D centers, evolution of wireless to a software-
driven ecosystem, and the efforts of US wireless operators to catch up from a disadvantaged
position that led to the US capturing 4G leadership. Each factor undeniably played its role in the
unraveling of the ecosphere.

As a result, in a few short years, the mobile phone landscape around the globe changed
completely and irrevocably. Power shifted from Europe and Japan to the US.

Most of this happened because American companies built powerful smartphone OSs and created
wide-ranging app stores and ecosystems that supported developers and consumers alike. But the
success of those devices and operating systems in turn depended on the strength of the
networks that they rode upon. For all of this would not have been possible if American mobile
operators hadn’t built the first large-scale 4G networks that created the necessary foundation that
wiped out competitors on a global basis.

Having the right networks in place at the right time was a critical advantage for the US. Japan did
have 4G networks at about the same time as the US, but they were tied to i-mode and other
Japan-specific technologies—a Galapagos system in a Galapagos market, rather than a global
system. If they had taken a more global approach, the story we are telling might be completely
different. But i-mode had been developed in a closed, Galapagos market for tastes that didn’t
apply overseas. In addition, it ran headlong into the first iPhones and Android devices, with their
revolutionary way of accessing the Internet, which consumers worldwide knew from their home
computers.
How America’s Leading Position In 4G Propelled the Economy | April 16, 2018                         16

There are lots of moving parts in this battle, but the network is the foundation upon which
everything else is built. And that central position is empowered by the smart policies that enable
those networks to spread and support the devices and applications that collectively meet the
needs of consumers and businesses.

Conclusion: What 5G Leadership Could Mean for the US

5G will usher in a fundamental transformation of the way the Internet works. A consumer-ready
5G network’s availability will enable US companies to get devices to market faster, and
consumers will be the great beneficiaries of that. If 5G development is supported appropriately,
companies will be able to test new devices and applications on consumer-ready networks, not
hastily assembled test beds that can’t replicate the real world. If US companies have access to
these networks, they will win the mobile leadership battles of the future. But if they don’t have
access, other regions—perhaps China or Europe—will grab leadership and the US will playing
catch up for a decade or more.

It’s clear that 5G leadership will require the same kind of regulatory and legislative foresight to
support the swift and dense infrastructure deployment needed, and the necessary spectrum, as
the policies that ushered in the 4G era. This is true because our global rivals are intent on winning
the race to 5G. The EU, Japan, South Korea, and China have all identified 5G leadership as a
priority. Pre-standard commercial launches are projected in the near-term, to coincide with key
events like the Olympics, and network trials are underway. China alone will be conducting 5G
trials in more than 100 cities in 20 provinces. 19 US providers have demonstrated aggressive
commitments to 5G deployment. But policymakers need to keep pace with a spectrum pipeline
and modern infrastructure siting reforms.

Is the US Ready for the 5G Era?

If the US resolves to continue the leadership it gained in 4G, with the right support, just about
anything will be possible. American companies will be able to continue to set the global pace for
how the interconnected mobile world operates. Consumers will continue to reap great benefits
from lower prices and better services and usage levels at dizzying heights. The wireless
economy, with millions of jobs and countless companies hanging in the balance, will continue to
prosper. And the US economy in general will continue at an enviable pace.

But it all depends on political, legislative and regulatory will. Is the US ready to continue its
leadership into the 5G era? Only time will tell.
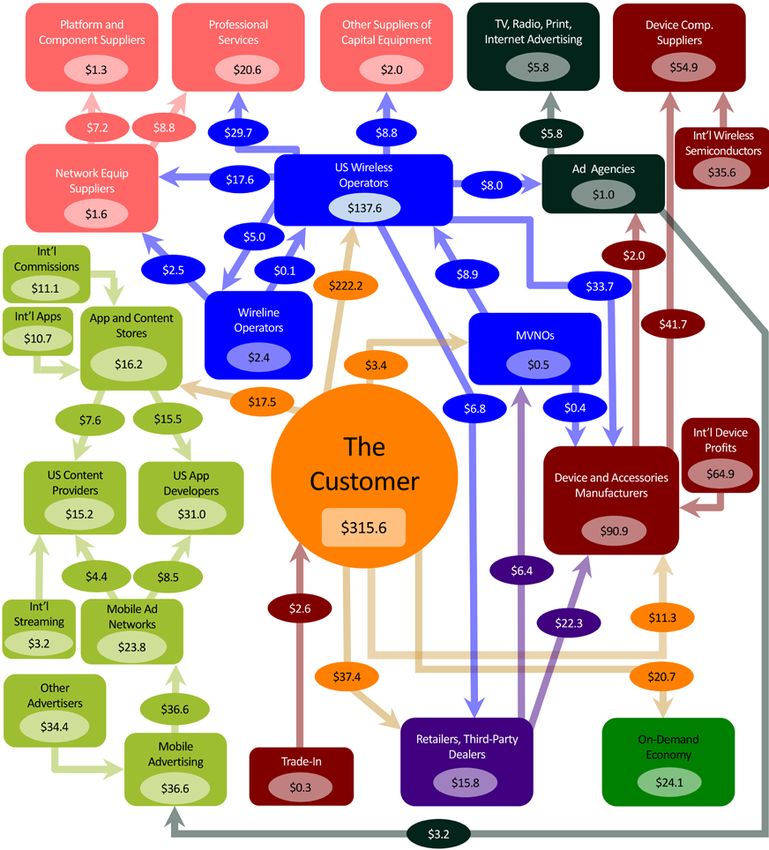
How America’s Leading Position In 4G Propelled the Economy | April 16, 2018                            17

APPENDIX A Understanding the Value Chain

 Exhibit 11: The Mobile Value Chain in 2016
 (All amounts in US$ billions)

 Source: Recon Analytics, 2017

Let’s start at the center of Exhibit 11: Mobile customers are responsible for $315.6 billion of
economic activity in the US. Including imports and exports, the wireless industry contributes
$445.0 billion in GDP. Customers spent $222.2 billion on services, devices and accessories
directly with US wireless operators; they also spent $37.4 billion with retailers and third-parties,
and $3.4 billion with MVNOs for service and devices, poured another $20.7 billion into the on-
demand economy (which had a retained value of $24.1 billion in 2016, up from $4.4 billion in
How America’s Leading Position In 4G Propelled the Economy | April 16, 2018                         18

2014), $11.3 billion with device and accessories manufacturers, and $17.5 billion for apps,
movies, music and other content through app and content stores. Those retailers and third-party
dealers then sent $6.4 billion to MVNOs (these are transactions that come from websites,
automatic payments, etc.), and $22.3 billion to device and accessories manufacturers (via
customer purchases directly from a manufacturer). Retailers retained $15.8 billion, which is
composed of profits and supports the direct jobs outlined in Exhibit 23. Customers also realized
$2.6 billion in value from trade-in programs (which retained $2.6 billion in 2016). Those MVNOs
sent 8.9 billion to wireless operators and $400 million to device and accessories manufacturers.
Those same device and accessories manufacturers saw considerable new value open up in
2016, with all-new international device profits of $64.9 billion feeding into a retained value of
$90.9 billion in 2016, up from $14.9 billion only two years earlier.

As we have made clear, the 4G networks are the backbone for the value generation in the 4G
era. To keep those networks humming along requires considerable wireline backhaul resources.
And wireless operators spent $5.0 billion in 2016 for wireline services (up from $4.7 billion in
2014). This figure includes not only payments for backhaul but also payments for a myriad of
other services that include the mobile carriers’ interoffice networks. It also includes payments for
connecting mobile switching networks, providing the synchronization of call record databases and
other databases to a wide range of organizations including telecom providers, cable providers,
electric utilities, railroads and other organizations that provide private fiber or microwave transport
networks and associated services. Wireline operators turned around and spent $2.5 billion with
network equipment suppliers to fulfill the demands of the wireless operators—retaining $2.4
billion in value in 2016.

The US wireless operators also spent $17.6 billion with network equipment suppliers on base
stations, antennas, core network equipment and associated services. In turn, network equipment
suppliers spent $7.2 billion with platform and component suppliers on the various pieces that
make up the equipment they sold to the wireless operators (those platform and component
suppliers retained $1.6 billion in 2016) and an additional $29.7 billion on professional services
(the professional services firms retained $20.6 billion in value in the United States in 2016).

In 2016, wireless operators also spent billions on professional services, in this case, $29.7 billion
for a variety of needs. Wireless operators enriched network equipment suppliers, conveying $17.6
billion in 2016 (the network equipment suppliers retained $1.0 billion in value). Moving to the right
on the value chain, wireless operators also spent $8.8 billion with other suppliers of capital
equipment for needs as diverse as laptops for employees to servers in corporate offices (those
suppliers retained $2.0 billion in 2016). Wireless operators spent $8.0 billion on marketing and
advertising while device manufacturers spent $2.0 billion, for a combined $10.0 billion, filtered
through ad agencies, which retained $1.0 billion and passed on $5.8 billion in the form of TV,
radio, print, and internet advertising (the TV, radio, print, and internet advertising operations
retained $5.8 billion in 2016). Overall, the wireless operators retained $137.6 billion in value in
2016.

Device and accessories manufacturers received $132.6 billion from domestic and international
sales, then spent $41.7 billion with US device component suppliers for the parts that make up
their devices (up from $25.4 billion in 2014), reflecting the more complex—and more expensive—
devices consumers desire. We now also include $35.6 billion in international wireless
semiconductor sales, which are at least partially contingent on the US having 4G leadership.

In 2014, we noted the profound change in the way customers dealt with apps. Previously, the
wireless operators controlled which apps a customer could see, and which ones they could
purchase. That model was upended in 2014.

In 2016, apps continue to be healthy, but a number of new elements have created significant
value. Customers spent $17.5 billion directly with app developers and app stores (which retained
an astounding $16.4 billion in value). The app and content stores then passed on $7.6 billion to
content developers, and $15.5 billion to app developers. New revenue sources for app and
How America’s Leading Position In 4G Propelled the Economy | April 16, 2018                       19

content stores in 2016 include international commissions of $11.1 billion and international apps,
which provided $10.7 billion in revenue. Content and app developers remain at the center of the
app ecosystem and they both also benefit from inflows that start with mobile advertising, which
received $3.2 billion from ad agencies and poured $36.6 billion into mobile ad networks in 2016
(up from $14.3 billion in 2014)—retaining $16.2 billion in 2016.

Those mobile ad networks then sent $4.4 billion to content providers (up from $2 billion in 2014)
and $8.5 billion to app developers (up from $3.1 billion in 2014). Meanwhile, the mobile ad
networks retained $23.8 billion in 2016. In 2014, that was the end of the app and content store
story. But in 2016, new elements came into play, including international streaming, which added
$3.2 billion to the revenue streams for US content providers and other advertisers, which poured
in $34.4 billion to mobile advertising. US content providers retained $15.2 billion in value in 2016
(up from $14.1 billion in 2014), with US app developers retaining $31.0 billion in 2016—almost
triple the $11.6 billion retained in 2014.

In total, absent US 4G leadership, the trajectory of US wireless GDP is projected to have reached
$350.3 billion in 2016. Instead, as a result of the impact that 4G leadership had on the trajectory
of the US wireless industry, US wireless GDP totaled $445.0 billion in 2016.
How America’s Leading Position In 4G Propelled the Economy | April 16, 2018                      20

1 Japan’s Personal Digital Cellular (PDC) standard was a time division multiple access (TDMA)-

based approach to digital communications that was unique to Japan. The US’ TDMA, Code
Division Multiple Access (CDMA), and Motorola’s proprietary Integrated Digital Enhanced
Network (iDEN) standards also offered alternate methods of increasing communications
efficiency through digitizing communications, as did the Groupe Speciale Mobile (sometimes
called Global System for Mobile) GSM standard adopted in Europe.
2 Tuna Baskoy, The Political Economy of European Union Competition Policy: A Case Study of

the Telecommunications Industry (2008), https://books.google.com/books?isbn=1135890145
3 “Survey-Nordic IT,” Financial Times, May 11, 2000, in Timothy Bresnahan, Alfonso Gambardella

(eds) Building High-Tech Clusters: Silicon Valley and Beyond (2004),
https://books.google.com/books?isbn=0521827221
4 Source: OECD Economic Surveys: Finland 2002, page 21, Box 1 “Nokia fact sheet”

(https://books.google.com/books?id=5b3LXKJpiEQC&pg=PA21&lpg#v=onepage&q&f=false)
5 Sheik Taher Abu, Technological innovations and 3G mobile phone diffusion: Lessons learned

from Japan, Telematics and Informatics 27 (2010) 418–432,
https://ai2-s2-pdfs.s3.amazonaws.com/19f4/b317f73092b1d4653be7a3116882ee65524f.pdf
6 U.S. Census, Annual Capital Expenditures Survey (ACES).
7 FCC Spectrum Auction Home page, Auctions 58, 66, and 73; Phil Goldstein, FCC approves

tower siting shot clock rules, Fierce Wireless, November 18, 2009,
https://www.fiercewireless.com/wireless/fcc-approves-tower-siting-shot-clock-rules
8 https://www.telegeography.com/products/commsupdate/articles/2008/11/27/nokia-exits-
japanese-handset-market/
9 “Japan’s cellphones are like the endemic species that Darwin encountered on the Galapagos

Islands — fantastically evolved and divergent from their mainland cousins,”
http://www.nytimes.com/2009/07/20/technology/20cell.html
10 “Another once high-flying Japanese cellphone maker is calling it quits,”

https://qz.com/1060175/fujitsu-tyo-6702-to-become-latest-once-high-flying-japanese-cellphone-
maker-to-leave-the-business/. Even Sharp had been acquired by Taiwan’s Foxconn in 2016.
http://www.zdnet.com/article/foxconn-completes-acquisition-of-sharp/
11 http://gs.statcounter.com/vendor-market-share/mobile/japan
12 http://gs.statcounter.com/os-market-share/mobile/japan/#quarterly-200901-201704
13 Core wireless jobs grew 84% from 2.5 million in 2011 to 4.6 million in 2014.
14 In reality, this figure is fairly invisible to the consumer because of the way carrier billing is

structured.
15 http://articles.latimes.com/1996-04-04/business/fi-54949_1_lucent-share
16 http://fortboise.org/top100mktcap.html
17 https://venturebeat.com/2010/10/29/84-percent-of-nokia-ovi-store-app-developers-say-apples-

store-is-better/
18 http://www.satellitetoday.com/government/2017/10/06/5g-european-commission-hopes-avoid-

repeat-4g-rollout/
19 https://www.telecomasia.net/content/china-plans-5g-trials-over-100-cities, and

https://www.telecomasia.net/content/china-mobile-begin-large-scale-5g-trials-2019
You can also read