DOUBLE-CAB UTES: CAUSES AND CONSEQUENCES
←
→
Page content transcription
If your browser does not render page correctly, please read the page content below
Double-cab utes: causes and consequences      Woodward, Wisniewski, Wild                   Page 1

           DOUBLE-CAB UTES: CAUSES AND CONSEQUENCES
                                 This paper has been peer-reviewed

Alistair Woodward, MB BS, MMedSc, PhD
Professor of Epidemiology and Biostatistics
University of Auckland
a.woodward@auckland.ac.nz

Mia Wisniewski, BSc
Research Assistant
University of Auckland
m.wisniewski@auckland.ac.nz

Kirsty Wild, BA(Hons), PhD
Senior Research Fellow
University of Auckland
k.wild@auckland.ac.nz

Presenter: Alistair Woodward

Abstract

The double-cab ute is extraordinarily popular – the top five best-selling new vehicles in New
Zealand (NZ) in 2019 were in this category. This is new: until 2015 the top-sellers were much
lighter vehicles like the Corolla, and the trend is global. In the US light trucks (utes and SUVs)
make up 70% of new automobiles, and they weigh more than ever: between 2000 and 2019
the average US pickup put on 520 kg. Designed for commercial activities such as construction
and farming, these vehicles are now commonly used for short urban trips previously
undertaken by light cars. There are consequences. The predominance of diesel engines
means higher emissions of NOx and other local pollutants. Weighing 2 tonnes or more, fuel
efficiency is reduced, and greenhouse emissions per km increased, relative to lighter vehicles.
The height and width of these vehicles dominate road space. There are safety issues,
including blind spots, a high centre of gravity, and an unforgiving front end. We estimate the
effects of the recent rise of the ute in NZ on greenhouse emissions and road crash injuries.
We explore also the effects of more, bigger, heavier, and more powerful vehicles on the quality
and safety of public spaces and the experience of those who use these spaces. We will
summarise work done on the promotion of the double cab ute in this country, contrasting the
themes that run through advertising images and commercial messaging with driver surveys
and studies of driver behaviour. The increasing average mass of the New Zealand vehicle
fleet, embodied in the double cab ute but apparent in other vehicles also, challenges climate
goals, urban efficiency, and health and safety plans such as Vision Zero. There is clearly a
need for integrated solutions that will protect the health and sustainability of the New Zealand
transport system.

Transportation 2021 Conference, 9 – 12 May, Hilton Auckland                                     1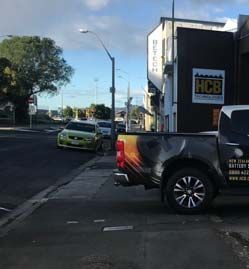
Double-cab utes: causes and consequences      Woodward, Wisniewski, Wild                    Page 2

1. Introduction – The rise of the urban light truck

The use of light trucks as passenger vehicles within urban areas is relatively new in Aotearoa
New Zealand. Ten years ago none of the biggest-selling new vehicles were in this category,
but now 8 of the top 10 are truck-like vehicles, including five double-cab utes (headed by the
Ford Ranger) and three Sports Utility Vehicles (SUVs). In this paper we focus on double-cab
utes, given their popularity (one in 5 new vehicle sales in 2019) and the important part they
have played in the transition of light trucks from work (utility) vehicles to family transport. The
term is not precise, we acknowledge: utes come in various forms, double and single-cab, with
and without open trays, with 4 wheel drive and without. And many large SUVs have ute-like
features, such as imposing size, high ground clearance, and a rigid truck chassis.

Based on local and overseas research, we estimate the effects of the rise of the double-cab
ute and similar vehicles on greenhouse gas emissions and road crash injuries. We conclude
that growing numbers of light trucks in cities threaten decarbonisation in two ways: Firstly
through directly increasing greenhouse gas emissions – largely offsetting the fuel efficiency
gains of recent decades. Secondly, by degrading the comfort, usability and safety of street
environments and thereby obstructing ‘mode shift’ to lighter, lower-carbon modes. We explore
policy solutions.

2. Origin story: why are so many people driving light trucks in cities?

The rise of light trucks (utes and SUVs) is generally attributed to a combination of savvy
marketing and weak regulatory frameworks. When US regulators imposed safety and
environmental standards on vehicles in the 1970s, they allowed much weaker standards for
light trucks (Bradsher, 2002), which at that time made up a small fraction of the total vehicle
fleet and were seen (by the regulators) as a niche market that would never contribute much
to vehicle emissions overall. However, weaker standards meant cheaper manufacture, and
American car companies seized the opportunity to increase production and to sell to a new
demographic (Bradsher, 2002). Marketing strategies to re-frame light trucks as passenger
vehicles were sophisticated and well-funded. The winning messages, pitched to increasingly
urban middle and higher income earners, were ‘adventure’, nature contact and ‘safety’
(Gunster, 2004, Glover, 2000). Advertising campaigns that promoted pick-ups and SUVs as
‘green’ and ‘safe’ misled the public, said some, given emission levels and crash rates (Glover,
2000, Rollins, 2006). Nevertheless motor industry campaigns were extraordinarily successful:
Light truck sales in the US went from 16% of all sales of new light vehicles in 1980 to 50% in
2005, and now approximately three quarters of sales in America are pickup trucks, SUVs and
vans. Over time these vehicles are becoming more massive (Figure 1). In 2019 the average
US pickup was 519 kg heavier than in 1990, and the three top-sellers in 2019, the Ford F-150,
Chevrolet Silverado and Ram 1500 were longer, wider and higher than ever before. (Neil,
2020)

Transportation 2021 Conference, 9 – 12 May, Hilton Auckland                                      2
Double-cab utes: causes and consequences      Woodward, Wisniewski, Wild                 Page 3

Figure 1. The size of utes is increasing over time (Source: Twitter)

The American story is now repeated in other countries, as manufacturers (eg in Japan and
China) make new versions of light trucks, and American-style marketing campaigns
encourage purchasers of new cars to up-scale. In general, engines are more efficient than
before, but this has not led to equivalent reductions in CO2 emissions as industry has fostered
public demand for bigger, more powerful machines. (Galvin, 2020) In Aotearoa, sales of new
utes and SUVs exceeded sales of cars for the first time in 2015. Tax incentives, including
designation of double cab utes as commercial vehicles that are exempt from fringe-benefit
tax, encourage the purchase of these vehicles (Daalder, 2020), although it appears that much
of their use is for other reasons than work, or for work trips that do not require 4WD or towing
capacity, and would previously have been undertaken using a car.

In 3.5 hours of road-side observations in Auckland between 2nd and 9th February 2021 we
counted 369 double-cab utes of which just over a third (36%) were clearly marked as
commercial vehicles, and 9% were evidently carrying large objects or towing. Observations
were made between 9 am and 5 pm, on three weekdays and one Sunday, on arterial and
collector roads. This pattern fits with the 2009 NZ Household Travel Survey which found SUVs
were predominantly used as a substitute for cars, whatever the ostensible reason for their
purchase (Lamb et al, 2010). In the 2015-2018 Travel Survey vehicles in the van/ute category
were more likely than cars to be used for work-related trips, but these accounted for only a
third of kilometres travelled (Jennifer McSaveney, personal communication). The proportions
of VKT for shopping or personal appointments (22%) and social visits/entertainment (12%)
were similar to the figures for cars.

3. Reasons for concern

3.1 Vehicle emissions

Per km utes emit 60-80% more CO2 than light cars, according to information provided by
manufacturers (Table 1), and they make a substantial contribution to land transport emissions
overall. Indeed, the growth in numbers of light trucks (pickups and SUVs) is the second biggest
cause of recent increases in greenhouse gases globally, according to the International Energy
Agency (IEA, 2019). There is evidence from the US that SUV and ute drivers tend to use
their vehicles more than do car drivers (Akar and Guldmann, 2012). If this is true in general
then the adverse effect on carbon emissions will be amplified.

3.2 Safety

3.2.1 Consequences for other road users

Transportation 2021 Conference, 9 – 12 May, Hilton Auckland                                   3
Double-cab utes: causes and consequences Woodward, Wisniewski, Wild Page 4
“[In the United States] the average 1-t pickup kills about 10 times more people in other
vehicles than an average Camry. Very roughly, during its life an average 1-t pickup
has a nearly 1% expectation of killing someone in a traffic crash” (Wenzel and Ross,
2005: 482)
The mass of light trucks, their height and specific design features, such as square,
accessorised front ends increase risk of injury for drivers of other, smaller, vehicles. As well
as generally having higher ‘aggressivity’ ratings (a measure of the tendency to kill or injure
occupants of other vehicles in a crash), their height, and common use of window tinting
decrease the visibility of people in smaller vehicles, making driving feel less safe and more
stressful. Use of these vehicles in urban settings tends to increase congestion, as other
drivers give more space to larger vehicles (Bradsher, 2002).
As well as the hostile design of the vehicles, there is evidence that they are driven in more
dangerous ways. Risky, aggressive, distracted and impaired driving are all reported to be
more common amongst ute and SUV drivers (Insurify, 2021, Paleti, Eluru, & Bhat, 2010,
Rudin-Brown, 2004; Wallner et al., 2017). In Europe SUV drivers were observed more likely
to use a phone while driving, and to drive without wearing a seatbelt compared to car drivers
(Wallner et al. 2017). The increase in risky driving behaviour occurred more frequently in male
drivers; however, women at the wheel were also driving in more dangerous and distracted
ways. New Zealand research found SUV drivers rate themselves as safer drivers, but are
actually more likely to report undertaking unsafe driving behaviours (Thomas and Walton,
2008). It is relevant also that the speed of driving tends to increase with the eye height of the
driver, and SUV drivers have more difficulty predicting their speed (Rudin-Brown, 2004).
Risky driving behaviour is dangerous to the drivers themselves because utes and heavy SUVs
have poorer handling and braking capabilities (Anderson, 2008) and their height makes them
more vulnerable to serious roll-over crashes (Islam et al., 2016, Wen et al., 2020, Wenzel and
Ross, 2005). In the US, 78% of rollover crashes in light trucks in the 1990s resulted in
passenger occupant fatalities, compared to just 48% in small cars (National Highway Traffic
Safety Administration, 1999). In New Zealand a study of vehicle crashes in 2015 – 2016 found
that modern vehicles were generally safer than older equivalents, but light trucks (SUVs and
utes) were more likely to cause serious or fatal injury in roll-over crashes (Mackie et al.,
2017). New Zealand drivers generally have a poor understanding of the risks and safety
profile of SUVS, with a tendency to employ “naïve physics heuristics” that position ‘bigger [a]s
better’ and safer (Thomas and Walton, 2008).
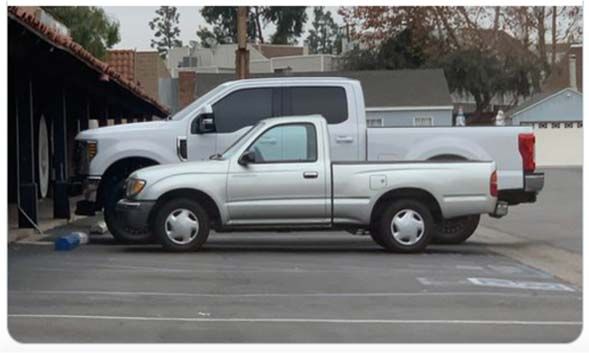
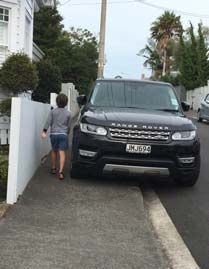
Transportation 2021 Conference, 9 – 12 May, Hilton Auckland 4Double-cab utes: causes and consequences Woodward, Wisniewski, Wild Page 5 3.2.2 Consequences for active travel and neighbourhood safety The rise of light trucks in urban areas in the US was associated with an increase in injuries and fatalities amongst pedestrians and cyclists (Monfort and Mueller, 2020, Anderson, 2008, Schneider, 2020). New models of the most popular utes have active warning systems that identify hazards, alert the driver and activate the brakes if the driver does not respond. However, if pedestrians are struck the consequences may be disastrous. The massive perpendicular front ends of utes increase the odds of severe injuries to the head, chest and lower extremities (Han, Yang, Mizuno, & Matsui, 2012, Schneider, 2020, Leffler & Gabler, 2004). The risks for unprotected road users are compounded by bull bars, rigid after-market accessories that are commonly fitted to utes in New Zealand. (In our observations on Auckland streets, 25% had add-ons of this kind or smaller ‘nudge bars’.) These structures may impair airbag function (New Zealand Transport Agency, 2020), and they concentrate the crash force and aggravate injuries to pedestrians and cyclists (Desapriya, 2012). Australian crash tests found the deceleration forces acting on a pedestrian’s head are typically five times greater when struck by a vehicle fitted with bull bars (Anderson 2009). As well as the effects on injury severity, bigger vehicles generally make everyday traffic more stressful for pedestrians and cyclists. In the US it was observed that SUVs make a number of low-speed pedestrian environments less safe, as these vehicles are more likely to threaten pedestrians when making left turns, negotiating curves, and traveling through signalized intersections (Schneider, 2020). Due to their size, drivers of these vehicles often have difficulty parking safely, leading to ‘overhang’ and illegal parking on pavements (Figures 2 and 3). Altogether light trucks make city streets less inviting for people who walk and cycle and may make it more difficult for New Zealand to switch to low-carbon modes of travel, as is required to meet national climate goals. Figures 2 and 3. Examples of SUV/ute ‘overhang’ reducing the usability and safety of pedestrian spaces in Auckland and Dunedin. (Source: K. Wild and A. Macmillan) 4. The marketing of double-cab utes in New Zealand – an analysis of advertising themes Transportation 2021 Conference, 9 – 12 May, Hilton Auckland 5
Double-cab utes: causes and consequences Woodward, Wisniewski, Wild Page 6
As in the US, concerns have been raised over the ways that utes are being marketed in New
Zealand, as these may be:
Misleading the public about the impact these vehicles have on the environment and
public safety (Wilson and Horrocks, 2020), and
Encouraging unsafe driving behaviour.
The double cab ute push makes strong use of images and rhetorical strategies designed to
invoke identification with a model of traditional ‘folk’ masculinity, while SUVs tend to be
marketed, in slightly different ways, to both men and women. Images of ‘aggression’ and
‘dominance’ are central to the branding of utes, which are given names like ‘Raptor’, and
‘Predator’. This marketing is strongly ‘identity’ rather than simply ‘utility’ based: aimed at
invoking the idea that driving these vehicles is an expression of ‘manliness’ or a robust male
identity. Both NZ and US research reports that SUV and ute drivers feel a stronger sense
than other drivers that their vehicle reflects their identity as well as their social status in the
community. The marketing of these vehicles as both an ‘identity statement’ and as a status
marker is reflected in NZ research that shows that SUV drivers are more likely than car drivers
to agree with statements that “my vehicle is a reflection of my lifestyle” and that “most people
would like a vehicle like mine.” (Thomas and Walton, 2008).
We recently undertook an analysis of SUV and double-cab ute advertisements shown in New
Zealand. Remote and undisturbed natural locations are prominent. The nature symbolism
extends to naming of SUVs and utes, with ‘Navigator’ and ‘Ranger’ for example portraying
exploration of new frontiers (Glover, 2000). Previous studies on SUV marketing have also
highlighted the way SUVs are marketed to increasingly urban populations as a means to
connect with nature (Glover, 2000, Horrocks and Wilson, 2019) .
As noted earlier, ‘macho’, aggressive and competitive themes and imagery are common.
“Dare to explore your inner beast” was the message on New Zealand bill-boards promoting
the 2020 Ford Ranger. And a recent review of the Ford Ranger Raptor on New Zealand car
website Driven was headed ‘Why the Raptor still ravages its rivals’ (Driven, 2021). The word
‘ravage’ invokes destructive and animalistic imagery which has been commonly used by the
industry in conjunction with dominating masculine marketing themes. In his history of the
SUV, Keith Bradsher devotes a chapter (entitled ‘Reptilean dreams’) to the deliberate efforts
of US manufacturers in the 1990s to sell light trucks on the basis of threat, defence and
survival (Bradsher 2002).
From a public health perspective, the pervasive use of aggressive and ego-centrist sentiments
and images, and the depiction of risky driving practices in the marketing of these much
heavier, more dangerous vehicles is concerning. Car advertising is the second biggest
advertising sector in New Zealand, and the push for utes and SUVs is not consistent with
Vision Zero strategies, which are centred on an ethic of care, slower travel, and making more
room for pedestrians and cyclists. However the promotion of Vision Zero sentiments is
heavily outspent by campaigns for double cab utes and SUVs: we note Ford plans to boost
production of large vehicles like the Ranger instead of small cars, and the company had at its
disposal, in 2019, a global advertising budget of 2.28 billion U.S. dollars (Statistica, 2020).
5. The future
To explore what double-cab utes mean for healthy, low-carbon transport in New Zealand, we
describe two scenarios, located in 2035 or thereabouts: one in which the country is served by
a vehicle fleet that includes 3 million Ford Rangers; the other in which the fleet includes instead
3 million Toyota Corollas (presently the top-selling new car in New Zealand). We do not
attempt to predict what will happen in 2035, nor what is most likely. However, in 15 years time
it is not inconceivable, given how closely NZ is following US transport trends, that three-
Transportation 2021 Conference, 9 – 12 May, Hilton Auckland 6Double-cab utes: causes and consequences Woodward, Wisniewski, Wild Page 7
quarters of our light vehicle fleet (which may number close to 8 million if recent growth
continues), will be utes and SUVs, in roughly equal proportions. Given the popularity of the
two vehicles, we chose the Ranger as the archetypal ute and the Corolla as a car equivalent.
Table 1 compares 2020 versions of these vehicles, based on sales information provided by
Ford and Toyota. There are many versions of the Ranger – the 4WD XLT is a popular mid-
range model, and registrations are split between the 3.2 Litre diesel and the 2.0 Litre petrol
turbo. We have chosen the diesel version as the majority of utes in general run on diesel. We
accept that there will be many changes in the next 15 years that are difficult to anticipate:
technological, social and environmental. But it is helpful, nevertheless, in our view to contrast,
in broad terms, a Ranger-rich world with one in which the vehicle fleet comprises mainly small
cars such as the Corolla .
2020 Corolla 2.0 Litre 2020 Ranger 4WD XLT Double Cab
Hatch GX Wellside 3.2L
Kerb weight 1340 kg 2188 kg
Dimensions 4370 mm long 5351 mm long
1790 mm wide 1860 mm wide (excl. mirrors)
1435 mm high 1821 mm high
0.80 height:width 0.98 height:width
Fuel, fuel efficiency, Petrol Diesel
overall 6.1 L/100 km 8.7 L/100 km
CO2 emissions 139 g/km 229 g/km
Listed price NZD 29,990 NZD 64,990 (+ORC)
Towing capacity 1300 kg 3500 kg
(braked)
Table 1. A comparison of the Toyota Corolla (formerly the top-selling vehicle in New Zealand)
and the Ford Ranger (top of the sales list each year since 2015)
At present New Zealand drivers, if they are men, cover about 12,000 km per year, on average;
the figure for women is just over 8,000 km per year. (Household Travel Survey) Assuming no
change in VKT, and a roughly 90 g/100 km difference in CO2 emissions between the two
scenarios, a 3 million double cab ute future releases each year 2.7 x 10⁹ kg (2,700 tons) of
carbon more than the alternative Corolla scenario. If there was a carbon price of $200 a ton,
this would amount to a national levy of $540 million annually.
The move to electric motors may increase the climate costs of a ute world because there is
no prospect at the moment of battery-only light trucks. Ford has announced it will sell an
electric version of the Ranger in 2022, but this is likely to be a plug-in hybrid (PHEV). It is
unclear at present how much difference this technology will make to emissions. Hybrid light
Transportation 2021 Conference, 9 – 12 May, Hilton Auckland 7Double-cab utes: causes and consequences Woodward, Wisniewski, Wild Page 8 trucks may not be driven much in EV mode due to the limited capacity of the batteries: a recent European study reported large discrepancies between manufacturers’ claims and real world emissions for a range of PHEVs, including the Outlander SUV. (European Federation for Transport and Environment 2020.) We note also that Ford’s production plans for the next 5 years envisage a very small role for electric vehicles – according to Reuters, Ford and General Motors expect to produce in North America more than 5 million SUVs and pickup trucks in 2026, but only about 320,000 electric vehicles (Lienert 2020). The information provided by manufacturers does not include pollutants, apart from CO2, that are relevant to climate change and public health. To fill this gap, we refer to outputs from the Waka Kotahi Vehicle Emissions Prediction Model version 6.1 (Gerda Kuschel, personal communication). The petrol-driven Corolla emits higher levels of hydrocarbons, whereas the heavier, diesel powered Ranger contributes much greater amounts of NOx (oxides of nitrogen) – about 1.5 g/km compared with .02 g/km, when travelling at 50 kph. NOx not only contributes to warming, but has significant harmful effects directly on human health (Huangfu, 2020). There is less difference between the vehicles in emissions of particulate matter, although PM10 levels, coming largely from brake and tyre wear are higher for the Ranger, Differences in fuel efficiency and kerb weight would add to operating costs in the transport system; the higher purchase prices would be regressive, socially. Also, larger vehicles take up more space on the roads. Leaving aside the greater braking distance required for double cab utes than small cars, a fleet with 3 million Ford Rangers would occupy about 30 million m2 of road space, compared with 23.5 million m2 for the same number of Corollas. All else being equal, to avoid worsening congestion, and to ensure enough space for pedestrians, cyclists and other road users, transport authorities would need to spend roughly 30% more on bitumen. The important figures in the Table from a road safety perspective are the weight (which affects braking distance and striking force), height (over-ride), the ratio of height:width (stability), and the towing capacity. Towing capacity is not directly relevant here, but the superior performance of the Ranger (and its 4WD capabilities) requires a rigid truck chassis, which does have safety implications (especially in terms of injury risks to other road users). The safety of the 2020 models cannot be assessed directly, but we can compare previous models of the Ranger and the Corolla (Table 3), based on police-reported crashes across Australia and New Zealand from 1987-2017 (Newstead 2019). The outcome is the risk of injury severe enough to lead to hospital admission or to cause death, amongst either the occupants of the primary vehicle (the crash-involved Corolla or Ranger), or the occupants of other vehicles, and other road users (eg cyclists and pedestrians). This latter measure is called ‘aggressivity’. The analytic method takes into account a large number of factors, other than vehicle type, that may influence injury severity (including travelling speed, age and sex of occupants, likelihood of alcohol, location of crash and period). Transportation 2021 Conference, 9 – 12 May, Hilton Auckland 8
Double-cab utes: causes and consequences      Woodward, Wisniewski, Wild                       Page 9

                                                         Toyota Corolla          Ford Ranger

 Crashworthiness (serious injuries/ 100 drivers) 4.39 (4.18-                     3.36 (3.05-3.69)
                                                 4.61) [2002– 2007               [2006-2011
                                                 models]                         models]

                                                         3.86 (3.62-4.12) [07-   2.14 (1.76-2.62)
                                                         13]                     [11-15]

                                                         4.16 (3.67-4.72) [12-   1.98 (1.19-3.31)
                                                         17]                     [15-17]

 Aggressivity (serious injuries/100 drivers of           3.41 (3.19-3.64) [02-   4.86 (4.36-5.42)
 other crash-involved vehicles and other                 07]                     [06-11]
 affected road users)
                                                         3.37 (3.09-3.66) [07-   6.27 (5.33-7.37)
                                                         13]                     [11-15]

                                                         3.44 (2.89-4.09) [12-   7.38 (4.98-10.94)
                                                         17]                     [15-17]

Table 2. Risk of serious injury (hospital admission or fatality), for drivers and passengers
(crashworthiness) and for other road users (aggressivity), by model year, Toyota Corolla and
Ford Ranger*

* Based on police-reported crashes in Victoria, New South Wales, Queensland, Western
Australia, New Zealand and South Australia that occurred during 1987-2017. Model years in
square brackets. 95% confidence intervals in round brackets. Reference: Newstead 2019

Table 2 shows occupants of the Ford Ranger are less likely to be seriously injured in road
crashes, given a crash has occurred, than occupants of the Corolla. However the Ranger
causes more serious injuries to other road users. Recent models of the Ranger do better on
the crashworthiness measure, perhaps as a result of improvements in handling and reduction
in the risk of roll-overs, but worse on aggressivity. The latter may be a statistical artefact
(given the wide and overlapping confidence intervals), or a function of greater mass and height
and design changes in the front ends of the Ranger and other double-cab utes. (Neil, 2020)

It is difficult to project what the safety implications might be of different vehicle fleets in the
future. Crash risk may change for many reasons, and if a crash does occur, the chance of
severe injuries may not be exactly the same as in the past. However in broad terms, we argue,
the differences between cars such as the Corolla and utes like the Ranger are likely to persist.

The important point is that ‘other affected road users’ are 1.5 to 2 times as likely to be killed
or to require a hospital admission if struck by a Ford Ranger than a Corolla. The pattern seen
in Table 2 is consistent with research based on large American data sets, and is backed up

Transportation 2021 Conference, 9 – 12 May, Hilton Auckland                                          9
Double-cab utes: causes and consequences Woodward, Wisniewski, Wild Page 10
by experimental crash studies. Anderson (2008) estimated an 80% increase in probability of
death if a cyclist or pedestrian was struck by a light truck rather than a car. In two vehicle
collisions, the probability of a fatality in the struck vehicle was 62% greater if the striking vehicle
was a light truck rather than a car. An earlier study, based on pedestrian injuries in the US
1994-1998, found that risk of death after adjusting for age and crash speed was 3.4 times
higher with a light truck (Roudgari, 2004)
We conclude that a scenario in which double cab utes dominate the vehicle fleet not only
incurs a heavy carbon cost, but leads to higher levels of health-threatening air pollution, and
makes the roads more dangerous for other road users, and especially pedestrians and
cyclists.
6. Conclusions and recommendations
Double cab utes are useful in many situations: the challenge is to prevent the harm caused
by unconstrained growth in the number of these vehicles and their widespread use for trips of
all kinds. Based on successful public health campaigns in the past, such as tobacco control,
we suggest the following interventions to limit the environmental and health risks of light trucks
should be considered.
First, moves to build in better safety and greater efficiency:
Import controls might bring forward the ban on new fossil fuel vehicles over a certain
weight
Design standards, particularly those related to risks to others, should be greatly
strengthened. In other jurisdictions bull bars and other dangerous front-end
accessories are banned or more tightly restricted than in NZ.
Registration of passenger vehicles could be limited to those that can safely fit within
standard parking spaces
Clean car standards can help to incentivise smaller vehicles. It is important that both
double-cab utes, and Plug-in hybrid electric vehicles (the likely early ‘electric’ mode for
larger vehicles and SUVs and utes) are covered by these standards.
Pricing mechanisms might include:
A review of exemption from fringe-benefit tax for double-cab utes. In its present form
this is essentially a government subsidy that promotes purchase of heavier vehicles.
Increasing sales taxes, vehicle registration charges and congestion charges by vehicle
weight could be used to incentivise a lighter, safer, and less carbon-intensive urban
fleet. (We note a recent UK study that concluded ‘fostering vehicle weight reduction
could produce greater cumulative emissions savings by 2050 than those obtained by
incentivising a fast transition to electric drive trains’ (Serrento 2017))
Action to foster health- and climate-promoting environments, such as:
Enforcing rules on illegal parking and ‘overhang’ in pedestrian environments more
energetically, with steeper fines.
Parking strategies that explicitly rule out increases in parking space size to
accommodate larger vehicles in urban spaces.
Urban environments that discourage unnecessary driving, given that larger vehicles
appear to pose particular risks to pedestrians and cyclists, even in low-speed street
settings. Car-free, pedestrianised, low-emission, and low-speed zones could all be
Transportation 2021 Conference, 9 – 12 May, Hilton Auckland 10Double-cab utes: causes and consequences Woodward, Wisniewski, Wild Page 11
used to reduce vehicle traffic, and light truck vehicle traffic in particular, in areas with
high levels of pedestrians.
Limits to advertising:
Given the very high levels of advertising spend by manufacturers of these vehicles, limits on
this advertising, and particularly on the use of aggressive and anti-social themes, the portrayal
of risky driving, and rhetorical and visual strategies designed to invoke a ‘green’ or
‘environmentalist’ identity in association with these vehicles will be necessary if we are to
achieve a shift towards the use of lower-carbon, safer transport modes in our cities.
Previous legal challenges to light truck advertising in the US have emphasised the
particular importance of restricting the portrayal of risky driving, given poorer handling
and outsized ability to do harm. New Zealand marketing could similarly be restricted
to portraying driving behaviours that are legal on our roads.
A recent UK study recommended three strategies to reduce the harms of SUV
advertising which could be applied to the advertising of double-cab utes in New
Zealand: 1) a ban on advertising for vehicles that are in the top third most polluting
and/or cannot fit within a standard parking space; 2) New advertising codes for the
Advertising Standards Authority aimed at ending the advertising of high-carbon
products; 3) New voluntary codes for advertising agencies to end the promotion of high
carbon lifestyles and products (Boyle et al, 2021).
Any advertising regulation should be carefully considered to include influencers, online
forums, product placement and branded content that may be associated with the
automobile industry.
Author contribution statement
Alistair Woodward initiated the project and wrote the first draft. All authors contributed to the
writing of the final version of the paper. Mia Wiesniewski collected data and led the analysis
of advertising. Kirsty Wild led data analysis and development of social and behavioural
themes in the paper.
References
Akar G and Guldmann J M (2012). Another Look at Vehicle Miles Traveled. Transportation
Research Record, pp. 110-18.
Anderson M (2008). Safety for Whom? The Effects of Light Trucks on Traffic Fatalities.
Journal of health economics, 27 (4), 973-89. 10.1016/j.jhealeco.2008.02.001
Anderson RWG, Doecke S (2009). The effect of bull bars on head injury kinematics in
pedestrian crashes. Centre for Automotive Safety Research, University of Adelaide.
Report CASR059.
Boyle, D., Murray, L., Tricarico, E., Simms, A., Beevor, J., & Gillett, R. (2021). Mind games
on wheels: How advertising sold false promises of safety and superiority with SUVs.
UK: Badvertising.
Bradsher K (2002). High and Mighty: SUVs: The World’s Most Dangerous Vehicles and How
They Got That Way, PublicAffairs, New York.
Transportation 2021 Conference, 9 – 12 May, Hilton Auckland 11Double-cab utes: causes and consequences Woodward, Wisniewski, Wild Page 12
Cozzi, L., & Petropoulos, A. (2021). Carbon emissions fell across all sectors in 2020 except
for one – SUVs. Retrieved from https://www.iea.org/commentaries/carbon-emissions-
fell-across-all-sectors-in-2020-except-for-one-suvs
Daalder, M. (2020, 24 February, 2020). Is New Zealand subsidising utes? Newsroom.
Retrieved from https://www.newsroom.co.nz/is-nz-subsidising-utes
Desapriya E. (2012). Bull bars and vulnerable road users. Traffic Injury Prevention, 13, 86-
92.
European Federation for Transport and Environment. (2020). Plug-in-hybrids: Is Europe
heading for a new dieselgate? Brussels. Retrieved from
https://www.transportenvironment.org/publications/plug-hybrids-europe-heading-
new-dieselgate
Glover L (2000). Driving under the Influence: The Nature of Selling Sport Utility Vehicles.
Bulletin of Science, Technology and Society, 20 360-65.
Gunster S (2004). 'You Belong Outside': Advertising, Nature, and the Suv. Ethics and the
Environment, 9 (2), 4-32.
Huangfu P, Atkinson R (2020) Long-term exposure to NO2 and O3 and all-cause and
respiratory mortality: a systematic review and meta-analysis. Environment
International 144: 105998
Insurify (2021) Driving Drunk: Car Models with the Most DUIs,
https://insurify.com/insights/car-models-most-duis-2020/, Website accessed 2/4/21.
International Energy Agency (2019). World Energy Outlook 2019. IEA, Paris.
Islam S, Hossain A B and Barnett T E (2016). Comprehensive Injury Severity Analysis of
SUV and Pickup Truck Rollover Crashes: Alabama Case Study. Transportation
Research Record, pp. 1-9.
Lamb S, Mora K, Walton D. (2010). Unused utility: an examination of SUV use in New
Zealand from 1989 to 2006. Road and Transport Research, 19, 29-39
Leffler DE, Gabler HC. (2004). The fatality and injury risk of light truck impacts with
pedestrians in the United States. Accident Analysis & Prevention, 36, 295-304)
Lienert P, White J, Klayman B. (2020) Detroit’s near-future based on SUVs, not EVs,
production plans show. Reuters, March 27. Retrieved from
https://www.reuters.com/article/us-autos-emissions-suvs-insight-idUSKBN21D1KW
Linklater, D. (2021). Review: why the Ford Ranger Raptor still ravages its rivals. Driven.
Retrieved from https://www.driven.co.nz/reviews/review-why-the-ford-ranger-raptor-
still-ravages-its-rivals/
Monfort S S and Mueller B C (2020). Pedestrian Injuries from Cars and Suvs: Updated
Crash Outcomes from the Vulnerable Road User Injury Prevention Alliance (Vipa).
Traffic Injury
Prevention,10.1080/15389588.2020.1829917: 10.1080/15389588.2020.1829917
Neil D. (2020). Pickup trucks are getting huge. Got a problem with that? The Wall Street
Journal, August 1. https://www.wsj.com/articles/pickup-trucks-are-getting-huge-got-a-
problem-with-that-11596254412
Newstead S, Watson L, Keall M, Cameron M, Rampollard C. (2019) Vehicle safety ratings
estimated from police-reported crash data. 2019 update. Monash University Accident
Research Centre. Report No. 338.
New Zealand Transport Agency (2020). Bullbars. New Zealand Government. Retrieved from
https://www.nzta.govt.nz/safety/vehicle-safety/vehicle-equipment/bullbars/
Rollins W (2006). Reflections on a Spare Tire: SUVs and Postmodern Environmental
Consciousness. Environmental History, 11 (October), 684-723.
Roudsari BS, Mock CN (2004). Pedestrian crashes: higher injury severity and mortality rate
for light truck vehicles compared with passenger vehicles. Injury Prevention, 10, 154-
8
Rudin-Brown C M (2004). Vehicle Height Affects Drivers' Speed Perception: Implications for
Rollover Risk. Transportation Research Record, pp. 84-89.
Schneider R J (2020). United States Pedestrian Fatality Trends, 1977 to 2016.
Transportation Research Record, 2674 (9), 1069-83. 10.1177/0361198120933636
Transportation 2021 Conference, 9 – 12 May, Hilton Auckland 12Double-cab utes: causes and consequences Woodward, Wisniewski, Wild Page 13
Serrento AC, Norman JB, Allwood JM (2017). The impact of reducing car weight on global
emissions: the future fleet in Great Britain. Phil Trans R Soc A, 375, 20160364
Statistica (2020). Ford Motor Company’s advertising spending in the United States from
2007 - 2019. Statistica. Retrieved
from https://www.statista.com/statistics/261535/ford-motors-advertising-spending-in-
the-us/
Thomas J and Walton D (2008). Vehicle Size and Driver Perceptions of Safety. Int J
Sustainable Transportation, 2, 260-273
Wallner P, Wanka A and Hutter H-P (2017). SUV Driving 'Masculinizes' Risk Behaviour in
Females: A Public Health Challenge. Wiener klinische Wochenschrift: The Central
European Journal of Medicine, 129 625-29.
Wen H, Tang Z, Zeng Y and Zhang K (2020). A Comprehensive Analysis for the
Heterogeneous Effects on Driver Injury Severity in Single-Vehicle Passenger Car
and Suv Rollover Crashes. Journal of Advanced Transportation,
2020: 10.1155/2020/1273605
Wenzel T P and Ross M (2005). The Effects of Vehicle Model and Driver Behavior on Risk.
Accident Analysis and Prevention, 37 (3), 479- 94. 10.1016/j.aap.2004.08.002
Transportation 2021 Conference, 9 – 12 May, Hilton Auckland 13You can also read