DEVELOPMENT OF FUEL ECONOMY REGULATIONS AND IMPACT ON AUTOMAKERS
←
→
Page content transcription
If your browser does not render page correctly, please read the page content below
Mitsui Global Strategic Studies Institute Monthly Report March 2017 1
DEVELOPMENT OF FUEL ECONOMY REGULATIONS AND IMPACT ON AUTOMAKERS
Kosuke Nishino
Industrial Studies Department I, Mitsui Global Strategic Studies Institute
EXECUTIVE SUMMARY
I. CHANGING CIRCUMSTANCES OF AUTOMOBILES
‒ As a result of the shale revolution in the U.S. and the slowdown of the Chinese economy, the supply and
demand of oil has relaxed and the price of gasoline has stabilized at a low level, thus boosting the trend toward
bigger and heavier vehicles, such as SUVs, in the U.S. and other parts of the world.
‒ The COP 21 discussions and agreement have shown significant progress toward the suppression of global
warming by the cooperation of most countries in the world.
II. FUEL ECONOMY REGULATIONS BY COUNTRY AND REGION
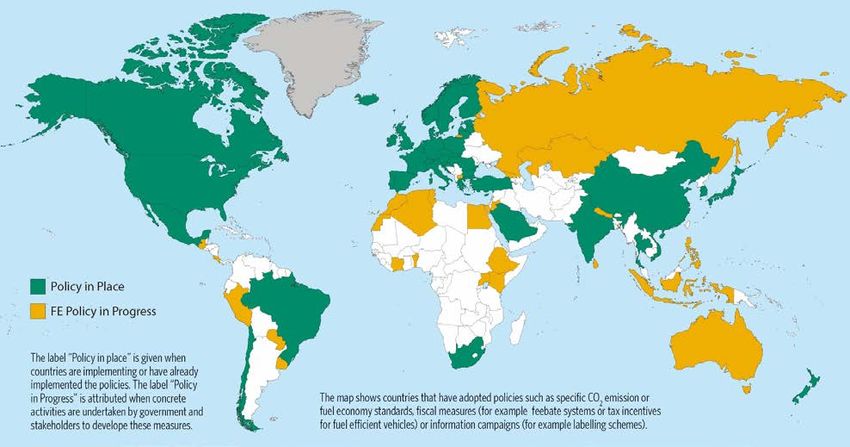
‒ The introduction of fuel economy regulations has accelerated since 2010, and over 90% of the global
automobile market is subject to regulations. A majority of the regulations in place are in accordance with the
Corporate Average Fuel Economy (CAFE) standards.
‒ The European Union’s 2021 target is the strictest in the world. It is nearly 30% more severe than the 2015
target. The distance to the targets varies by company, and U.S. and Korean companies are lagging.
‒ A distinctive feature of U.S. federal regulations is that the targets for passenger cars and light trucks are set
separately, and the target for light trucks is laxer. Progress on fuel economy improvement differs significantly
by country, and European companies are having a hard time meeting the targets.
‒ The targets after 2022 under current legislation are provisional and under review, and they could be revised
by the Trump administration.
‒ Zero-emissions vehicle (ZEV) regulations enacted in ten states, including California, will be tightened from the
latter half of 2017, and manufacturers are required to sell a designated share of ZEV like battery electric
vehicles (BEV) and plug-in hybrid vehicles (PHEV). Car manufacturers are required to respond.
‒ China’s fuel economy regulations have been tightened a great deal toward 2020, to the similar level of those
of Japan. In particular, Chinese brands are required to reduce fuel consumption significantly.
‒ In line with governmental policy of promoting new energy vehicles (NEV) such as BEV and PHEV, companies
that make and sell these vehicles are given special preference in calculations of corporate average fuel
consumption.
III. PROGRESS AND DIRECTION OF MEETING TIGHTENING FUEL REGULATIONS
‒ Improvement of fuel economy in the U. S. mainly relies on the improvement of internal combustion engine
technology in combination with modest introduction of electrification. BEV, PHEV, and HEV (hybrid electric
vehicle) will not be the mainstream technology, although BEV and PHEV will account for a certain share of
sales among European manufacturers and HEV for some among Japanese manufacturers.
‒ In China, it is hard for most of companies to meet the 2020 regulations with only internal combustion engine
technology. A cumulative 4 million NEVs need to be introduced by 2020 to reach the goal. The Chinese version
of ZEV regulations is to be introduced in 2019 to promote improvement.
Mitsui Global Strategic Studies Institute Monthly Report March 2017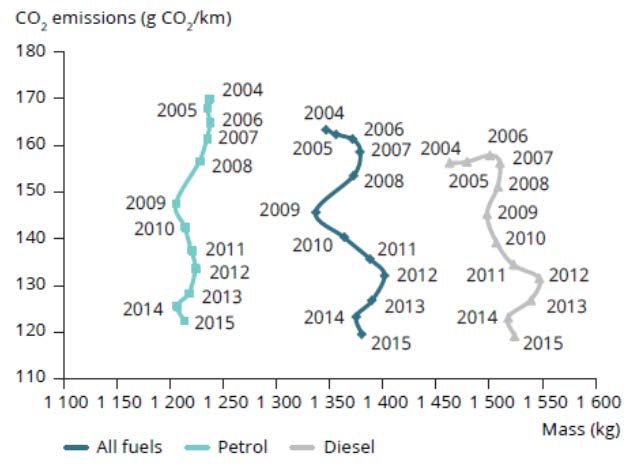
Mitsui Global Strategic Studies Institute Monthly Report         March 2017                       2

‒ In Europe, car manufacturers are forced to reduce dependence on diesel technology as a result of
  Volkswagen’s diesel-gate scandal, and they are focusing more on electric drive.
‒ The diffusion of electrified vehicles varies by country in Europe. Countries with a high density of electrified
  vehicles, such as Norway and the Netherlands, are implementing powerful policy measures. For the mass
  diffusion of BEVs, generous policy support will be needed across European countries.

IV. CONCLUSION

‒ Fuel economy regulations, now widespread, will be strengthened in the long term, but the direction and
  progress differs by country, which reflects the differences in the situation of each country and region, such as
  the existence of consensus for better fuel economy and lower CO2 emissions and automotive industry policy.
‒ There are two groups of carmakers in terms of the technology of improving fuel economy. One group, which
  includes Toyota, is focusing on hybrid technology, and the other, made up of European companies, is now
  heading toward the introduction of battery electric vehicles and plug-in hybrid vehicles. Neither of group has
  found a clear scenario to meet fuel economy regulations after 2025.
‒ Fuel economy regulations could open up opportunities to re-examine the future form and function of the
  automobile, whose basic form has not changed since the last century. only 22.5 million in 2000. Also, the
  government censorship on Google or Facebook turned out to provide a boost to search engine Baidu or SNS
  operator Tencent.

                  Mitsui Global Strategic Studies Institute Monthly Report        March 2017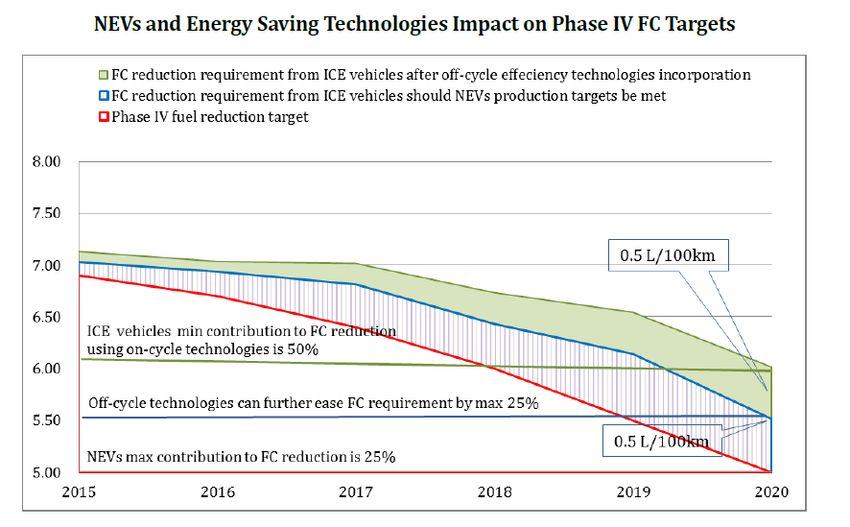
Mitsui Global Strategic Studies Institute Monthly Report                                   March 2017                                          3

PREFACE
With increasing concern about global warming, more and more countries and regions are introducing and
tightening fuel economy regulations for automobiles. Carmakers are taking various measures to cope with this
trend, including the electrification of powertrains in addition to the improvement of the efficiency of internal
combustion engines, weight saving, reduction of running resistance, and so on. This movement could ultimately
impact the form and the usage of the automobile, which basically has not changed since its inception.

The increasing availability of oil as a result of the shale revolution, on the other, has changed the supply and
demand of oil, thus stabilizing gasoline prices in the U.S., and sales of larger cars, such as SUVs, and pickup
trucks are growing. This is regressive for the saving of fuel. In China, the government leads the fostering of an
automotive industry that leverages the mass introduction of electrified vehicles, and the fuel regulations play a
part. As seen in these examples, the purpose and progress of and reactions to fuel economy regulations vary
largely by country and region.

In this article, I overview fuel economy regulations of major regions and countries and carmakers’ reactions to
meet the regulations, examine the impact of regulations on the form, market, and the industry, and try to picture
scenarios of future developments. In Chapter I, I overview the background of tightening fuel economy
regulations, such as the supply and demand of fossil fuel and the move toward the reduction of global warming.
Chapter II details the history and current status of regulations in Europe, the U.S., and China and spells out the
characteristics of these markets. In Chapter III, based on an understanding of the current situation, I will try to
formulate a view of the future direction of technologies and carmakers’ strategic actions. Chapter IV summarizes
the impact of fuel economy regulations on the market and industry as well as the state of regulations.

I.CHANGING CIRCUMSTANCES OF AUTOMOBILES

1. DEVELOPMENT OF FUEL PRICES

The global oil supply has significantly
                                                                              Fig. 1 Trend of Oil Price(WTI)
increased due to the activization of shale         $/bbl
                                             160
oil production in the U.S., and it has                   2000-2009 Rapid increase of demand in China
                                                         6.9% growth p.a. vs 1.1% p.a. for World
pushed oil prices down (Figure 1). As a      140                                                          133.38            OPEC Agreement on
result of agreement on the reduction of                                                                                     Production Cut Dec 2016
                                             120
oil production among OPEC countries in
November 2016, oil prices have inverted      100
with the expectation that the surplus of
                                              80
oil will be mitigated. With the oil price
                                                                                                                  OPEC maintains production
hike, however, more and more shale oil        60                US attack on Iraq                                 volume while US shale oil
                                                                Mar 03                                            production increases               52.01
production has become profitable,                                                                                 Nov 2014
                                              40
leading to increased production, thus                                                    Lehman crisis    39.15    No restriction on oil
creating a ceiling for the price hike.                                                   Sep 2008                  production in OPEC assembly      30.35
                                              20                                                                   Dec 2015
Technological innovation in shale oil
                                               0
production,     further   lowering     the          00     01      02    03    04   05   06    07    08    09     10   11    12   13    14     15    16

profitable line of business, is likely to                                                                                                     Source: IMF
push down the equilibrium.

                  Mitsui Global Strategic Studies Institute Monthly Report                                  March 2017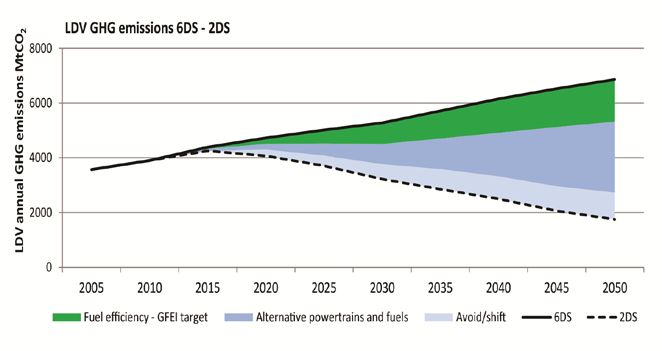
Mitsui Global Strategic Studies Institute Monthly Report                                                                                                       March 2017                                   4

Although the price of gasoline in the U.S. rose above $3.50 per gallon for a period of time in 2012, it nosedived
to the $1 range at the beginning of 2016 and has been hovering at the former $2 range lately.

Sales of cars in the U.S. are greatly influenced by the interest rate for auto loans and the price of gasoline as
car lease payments and the cost of gasoline account for a sizable part of a family’s expenses. Interest rates in
the U.S. still remain at a low level even after the rate hike at the end of 2015, the first time after in seven years,
and the one that followed in 2016. These conditions have given rise to a rapid increase in long-term auto loans
over the past seven years at extremely low rates. In combination with low gasoline prices, U.S. consumers are
more and more inclined to larger vehicles such as SUVs and pickup trucks with low fuel economy. Historically,
the U.S. light-duty vehicle market has been evenly divided between passenger cars (saloons and hatchbacks)
and light trucks (SUVs, pickups, and vans), but the share of light trucks increased to 57% in 2015 (see Figure
2), which is a record high. On the contrary, sales of small cars and hybrids are decreasing year on year.

              Fig. 2 Composition of Light Vehicle Sales in U.S.                                                                                                                    Fig. 3 Compotision of Light Vehicle Sales in China
100%                                                                                                                                                                        100%

                                                                                                                                                                            90%
                                                                                                                                                           Light Trucks

                                                                                                                                                                            80%

                                                                                                                                                                            70%

                                                                                                                                                                            60%
 50%
                                                                                                                                                                            50%
                                                                                                                                                           Passenger Cars

                                                                                                                                                                            40%

                                                                                                                                                                            30%

                                                                                                                                                                            20%

                                                                                                                                                                            10%
  0%
       1995
              1996
                     1997
                            1998
                                   1999
                                          2000
                                                 2001
                                                        2002
                                                               2003
                                                                      2004
                                                                             2005
                                                                                    2006
                                                                                           2007
                                                                                                  2008
                                                                                                         2009
                                                                                                                 2010
                                                                                                                        2011
                                                                                                                               2012
                                                                                                                                      2013
                                                                                                                                             2014
                                                                                                                                                    2015

                                                                                                                                                                             0%
                                                                                                                                                                                   08    09     10     11      12     13      14      15
               Small Car                            Middle Car                             Large Car                           Luxury Car
               CUV                                  SUV                                    Van                                 Pickup                                                   Vans    Sedan/Hatchback     MPV     SUV
                                                                                                                Source: Ward's Auto                                                                                        Source: Marklines

It is not only in the U.S. that SUV sales are increasing. In China as well, with economic development and the
increase in personal income, people are going for more expensive and novel things, and more and more SUVs
are selling. This trend was bolstered by local manufacturers’ introduction of reasonably-priced SUVs to the
market (see Figure 3). The trend of having more SUVs is universal and not specific to advanced or developing
countries. The increase in SUVs, in a general sense, pushes weight and aerodynamic resistance up, thus
deteriorating the average fuel economy of the fleet.

2. MOVES AROUND THE UNITED NATIONS FRAMEWORK CONFERENCE ON
CLIMATE CHANGE

It was agreed by the 188 participating countries during COP 21 that they would try to suppress the increase in
global average ambient temperate by the end of this century within at least 2 degrees Celsius, hopefully 1.5
degrees, of that before the industrial revolution. Participating countries are to set a target for greenhouse gas
(GHG) emissions and report the progress every five years.

                                                 Mitsui Global Strategic Studies Institute Monthly Report                                                                                              March 2017
Mitsui Global Strategic Studies Institute Monthly Report March 2017 5
The transportation sector is
Fig. 4 Reduction Scenario of GHG from Light Duty Vehicles
supposed to comprise about
20% of global GHG emissions.
Reduction of emissions from
motor vehicles, which
comprise about 90% of the
sector, is thus indispensable
for the attainment of the target.
The International Energy
Agency (IEA) has made a
calculation of the required
reduction of emissions from
light-duty vehicles to realize
“the 2 degrees Celsius
Source: GFEI Fuel Economy State of the World 2016
Scenario”. According to the
calculation, GHG emissions from light-duty vehicles (LDVs), including passenger cars and light-duty trucks) as
of 2005 was 3.5 gigatons. If no measures are taken to reduce GHG emissions from LDVs, it is supposed that it
would increase to 7 gigatons by 2050. In order to suppress warming by 2 degrees, the emissions amount must
be reduced to about 2 gigatons in the same year (see Figure 4).
Global Fuel Economy Initiative (GFEI), a joint organization led by IEA, the United Nations Environment
Programme (UNEP), and others, has set a target for global average fuel economy to attain the proposed
reduction of GHG emissions from LDVs. According to the target, the average fuel economy of all vehicles on
the globe has to be halved by 2050 compared with that of 2005, and that means that the average fuel economy
of all LDVs sold around the world must be reduced to 4.2 L/100 km by 2030 from 8.3 L/100 km in 2005. This
converts to a compounded annual reduction of 2.7% over 25 years (See Figure 5). In the GFEI report, the
average LDV fuel economy of 20
Fig. 5 Fuel Economy Evolution Compared with GFEI Target
countries (note) has decreased to 7.1
Units 2005 2013 Improvement 2030
L/100 km in 2013 from 8.3 L/100 km in L/100km 8.6 6.9
2005 (which is 2.0% p.a.) but below the -19.8%
OECD Average km/L 11.6 14.5
target. In order to achieve the target (-2.6% p.a.)
g/km 200 160
from 2014, improvements have to take L/100km 7.3 7.2
place at the pace of 2.7% per year. Non-OECD -1.4%
km/L 13.7 13.9
Among those 20 countries, the average Average (-0.2% p.a. )
g/km 169 167
of OECD member countries (11) was L/100km 8.3 7.1
reduced to 6.9 L/100 km from 7.1 L/ km -14.5%
G20 Average km/L 12.0 14.1
during the same period (2.6% p.a.), the (-2.0% p.a.)
g/km 193 165
average of Non-OECD countries, on L/100km 8.3 4.2
the other hand, barely reduced to 7.2 -49.4%
GEFI Target km/L 12.0 23.8
(-2.7% p.a.)
L/100 km from 7.3 L/100 km (0.2% g/km 193 97
p.a.). Source: Fuel Economy State of the World 2016
As of today, there are about 1 billion LDVs in operation around the world, and this is supposed to increase to
2.2 to 3 billion by 2050. Of those, the majority of the increase comes from non-OECD (developing) countries.
Therefore, achievement of the fuel economy improvement target hinges upon how it progresses in the
developing countries.
Mitsui Global Strategic Studies Institute Monthly Report March 2017Mitsui Global Strategic Studies Institute Monthly Report March 2017 6
II. DEVELOPMENT OF FUEL ECONOMY REGULATIONS BY COUNTRIES AND
REGIONS
1. OVERALL TREND OF FUEL ECONOMY REGULATIONS
Fuel economy regulations have a long history. They were first introduced in the United States, driven by the oil
crisis in the 1970s, followed by Japan in the 1980s. With the adoption of the Kyoto Protocol at COP3 (3rd
Session of the Conference of the Parties to the United Nations Framework Convention on Climate Change), the
European Union and ACEA (European Automobile Manufacturers Association) agreed to set a voluntary goal
for the fuel economy of vehicles, which was followed by EU regulations and goals for 2015 and 2021.
Among the developing countries, China adopted regulations relatively early, and the country is currently in the
4th stage of regulations for the 2020 target. After 2010, following the unprecedented hike in the price of oil
before and after the financial crisis period, many developing countries, such as Brazil (2012), Mexico (2013),
Saudi Arabia, India (2014), and Thailand (2015), have introduced fuel economy regulations, although the
contents and strictness vary by country. It is estimated that over 90% of the global car market is subject to fuel
economy regulations as of 2016, and the trend is supposed to continue (See Figure 6).
Fig. 6 Countries Fuel Economy Policy in Place
Source: GFEI Fuel Economy State of the World 2016
A majority of countries and regions have adopted the Corporate Average Fuel Economy (CAFE) method for
regulations. In this method, the standard fuel economy target is set by vehicle weight or size. It is not required
that each type of vehicle complies with the set target, but it is required that the weighted average of the fuel
economy of the cars sold in the market by each vehicle manufacturer in a year meet the company’s goal set by
the average weight of the fleet. It is not easy to compare the level of various countries’ regulations side-by-side,
as the labeling method, division by weight or size, test driving cycle, and average weight and size of vehicles
Mitsui Global Strategic Studies Institute Monthly Report March 2017Mitsui Global Strategic Studies Institute Monthly Report March 2017 7
varies by country and region.
g/km FIg. 7 Fuel Economy Targets for Passenger Vehicles
For Europe, Japan and
170
China, it is still easier to 6.9L/100km
14.2L/km
163g/km EU
160g/km
compare because the 160 Japan
average weight of all US
vehicles sold is similar, but 150
41.4mpg China
17.0km/L
not in the case of the U.S., as 137g/km
132g/km Korea
140
target numbers are set by 17.0km/L Saudi Arabia
137g/km India
vehicle footprint (a multiple of
130
vehicle tread and 130g/km 5L/100km
wheelbase) instead of 120
116g/km
weight, and the fleet average 4.87km/L 113g/km
weight is significantly bigger 110
20.3km/L
there. 114g/km under study
100 5L/100km
110g/km
Figure 7 shows the average 24.1km/L
90 97g/km 95g/km
fuel economy target of each
61.4mpg
country under the EU 89g/km
80 Under study
method (CO2 emissions for a
1 km drive). Most of the 70
countries set the immediate 15 16 17 18 19 20 21 22 23 24 25
Notes
milestone year as 2020- 1) All numbers are of passenger vehicles
2) Numbers are average of country's fleet. Converted into CO2 emissions per kilometer without
2021, and the targets taking the difference of test patterns.
beyond that are under 3) 2025 numbers of Europe and China are under discussions.
Source: Regulation authorities, ICCT and Marklines
discussion.
2. REGULATIONS BY REGION AND COUNTRY AND THEIR CHARACTERISTICS
(1) Europe
i) Outline of Regulations Fig. 8 Target and Actual of Average Fuel Economy for EU PV Fleet
g/km
In the EU, the 2015 target of average CO2
emissions from all passenger cars, which is
200
130 g/km, was introduced in 2008. As the
amount of CO2 emissions is proportionate
to the consumption of fuel, restrictions on
150
CO2 emissions have virtually the same
130
impact as fuel economy regulations. The
122.5
reason the EU denominates by CO2 119.5
emissions amount is supposedly because 100 119.2
the regulations started as a policy to counter 95
79.2
climate change. The average CO2 under study
emissions of the entire fleet in the EU in 50
00 01 02 03 04 05 06 07 08 09 10 11 12 13 14 15 16 17 18 19 20 21 22 23 24 25
2015 was 119.5 g/km, which exceeded the
Tartget for PCs Average PCs Gasoline Cars
target for the year (see Figure 8). Diesel Cars Alternative Fuel Cars
Source: European Environment Agency
Mitsui Global Strategic Studies Institute Monthly Report March 2017Mitsui Global Strategic Studies Institute Monthly Report March 2017 8
Company groups that have sold a certain number of cars in a year in the EU region are assigned an average
CO2 emissions target. The target number varies by the average weight of cars sold by the company. There
were 13 groups (pools) of companies who were subject to regulations, whose annual sales in the EU exceed
300,000 units. Companies whose sales are less than 300,000 are exempted from full compliance and given a
reduced target. There are four companies included in this category, of which three are Japanese (namely
Subaru, Mazda, and Suzuki). Those whose sales are less than 10,000 units are exempted from the regulation.
As the period between 2015 and 2019 is subject to the 2015 regulations, those who have already met the target
as of 2015 are unlikely to violate the target. It is necessary for them, however, to improve fuel economy every
year, as they are not able to jump up in a year when the 2021 target of 95g/km is due.
The 2021 regulation number is 27% severer compared with 2015 one, and is converted to 24.4km/L (in case of
gasoline car and 27.9km/L for diesel car) in the Japanese term, which is impressively high. As already
mentioned, it is not easy to compare the regulations over countries, but there does not seem to be a controversy
over the fact that EU standards are the severest in the world at this moment. Companies are required to pay 95
euro fine per unit for exceeding 1 g/km overage times the number of cars sold in a year.
ii) Characteristics of EU Car Market
The outstanding characteristic of the EU is that Fig. 9 Composition of PLV Powertrain in EU
%
gasoline and diesel cars each account for half of 100 0.1 0.1 0.1 0.1 0.2 0.3 0.3 0.7 1.3 3.8 3.5 1.4 2.2 2.4 2.7 2.8
its car market (see Figure 9). The diesel engine
is by nature higher in heat efficiency compared 31
36
41 44
with the gasoline engine (see Figure 10, which 48 49 50 52 51 45
51 55 55 53 53 52
indicates that the fuel economy of diesel cars,
whose average weight is 20% heavier, is about
50
the same as that of gasoline cars). In
combination with less expensive diesel fuel, the
69
64
fuel expense of diesel cars tends to be about 2/3 59 56 52 51 49 51
47 47 45 45
to 1/2 that of gasoline cars. As a result, the share 43 43 45 44
of diesel cars is particularly high among
company-owned cars, where the priority is on
0
the economy of owning and operating. Diesel 00 01 02 03 04 05 06 07 08 09 10 11 12 13 14 15
Gasoline Diesel Alternative Fuel Source: EEA
cars, also, are suitable and popular for big and
high-end cars because of high drivability from Fig. 10 Average Weight and CO2 Emission by Powertrain
high torque characteristics. In recent years,
smaller cars are also adopting diesel engines
due to the development of diesel engine
technologies.
iii) Transition of Corporate Average Fuel
Economy (CO2 emissions)
We can overview how emission regulations have
impacted companies’ average CO2 emissions.
Figure 11 shows the transition of corporate
average CO2 emissions and vehicle weight.
From here, we can see that from 2001 to 2005,
the average weight of most companies Source: EEA
Mitsui Global Strategic Studies Institute Monthly Report March 2017Mitsui Global Strategic Studies Institute Monthly Report March 2017 9
significantly increased, while average CO2 emissions hardly decreased, or even increased for some companies.
From 2005 to 2010, in a reversal, average CO2 emissions were pushed down, while most maintained average
vehicle weight. This is supposedly due to the effect of the introduction of a mandatory target in 2008 for 2015,
while the initial target issued by EU and ACEA was a voluntary one. In 2015, all of the companies’ CO2
emissions were pushed down to meet or exceed the given target.
g/km Fig. 11 Transition of Average CO2 Emission by Make
220
210
K01
B01
200 Vo01
M01
190
Vo05
B05
180 A01
M05 A05
EU01
170 N01 K05 M10
H05
Fd01 N05
H01 T01 Vw01 EU05
160 Vo10
O01 T05 Vx05 Vw05
C01 P01 A10
Se05 O05 B10
150 Vx01 Fd05 N10
Se01 R05 P05
Fi01 D10 Sk05
R01 Sk01 C05 EU10
Vx10 Sk10 O10 Vw10
140 Fi5 H10
Fd10 K10
R10
Se10
C10 P10
130
Fi10 T10 Vx15 M15
D15 H15 K15 O15 A15 B15
Fd15
120 Vw15 Vo15
Se15 EU15
Sk15
Fi15 N15
110 T15
C15
R15 P15
100 kg
500 600 700 800 900 1,000 1,100 1,200 1,300 1,400 1,500 1,600 1,700 1,800
Note: R:Renault D:Dacia C:Citroen P:Peugeot F:Fiat T:Toyota N:Nissan Vw:Volkswagen Se:Seat Sk:Skoda O:Opel Vx:Vaulxall Fd:Ford H:Hyundai
K:Kia A: Audi M:Mercedes-Benz B:BMW Vo:Volvo EU:EU28 01:2001 05:2005 10:2010 15:2015
Source: EEA、ICCT
Although the entire EU average met the 2015 target as of 2013, the achievement differs significantly by
company(see Figure 12). Companies such as Peugeot Citroen, Renault, Toyota, Nissan, and Volvo far
exceeded the target and are already at around the midpoint between the 2015 and 2021 targets. The
performance of German premium Mercedes-Benz, BMW, and Audi are reasonable. Fiat, Hyundai, Opel, and
Ford seem to have just met the target. Toyota seems to have pushed down its average emissions by the
introduction of a sizable number of hybrid vehicles (27% of total sales in 2015), while Renault and Nissan’s
battery electric vehicles 1 content of about 2% is effective. For premium manufacturers such as Mercedes–Benz,
BMW, Audi and Volvo, the effect of plug-in hybrid vehicles seems to be particularly high.
On the other hand, Fiat, whose average vehicle weight is the lightest among all manufacturers and whose
proportion of natural gas (CNG) vehicles is high at about 10%, has zero BEV and HEV content. Smaller cars
have less room for CO2 reduction from vehicle weight saving, which suggests that they need electrification
desperately to reduce CO2 emissions further. Opel and Dacia in the Renault group are similar to Fiat in the
sense that both are basically small-car manufacturers and have a low content of electrified vehicles. Both of
these companies face the task of reducing CO2 emissions.
1 Electric vehicle those are driven only by battery and motor.
Mitsui Global Strategic Studies Institute Monthly Report March 2017Mitsui Global Strategic Studies Institute Monthly Report March 2017 10
g/km Fig. 12 Distance to 2021 Target by Make
150
M-Benz Volvo
Toyota EU BMW
Audi
Hyundai VW
140
Peugeot Nissan
Opel 13.7
10.7 11.1
Renault Ford 9.2
-0.7
130
Fiat 9.2 5.8
0.2 7.6 8.1
11.7
120
3.5% 13.6 15.2
16.2 15.9 13.3
17.8
17.6
18.8
26.7 21.1
110
19.3 17.8
23.4% 15.2
100 13.3 11.7
9.3
90
80 kg
1,100 1,200 1,300 1,400 1,500 1,600 1,700 1,800
Note: Points represent the average CO2 emission by make. Numbers above the points are the distance from 2015 target and
the numbers below points are the distance from 2021 targets.
Source: EEA, ICCT
(2) U.S.
i) Outline of Regulations
The current fuel economy regulations were issued in 2012 by the Obama administration. They applied to the
2017 through 2025 model years (MY) and go into effect in the latter half of 2017. These regulations will be
enforced jointly by the National Highway
Traffic Safety Traffic Administration 300 g/km Fig. 13 US CAFE Standards and Actual
(NHTSA) and the Environmental
Protection Agency (EPA). NHTSA
250
regulates from a fuel economy
207
perspective, while the EPA’s approach
200
is based on CO2 emission restrictions. 173
Although the denomination of the 155
150 150
regulation figure is MPG (mile per 126
122
gallon) for NHTSA and g/km for the 123 108 100
100
EPA, the virtual effect of the two parties’ 89
regulation numbers is he same. The
50
uniqueness of US regulations lies in the 00 01 02 03 04 05 06 07 08 09 10 11 12 13 14 15 16 17 18 19 20 21 22 23 24 25
fact that the classifications of vehicles US PC Target US LT Target
US Combined Target US PC Actual
for target setting is made by vehicle US LT Actual US Combined Actual
footprint (a multiple of vehicle tread and EU PC Target EU PC Actual
Note: Numbers for 2014 are actual, target for 2022 and 2025
wheelbase), not by vehicle weight. Source: US EPA/NHTSA
Mitsui Global Strategic Studies Institute Monthly Report March 2017Mitsui Global Strategic Studies Institute Monthly Report March 2017 11
The most distinctive characteristic of US fuel economy regulations is that targets are separately set for
passenger cars (PC) and light trucks (LT) (see Figure 13). LT target numbers are approximately 30% higher
than PC’s (i.e., LT fuel consumption is higher). Although the vehicles are categorized as “trucks”, a majority of
vehicles included in the category are sports utility vehicles (SUV) and pickup trucks, which are mainly used as
passenger vehicles. The average for overall US light vehicle fuel economy is dragged down by the existence of
light trucks.
The original reason that LT regulations are laxer is that LTs require more traction than PCs to carry or tow
heavier stuff and require higher powered engines. In recent years, however, the cross utility vehicle (CUV),
which basically has the same vehicle platform as passenger cars but is categorized as LT, has become
predominant in the market. A CUVs’ fuel economy can be as good as a PC, which means that in effect these
vehicles are given laxer targets by being categorized as LT. As a result, vehicle models such as Volvo’s V70
and XC70 are categorized as PC and LT respectively and given different fuel economy targets, although these
models are based on the same vehicle platform, thus affecting the product and sales strategy of manufacturers.
Another characteristic of US regulations is that flexibility is allowed on many aspects in meeting targets, such
as mutual complementation of target achievement between PC and LT as well as supplementation over the
years.
ii) Achievement status by company
Looking at the status of meeting CAFE Fig. 14 CAFE Achievement by Make and Product Category (2014 MY)
standards, it varies by PC and LT and by
25%
company (see Figure 14). Achievement Mazda IP
20 Nissan DP
by company is dispersed for PCs.
Japanese companies are mostly well 15 Subaru LT Honda DP
Toyota DP
above the targets, while Europeans’
Variance from Traget
10 Hyundai IP
Honda LT
achievements are unimpressive. The Ford DP VW DP
reason for the difference is that, while 5 GM LT BMW LT BMW IP Subaru IP
Nissan LT VW LT
Japanese manufacturers are centered 0 FCA LT
GM DP
Ford LT
on small and medium high-efficiency Kia LT FCA DP VW IP
-5 Toyota LT
cars, including hybrid cars, in their Hyundai LT Kia IP PC LT
JLR LT Volvo LT Daimler IP US Badge ● ■
lineups, European manufacturers’ -10
Daimler LT Mazda LT Volvo IP European ● ■
Japanese ● ■
lineups are biased to larger and low -15 Korean ● ■
JLR IP
efficiency vehicles in the U.S.
-20 Corporate Average Fuel Economy
20 25 30 35 40 45
MPG
In contract, difference by company for Note: DP: Domestically-produced Passenger Car IP:Imported Passenger Car
LT:Light Truck Blue:US Maker Green: European Maker Red:Japanese Makers
the LT category is relatively small. Orange: Korean Makers
Among those, European companies Source: NHTSA
such as Daimler, Volvo, and Jaguar
Land Rover, and Koreans are behind, while US manufacturers are better off, although their average fuel
economy is similar to those of European manufacturers. The background behind this is supposed to be target
setting in favor of larger trucks, such as full-size pickups. NHTSA’s website post a list of fines paid by
manufacturers by missing CAFE targets in the past, all of which are European manufacturers (the list has not
been updated in the last few years).
Mitsui Global Strategic Studies Institute Monthly Report March 2017Mitsui Global Strategic Studies Institute Monthly Report March 2017 12
iii) Possible re-examination of CAFE targets
While CAFE targets until 2021 are fixed, targets beyond 2022 are tentative. These numbers were to be reviewed
during the 2016 to 2018 period, and are being reviewed by related parties currently (as of March 2017). In
conjunction with this, NHTSA and EPA have released the “Mid-Term Evaluation Report”, which assesses the
relevance of target settings after 2022. According to the report, the two organizations are in favor of making no
changes to the current target numbers. The reasons are: i) Technologies that are necessary to meet targets are
available at a lower cost than originally estimated; ii) Targets up to 2025 are attainable by the combination of
advanced gasoline engine technologies for the majority of a fleet, introduction of a certain proportion of mild
hybrid vehicles and a relatively small number of high-cost electrification vehicles, such as strong hybrid 2
(SHEV), plug-in hybrid (PHEV), and battery electric vehicles (BEV); iii) The auto industry as a whole has made
good progress in meeting CAFE targets for the first few years, and some are ahead of schedule.
However, the U.S. automotive industry is calling for the re-examination and relaxation of regulations, and the
Trump administration might switch priority from industrial promotion to environmental protection.
iv) ZEV Regulations in California
In the U.S., there are regional regulations on
Fig. 15 Target of Zero Emission Vehicle Sales Proportion
automobile emissions, in addition to federal to Total Sales Units (%)
regulations. California’s Zero Emission Vehicle
Year Total ZEV TZEV+ AT PZEV PZEV
(ZEV) regulations are the most representative.
12 12.0 0.8 2.2 3.0 6.0
These regulations are enforced by the
13 12.0 0.8 2.2 3.0 6.0
California Air Resources Board (CARB). The
14 12.0 0.8 2.2 3.0 6.0
state of California has a target of converting
15 14.0 3.0 3.0 2.0 6.0
100% of car sales in the state to ZEV by 2040 16 14.0 3.0 3.0 2.0 6.0
to 2050, and is promoting the diffusion of 1.5 17 14.0 3.0 3.0 2.0 6.0
million ZEVs by 2025. For that target, the state 18 4.5 2.0 2.5 - -
has mandated a minimum proportion of ZEV 19 7.0 4.0 3.0 - -
and/or other types of low emission vehicles to 20 9.5 6.0 3.5 - -
companies who sell a certain number of cars in 21 12.0 8.0 4.0 - -
the state. 22 14.5 10.0 4.5 - -
23 17.0 12.0 5.0 - -
These regulations were initially enforced during 24 19.5 14.0 5.5 - -
the 1990s and have been amended several 25 22.0 16.0 6.0 - -
Note: ZEV: BEV、FCV PZEV: PHEV、HICE AT PZEV: HEV PZEV: CNG
times. Later in 2017 (from the 2018 model
and high efficiency engine vehicles
year), the regulations enter a new stage (see Source:California Air Resources Board
Figure 15). Companies subject to the
regulations are required to obtain credits by selling a designated number of ZEVs and transitional zero emission
vehicles (TZEV, mostly PHEV). In the past, various types of partial zero emission vehicles, including SHEV and
compressed natural gas vehicles (CNGV), were granted credits, but from this year on, only BEV, fuel cell
vehicles (FCV), PHEV and hydrogen internal combustion engine (HICE) vehicles will be granted credits. If the
companies are not able to reach the designated number of credits, they are required to buy credits from others
or pay a fine.
2Hybrid system with high fuel saving effect sold by Toyota Motor and others. “Hybrid System” without notifications usually means this type, and
distinguished from “Mild Hybrid System”, which is lower in cost, has simpler mechanism and less effect of fuel saving.
Mitsui Global Strategic Studies Institute Monthly Report March 2017Mitsui Global Strategic Studies Institute Monthly Report March 2017 13
Companies are classified by size under ZEV regulations. Those that are classified as a large vehicle
manufacturer (LVM) whose annual number of sales in the state in the last three years average exceeds 20
thousand units) were the Detroit 3 (GM, Ford, and Fiat Chrysler) and the Japanese 3 (Toyota, Honda, and
Nissan) until recently. This number increases to ten by adding three German manufacturers (Daimler, BMW,
and Volkswagen) and Hyundai Motors from Korea from 2018-MY. JLR, Mazda, Mitsubishi, Subaru, and Volvo
are categorized as intermediate vehicle manufacturers (IVM: companies that sold 4,500 to 20,000). IVMs are
allowed to earn credits only by TZEV in consideration of their size of operation, while LVMs are not.
In the U.S., there are currently 14 states that are categorized as “Section 177 States”, which have chosen to
adopt California's rules as their own, and 9 states out of 14 (Maine, Vermont, Massachusetts, Rhode Island,
Connecticut, New York, New Jersey, Maryland, and Oregon) are applying the regulations with some relaxation.
In these fourteen states, which account for nearly 30% of the total U.S. market, sales of ZEVs are mandated
from this year on.
With regulatory changes from 2018-MY, carmakers no longer have time to lose in introducing BEV or FCV into
these markets, as exemplified in Toyota’s announcement that it will accelerate the development of BEVs.
(3) China
i) Outline of Regulations
Fuel economy regulations were first introduced in China in 2005, which was relatively early for a developing
country. The third stage was through 2015, and the fourth stage will last until 2020.
The average fuel economy of all passenger cars sold in China was 7.02 L/100 km in 2015, while the target was
6.9 L/100 km (14.5 km/L), thus the target was missed. The target for 2020 is set at 5.0 L/100 km (20 km/L),
which is 37% lower than 2015 and equivalent to a hefty 6.2% per year reduction. This number is similar to that
of Japan in the same year, which is 20 km/L (see Figure 16). In addition, in the fourth stage of the regulations,
privileged treatment of automatic-transmission cars and SUVs/MPVs was abolished, and severer targets were
set for heavier vehicles.
The average fuel economy of all domestically produced cars in 2015 was 6.95 L/100 km. Among those, the
average of Chinese-branded cars was 7.01 L/km and foreign-branded cars was 6.92 km/L (see Figure 17). The
L/100km
Fig. 16 China's CAFE Target Fig. 17 CAFE and Average Weight by Ownership
km/L kg
8.5
8.5 1,400
8.0 1,369
1,350
7.5
8.0 1,357
7.0 1,300
6.5
7.5 1,250
6.0
5.5 7.01 1,200
7.0
5.0
6.92 1,150
4.5
4.0 6.5 1,100
06 07 08 09 10 11 12 13 14 15 16 17 18 19 20 06 07 08 09 10 11 12 13 14 15
Targer Actual CAFE Foreign JV CAFE Chinese
Japan Target Japan Actual Average Weight Chinese Average Weight Foreign JV
Source: ICCT, MLIT Source: ICET
Mitsui Global Strategic Studies Institute Monthly Report March 2017Mitsui Global Strategic Studies Institute Monthly Report March 2017 14
average of imported cars with a larger size profile was higher at 8.44 L/100 km. In the Chinese car market,
demand is shifting to larger cars, such as SUVs, and more luxurious cars with the rise of income level, thus
showing signs of the bottoming out of the average fuel economy, particularly for Chinese-branded cars.
ii) Preferential Treatment for New Energy Vehicles
Figure 18 shows how far each manufacturer is from the 2020 fuel economy targets as of 2014. It represents the
situation that many small Chinese manufacturers are far from the 2020 targets, while some GM joint ventures
are in the similar situation.
Fig. 18 CAFE and Average Weight by Company, and Distance from 2020 Target (2014)
170%
東風裕隆
Chinese Local
Foreign JV 成都新大地
Guangdon Passenger Car
160%
Jimbei Brilliance 江鈴控股
LIfan FAW Passeenger Car
広汽吉奥 GuangdongToyota 四川一汽Toyota
一汽吉林
昌河汽車 北汽股份 Shanghai GM
150% 北汽銀翔 北汽福田
鄭州Nissan GM北盛
Beijing Hyundai Dongfeng Honda
Dongfeng Kia Dongfeng Citroen 江鈴汽車
広汽三菱
東風小康 上汽集団 東風柳州
Wulung GM 奇瑞汽車
Geely豪情 BYD Industry
140% Shanghai GM 江南汽車 長安PSA
Dongfeng Nissan Shanghai VW JAC
Lifan Passenger Car Beijin Benz
FAW Xiali Changan Ford 広汽Fiat
Changan
Great Wall
河北長安汽車 華晨控股
昌河Suzuki FAW VW
天津一汽Toyota
130% Changan Suzuki 東風乗用車 一汽海馬
海馬轎車
South East Guangdon Honda
Geely Changan Mazda Brilliance BMW
BYD
合肥長安汽車
120%
800 1000 1200 1400 1600 1800 2000
㎏
Note: Size of circles inducates the size of companies Source:ICET
On the other hand, there are some Chinese companies whose divergence from the 2020 targets is relatively
small, such as Geely Motors, BYD, and South East (Fujian) Motors. The reason these manufacturers’ average
fuel economy is low is because a significant number of new energy vehicles (NEVs) are included in their fleet
and these vehicles fuel consumption is calculated as zero (for BEV and FCV) or very low (PHEV).
As of 2015, the average fuel consumption of all domestically-produced cars was below target, but it is pushed
down by adding NEVs. The average for all domestically-produced cars come down to 6.6 L/100 km from 6.95
L/100 km, while that of Chinese-branded cars sharply drops to 5.82 L/100 km from 7.01 L/100 km. Under the
current regulations, the fuel consumption of BEVs is counted as zero and that of PHEVs is set according to
electric-drive distance. From 2015 on, the number of NEVs has jumped up due to a generous government
subsidy. Geely Auto was the highest in the reduction of fuel consumption due to a high NEV content, which
more than halved their average fuel consumption from 6.17 L/100 km to 2.69 km/L. Their average is well below
Mitsui Global Strategic Studies Institute Monthly Report March 2017Mitsui Global Strategic Studies Institute Monthly Report March 2017 15
the 2020 target (see Figure 19), and other Fig. 19 Effect of CAFE Improvement by NEVs ( 2015)
manufacturers with a high NEV content, such
CAFE(L/100km)
as BYD, South East Auto, and Beijing Auto, (excluding NEV) Rate of
have already exceeded the 2020 target level. Company Improvement
Excluding NEV Including NEV (%)
However, their average fuel consumption Geely 6.17 2.69 -56.4
excluding NEVs is high, and they all have BYD 5.88 3.15 -46.4
BYD Industry 7.98 3.30 -58.6
missed the 2015 targets if only because of
Jiangnan 7.75 3.95 -49.0
internal combustion engine cars and have BAIC Motor 6.55 4.39 -33.0
shown no improvement in the last two years, Chery 6.72 5.37 -20.1
which suggests that they have made little SAIC Motor 6.92 4.7 -32.1
JAC 7.01 5.82 -17.0
improvement in engine technology.
Linfan Motor 6.52 1.93 -70.4
JMC 9.64 5.46 -43.4
Source: ICET
III. FUTURE PROSPECTS OF AUTO INDUSTRY IN COPING WITH STRENGTHENING
FUEL ECONOMY REGULATIONS
In this chapter, we look at the future development of fuel economy regulations and the handling of this issue by
the automotive industry.
1. U.S.
NHTSA and the EPA have conducted a joint
simulation of the diffusion of fuel economy Fig. 20 Forecast of Fuel Improvement Technology
Penetration (US EPA)
improvement technologies up to 2025 when
current regulations take effect (Figure 20). Type Cars Trucks
Penetration (%) 2021 2025 2021 2025
Although technologies to be adopted differ by TDS 18 43 25 53 19
TDS 24 14 63 16 67
PC and LT, it is projected that gasoline direct
8 speed DCT 61 79 7 9
injection (GDI), turbo downsizing (TDS), and Cooled EGR 11 65 16 74
exhaust gas recirculator (EGR) are widely HEV 4 4 2 5
spread. These technologies are often used in BEV - 3 - 0.3
combination, and the estimated proliferation LRRT2 72 96 74 99
IACC2 71 73 64 55
rate in 2025 is over 90% for GDI and 70-80%
GDI 60 93 73 97
for TDS and EGR. On the other hand, the MHEV 5 20 11 39
adoption of electrification technologies is Additinal Cost ($/vehicle) 767 1,726 763 2,059
relatively limited. Mild hybrid (MHEV) 3 Note: TDS: Turbo Dow nsizing 18: 18 bar 24: 24 bar
technologies are estimated to be used for DCT: Double Clutch Transmission EGR: Exhaust Gas Recirculator
HEV: Hybrid Electric Vehicle BEV: Battery Electric Vehicle
light trucks at around 40%, but only 20% for LRRT2: Low er Rolling Resistance Tyre Level 2 IACC: Improved Accessories Level 2
passenger cars. Diffusion of strong hybrid GDI: Gasoline Direct Injection MHEV: Mild Hybrid Electric Vehicle
(HEV) 4 technology is fairly limited, at 4 to Source: Federal Register Vol.77, No. 199, October 15, 2012
3The system that uses a small motor for power assist as well as alternator. Fuel saving effect is modest, but the cost of the system is relatively low.
Standardization of the specification is in progress in Europe.
4 High energy saving effect, but the system is complicated and high cost. Is being adopted by limited manufacturers.
Mitsui Global Strategic Studies Institute Monthly Report March 2017Mitsui Global Strategic Studies Institute Monthly Report March 2017 16
5%. The proliferation of BEV is even further limited. Other than powertrains, low rolling resistance tires (LRRT),
improved accessories level 2 (IACC2: devices such as super high efficiency air conditioners) and multi-stage
double clutch transmission (DCT) 5 are supposed to be widely adopted.
If we look into the adoption rate by manufacturer (see Figure 21), US, European and some Japanese
manufacturers’ adoption rate of Mild Hybrid (MHEV) is high at 30 to 50%. Adoption rate of HEV is high at
Japanese manufacturer such as Toyota but not as high as 20%. As for European manufacturers, adoption
rate of BEV and PHEV is relatively high for passenger cars.
Fig. 21 Forecast of Fuel Improvement Technology PenetrationVehicleType and Make (2025)
Cars Trucks All
Penetration
(%) PHEV PHEV+B PHEV
TDS24 TDS27 HEV MHEV TDS24 TDS27 HEV MHEV TDS24 TDS27 HEV MHEV
+BEV EV +BEV
GM 72 3 22 61 15 50 66 9 35
Ford 70 4 1 35 2 64 20 28 23 68 9 10 32 1
FCA 72 3 27 69 8 2 47 71 5 1 36
BMW 60 20 1 49 12 65 19 50 62 20 1 49 9
Daimler 60 12 4 46 17 58 23 50 60 14 3 47 13
Porsche 56 9 2 48 32 61 28 50 57 13 1 49 25
VW 73 2 49 15 69 11 50 72 4 49 12
Geely/Volvo 46 26 5 45 18 72 6 50 54 20 3 47 13
Spyker/Saab 60 8 2 48 21 65 19 50 61 10 1 49 19
Tata/JLR 21 37 13 37 29 59 33 16 34 38 35 15 35 16
Hyundai 75 10 75 50 75 18
Kia 57 2 75 49 61 12
Honda 73 3 75 36 73 2 11
Mazda 75 3 39 2 75 5 37 2 75 3 39 2
Mitsubishi 74 3 47 4 70 7 43 2 73 4 46 3
Nissan 74 1 22 70 9 13 37 2 73 3 4 27
Subaru 75 10 17 5 75 12 38 5 75 10 22 5
Suzuki 75 16 15 7 75 50 75 13 21 6
Toyota 34 1 16 68 8 3 29 46 4 11 11
Fleet 63 3 4 20 3 67 11 5 39 64 6 5 26 2
Note: Highlighted areas are those which are forecased over 40% penetration rate. TDS24: Turbo Downsizing 24 bar TDS27: Turbo Downsizing 27 bar
HEV: Hybrid Electric Vehicle MHEV: Mild Hybrid Electric Vehicle PHEV: Plug-in Hybrid Electric Vehicle EV: Electric Vehicle BEV: Battery Electric Vehicle
Source: Federal Register Vol.77, No. 199, October 15, 2012 (by US EPA)
In general, current regulatory targets up to 2025 are supposed to be met by the combination of the sophistication
of internal combustion engine technologies, light electrification, and improvement in auxiliary devices. The
additional cost of meeting the targets is estimated to be around US$2,000 per vehicle, which is not significant.
As has already been mentioned, in the Mid-Term Report that questioned the validity of the current 2025
regulatory targets, progress in meeting the targets is fair and the cost to meet the targets is projected to be
lower than initially estimated, thus there is no need to change the current target numbers. The U.S. automobile
market, however, is heading for larger and heavier vehicles due to low interest rates and the price of gasoline.
Although the overall fuel consumption of the U.S. fleet is on a decreasing trend, it is not clear whether or not all
companies are able to meet the targets, particularly after 2020.
It is also possible that policy guidance on fuel economy improvement under the Obama administration will be
rolled back with the Trump administration taking office, in which promotion of the domestic economy and an
increase in job opportunities are the first priorities, and investment in infrastructure and deregulation of the
5A kind of high efficiency transmission system
Mitsui Global Strategic Studies Institute Monthly Report March 2017Mitsui Global Strategic Studies Institute Monthly Report March 2017 17
energy sector are policy topics. The automotive industry is lobbying for the relaxation of fuel economy
improvement targets and that they could be altered.
California’s ZEV regulations, on the other hand, will grow increasingly severe. Many carmakers have not yet
lined up BEV or PHEV in their lineups. Some are already buying credits from other companies, such as Tesla
who is abundant in credits. In the coming years, however, it is apparent such transitional measures will not be
stand.
U.S. fuel economy regulations are two faceted; one fairly strict from a global perspective, as in California’s ZEV
regulations; and the other lax federal CAFE regulations. Such double structure might be a reflection of divided
values in society, making the direction of the country unclear.
2. CHINA
China is one of the most active countries in terms of fuel economy regulations. As mentioned, progress in
improvement of conventional (internal combustion engine) cars is slow, particularly among Chinese
manufacturers, while their cars are growing in size, thus the prospects of the country as a whole are still
unknown.
Under such circumstances,
the introduction of NEVs is Fig. 22 CAFE Target and the Number of NEVs to be Sold (China)
likely to be the key for Yearly
Target # of NEV # of PCs
achieving the proposed target. Year Change Multiple for NEV
(L/100km) Sold (k) Sold (k)
(%)
Differentiated treatment that
14 7.12 -2.8 5 60 18,090
count one NEV as two or three 15 6.9 -3.1 5 140 19,530
vehicles is eased year by year; 16 6.7 -2.9 5 240 21,100
quintupled in 2017, tripled in 17 6.4 -4.5 5 400 22,780
2018, doubled in 2019, and 18 6 -6.3 3 680 24,610
19 5.5 -8.3 2 1,000 28,700
single in 2020 and after (see
20 5 -9.2 1 1,440 31,000
Figure 22). This means that Average -6.2 Cumulative 4,000 192,410
the effect of selling an NEV Source: Sales number of NEVs are assumptions to achieve CAFE target. Number
with average fuel economy is of passenger cars are forecasts.
eased every year, while the Source: ICET
required range of reduction
increases over the years, which makes it harder and harder for companies to meet regulations every year.
The Chinese government has set a national goal in the Energy Saving and New Energy Vehicle Industry
Development Plan (2012 -2020) for building up a production capacity of 2 million NEVs (mostly BEVs and
PHEVs) and the cumulative introduction of 5 million NEVs by 2020. The Innovation Center for Energy
Transportation, a Chinese think tank, has developed a scenario of achieving the 2020 average fuel economy
goal. According to the scenario, about a quarter, or 0.5 L/100 km, of the reduction out of the required 1.9 L/100
km reduction (from 6.9 L/100 km to 5.0 L/100 km) should be achieved by the introduction of NEVs, assuming
that 4 out of 5 million NEVs are passenger vehicles, (Figure 23) while the remainder is to be taken care by the
improvement of conventional powertrain and off-cycle technologies, such as regeneration brake systems and
high efficiency air conditioners. In this scenario, the required improvement of powertrain efficiency goes down
Mitsui Global Strategic Studies Institute Monthly Report March 2017Mitsui Global Strategic Studies Institute Monthly Report March 2017 18
to 3.3% per year, Fig. 23 NEVs and Energy Saving Technologies Impact on Phase I
which is not much
larger than the actual
improvement of 2%
per year from 2006
and 2014 and is
practical to achieve.
The Chinese central
government provided
a maximum of 55,000
yuan subsidy to the
manufacturer when
an NEV is sold in, and
local governments
added similar amount.
Because of this,
production and sales
of BEVs skyrocketed Source: ICET
in 2015 and 2016.
However, there has been frequent occurrence of BEV manufacturers making low-quality products and selling
them to related parties to cheat on subsidies. The central government has re-examined and decreased its
subsidy in response to this situation. On the other hand, it is presumed that the NEV regulations, a Chinese
version of ZEV regulations, will be in place in 2018. Although the details are not clear yet, it is certain that the
pressure for the introduction of NEVs will be higher if the regulations go into effect.
As such, the Chinese government’s fuel economy regulations and policies are like stepping on the accelerator
and brakes at the same time, and it is still unclear whether or not simultaneously pursuing fuel economy
improvement and industrial promotion makes sense.
3. EU
(1) Problems of Diesel Engine
Volkswagen (VW)’s “Dieselgate” scandal has severely impacted carmakers’ powertrain strategies. As emissions
of CO2 and NOx are inversely proportional to each other for internal combustion engines, if they try to improve
fuel economy (reduce CO2 emission), NOx emission increases. The scandal has revealed the problem coming
from such a trade-off, which has long been hidden from people’s eyes.
It has been pointed out that NOx emissions from diesel engines differ significantly between real and test driving.
There have been discussions on simulating a test cycle that is closer to reality. Real drive emission (RDE)
testing is the new test method that is planned to be introduced around 2020. It is clear that diesel engine
emission standards will tighten significantly with the introduction of this test method, and the addition of an SCR
(selective catalytic reduction) catalyzer will be required. Such a device costs several thousand euros, and
maintenance, such as regular filling of an urea aqueous solution, is necessary. It is not economically feasible
Mitsui Global Strategic Studies Institute Monthly Report March 2017Mitsui Global Strategic Studies Institute Monthly Report March 2017 19
for smaller cars to mount such expensive devices; thus the market share of diesel engine cars is likely to shrink,
particularly in the smaller car market.
However, it is not possible or realistic to convert diesel engine cars, which have nearly a 50% share of the
market, to gasoline, as that would increase fuel consumption and increase CO2 emissions. That turns the
spotlight on electrification.
VW made a major change in their powertrain strategy to aggressively pursue electrification. They are planning
to release over 30 electric vehicle models, including BEVs and PHEVs, and push up annual sales of such
vehicles to 2 to 3 million units by 2025. Other European manufacturers, such as Mercedes-Benz and BMW, are
also putting more emphasis on electrification.
(2) Current Situation of Electrification and Issues
If we overview the situation of electrification
Fig. 24 Proportion of Electrified Vehicles in
in Europe, the proportion of electrified cars of European New Vehicle Sales
%
any kind in passenger car sales was 2.5% in 3.0
2015, out of which HEVs were 1.5%, PHEVs
2.5
were 0.6% and BEVs were 0.4% (see Figure 0.4
24). Although the share of HEV was less than 2.0
1%, and PHEVs and BEVs combined 0.3 0.6
1.5 0.42 0.2
(hereinafter plug-in electric vehicle, or PEVs
0.16
collectively) had less than a 0.1% share, these 1.0
0.01 0.07 1.5
have been increasing rapidly in the last few 1.4 1.4
0.5 1.1
years. The share of PEVs in the EU was 0.5 0.6 0.7
higher than in Japan in 2015 (0.5%). 0.0
2009 2010 2011 2012 2013 2014 2015
HEV BEV/PHEV PHEV BEV
The share of PEVs in Europe varies by Source:ICCT
country. Norway has by far the highest share
of PEV sales, which were over 20% in 2015. Second to Norway is the Netherlands, where the share is 10%
(see Figure 25). These two countries are outstanding. The share in most of the other countries is less than 1%.
Fig. 25 Sales and Ownership of Electrified Vehicles by Country
Units in PEV Total Passenger (A)/(B)( Population (in Land Area GDP per
Country BEV PHEV
2015 (A) Car Total (B) %) thousands) (km2) capita
Sales 25,792 7,819 33,611 150,886 22.3
Norway 5,194 322,802 74,822
Ownership 60,650 10,170 70,820 2,500,000 2.8
Sales 3,158 41,290 44,448 449,350 9.9
Netherlands 16,933 41,543 43,603
Ownership 9,370 78,160 87,530 8,000,000 1.1
Sales 17,267 5,520 22,787 1,917,230 1.2
France 67,063 551,500 37,675
Ownership 45,170 9,120 54,290 32,244,000 0.2
Sales 12,082 11,111 23,193 3,206,042 0.7
Germany 81,276 357,121 40,997
Ownership 30,560 18,670 49,230 43,851,000 0.1
Japan (for Sales 10,356 12,413 22,769 4,215,889 0.5
12,704 377,900 32,486
comparison) Ownership 70,930 55,470 126,400 60,667,517 0.2
Note 1: BEV: Battery Electric Vehicle PHEV: Plug-in Hybrid Electric Vehicle PEV: Plug-in Electric Vehicle
Note 2: GDP per capita in nominal US dollars
Source: EAFO、IEA、IMF
Mitsui Global Strategic Studies Institute Monthly Report March 2017Mitsui Global Strategic Studies Institute Monthly Report March 2017 20
The reason for the high diffusion rate of PEVs in Norway and the Netherlands is due to generous public support
(see Figure 26). For example, in Norway, PEVs are exempt from import duty and value-added tax, while heavy
duties and taxes are imposed on poor fuel efficiency gasoline cars. This makes the actual price of PEVs lower
than that of gasoline cars. In addition, the cost of ownership and operation is lower due to automobile tax and
highway toll exemption for PEVs. As a result, PEV owners receive more economic merit compared with gasoline
car owners. It is common in all countries that car owners choose PEVs because they are more economical.
As of today, the cost of a PEV is significantly higher, and it has disadvantages such as the short distance of
electric drive and a longer time to charge. Therefore, it is indispensable to reduce the cost and secure merits
for users in buying, owning, and using PEVs. In the Netherlands, sales of PHEVs plunged after the elimination
of tax exemption for company-owned cars.
Fig.26 Incentives for Electrified Vehicles in European Countries
Type of Incentive Norway Netherlands France Germany
Import duty exemption Exemption from registration Purchase subsidy by CO2 BEV:€4,000 and HEV:
fee. Reduction for PHEV emission ( €6,500 for less €3,000 for vehicle value
according to CO2 emission. than 20g/km, €1,000 for 20 - less than €60,000)
60g/km) (up to 400,000 units,
Purchase Subsidy federal budget 600 million
VAT (25%) exemption Additional subsidy to replace euro, until 2020)
over 10 years old diesel cars
(€4,000 for BEV, €2,500 for
PHEV)
Road Tax (yearly) Road tax exemption Road Tax Auto tax exemption for
exemption Exemption/reduction the first 5 years BEV
registeredon to Dec 31,
2020
Reduction of corporate Reduction of road tax for Corporate auto tax exemption Tax deduction for
tax (50%) PHEV (50%) (BEV:unlimited, HEV:first 2 company owned BEV
Financial Support
years)
for Ownership
Reduction of VAT on Income tax deduction for
lease fee (25%) company cars
Decution of income tax for
PEVs and charging
infrastructure
Exemptin of road toll and Free/dedicated parking
Preferntial ferry fee for BEV, Use of bus lane
Treatment during (by city)
Use PEVs are allowed to drive
bus lane
Source: European Alternative Fuel Observatory
A persistent problem is the short cruising distance of BEVs due to the low energy density of batteries. The cost
of batteries is said to have decreased to half or a quarter of the level in 2010, when many BEVs were put on
the market, as well vehicle cost accordingly. On the other hand, the capacity of car mounted batteries has not
increased much. In the case of the Nissan Leaf, it started with a 24 kWh battery and later added a 30 kWh
version. Cruising distance per charge has increased from 200 km to nearly 300 km, but the energy contained
in the battery is equivalent to about 3 liters of gasoline. This results in the high efficiency of the electric drive,
but it also means that cruising distance can be undercut easily by the use of energy for air-conditioning. The
battery of the Leaf is supposed to weigh over 200 kg, and it is unlikely that batteries would be added without
increasing the size of its body.
Unlike BEVs, cruising distance is not a big issue for PHEVs. A PHEV’s problem is the high cost and physical
size requirement of having an internal combustion engine and electric drive system in a vehicle. For that reason,
the PHEV system is mainly being applied to expensive and middle-end or high-end cars.
Mitsui Global Strategic Studies Institute Monthly Report March 2017You can also read