Assessment of the pollution-health-economics nexus in China
←
→
Page content transcription
If your browser does not render page correctly, please read the page content below
Atmos. Chem. Phys., 18, 14433–14443, 2018
https://doi.org/10.5194/acp-18-14433-2018
© Author(s) 2018. This work is distributed under
the Creative Commons Attribution 4.0 License.

Assessment of the pollution–health–economics nexus in China
Yang Xia1 , Dabo Guan1 , Jing Meng2 , Yuan Li1 , and Yuli Shan1
1 Water   Security Research Centre, School of International Development, University of East Anglia, Norwich NR4 7TJ, UK
2 Department   of Politics and International Studies, University of Cambridge, Cambridge CB3 9DT, UK

Correspondence: Jing Meng (jm2218@cam.ac.uk) and Yuan Li (y.li4@uea.ac.uk)

Received: 14 May 2018 – Discussion started: 6 June 2018
Revised: 11 August 2018 – Accepted: 11 September 2018 – Published: 9 October 2018

Abstract. Serious haze can cause contaminant diseases that         1   Introduction
trigger productive labour time by raising mortality and mor-
bidity rates in cardiovascular and respiratory diseases. Health
studies rarely consider macroeconomic impacts of industrial        Millions of people in China are currently breathing a toxic
interlinkages while disaster studies seldom involve air pollu-     cocktail of chemicals, which has become one of the most se-
tion and its health consequences. This study adopts a supply-      rious environmental issues in China resulting in widespread
driven input–output model to estimate the economic loss re-        environmental and health problems (Meng et al., 2015,
sulted from disease-induced working-time reduction across          2016a), including increasing risks for heart and respiratory
30 Chinese provinces in 2012 using the most updated Chi-           diseases, stroke, and lung cancer. As air pollution has long-
nese multiregional input–output table. Results show a to-          term health impacts that evolve gradually over time, under-
tal economic loss of CNY 398.23 billion ( ∼ 1 % of China’s         standing the health and socioeconomic impacts of China’s air
GDP in 2012), with the majority coming from Eastern China          pollution requires continuous efforts.
and the Mid-South. The total number of affected labourers             Serious air pollution in China has largely inspired epi-
amounts to 82.19 million. Cross-regional economic impact           demic studies that examine specific health outcomes from
analysis indicates that the Mid-South, North China, and East-      air pollution as well as health cost assessments that translate
ern China entail the majority of the regional indirect loss. In-   health outcomes into monetary loss (Xu et al., 2000; Venners
deed, most indirect loss in North China, the Northwest and         et al., 2003; Kan and Chen, 2004). Existing epidemic stud-
the Southwest can be attributed to manufacturing and energy        ies simulate an exposure–response relationship between par-
in other regions, while loss in Eastern China, the Mid-South       ticulate matter (PM) concentration levels and relative risks
and the Northeast largely originate from coal and mining in        (RRs) for a particular disease (see Wong et al., 1999, 2002;
other regions. At the subindustrial level, most inner-regional     Xu et al., 2000; Venners et al., 2003), while health cost
loss in North China and the Northwest originate from coal          assessments frequently stem from patients’ perspectives at
and mining, in Eastern China and Southwest from equipment          microeconomic level, by evaluating either their willingness-
and energy, and in the Mid-South from metal and non-metal.         to-pay (WTP) to avoid disease risk (see Wang and Mullahy,
These findings highlight the potential role of geographical        2006; Wang et al., 2006; Zeng and Jiang, 2010) or the po-
distance in regional interlinkages and regional heterogeneity      tentially productive years of life loss (PPYLL) (see Wan et
in inner- and outer-regional loss due to distinctive regional      al., 2005; Miraglia et al., 2005; Mcghee et al., 2006; Bradley
economic structures and dependences between the north and          et al., 2007). However, when perceiving unhealthy labour-
south.                                                             ers as a degradation in labour input, macroeconomic implica-
                                                                   tions for production supply chains lack investigation. While
                                                                   traditional approaches for health cost estimates are able to
                                                                   provide more information on economic loss from a stand-
                                                                   point of individual patients, we suggest that they are likely
                                                                   to lose sight on the cascading effects due to labour time loss
                                                                   across interrelating industries. Meanwhile, as the health ef-

Published by Copernicus Publications on behalf of the European Geosciences Union.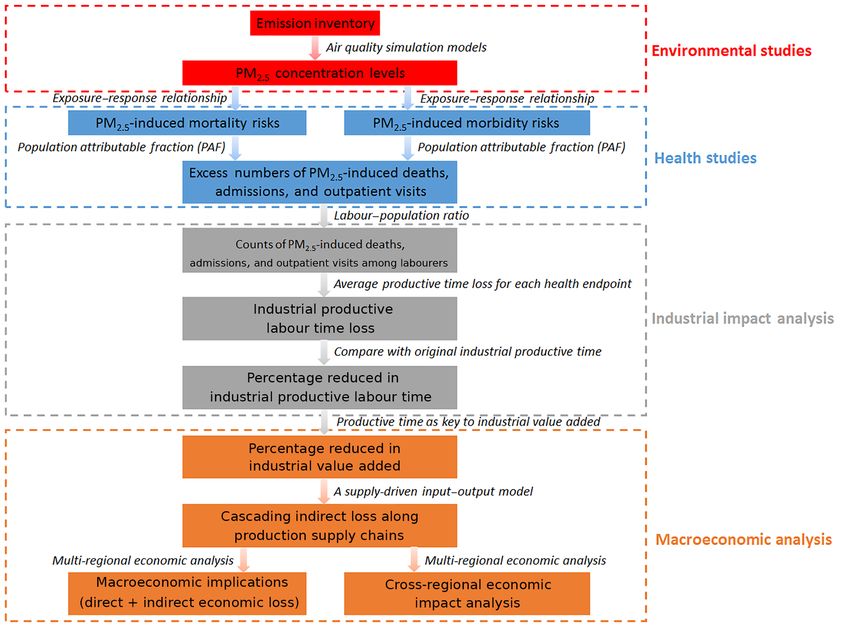
14434 Y. Xia et al.: Assessment of the pollution–health–economics nexus in China
fects of air pollution are slowly built up over time, implying supply-driven input–output (IO) model to measure the total
the lasting nature of air pollution, it has been rarely studied indirect economic loss incurred along the production supply
in current disaster risk literature. Differing from rapid-onset chain, which is measured as the total loss in output level. Fi-
disaster analyses (flood, hurricane, earthquake, etc.) that nor- nally, macroeconomic implications regarding industrial and
mally rely on quantifying damages to physical capital, air provincial economic loss can be obtained from our model
pollution affects human capital more than physical capital, results while cross-regional economic impacts can be inves-
and the resulting health impacts are relatively invisible and tigated through multiregional economic analyses.
unmeasurable. As a result, linking PM concentrations with The following sections present many mathematical sym-
health endpoints and further with macroeconomic impacts bols, formulas, and equations. For clarity, matrices are indi-
requires an interdisciplinary approach that integrates all three cated by bold, upright capital letters (e.g. X); vectors by bold,
of the elements into one. Inspired by our previous work on italicised lower case letters (e.g. x); and scalars by italicised
the socioeconomic impacts of China’s air pollution in 2007 lower case letters (e.g. x). Vectors are columns by definition,
(Xia et al., 2016), this paper applies a similar approach to so row vectors are obtained by transposition and are indicated
China’s air pollution in 2012 and also examines the cross- by a prime (e.g. x 0 ). A diagonal matrix with the elements of
regional economic impacts in order to underline the impor- vector x on its main diagonal and all other entries equal to
tant role of indirect economic loss for the year 2012. In other zero are indicated by a circumflex (e.g. x̂).
words, it aims to investigate the overall economic loss re-
sulting from health-induced labour time reduction among all 2.2 Provincial PM2.5 concentration levels
Chinese labourers for year of 2012. Given that the major-
ity of economic loss originates from secondary industries, We referred to Chinese provincial PM2.5 concentration lev-
this paper also specifically analyses the key sectors in sec- els estimated by Geng et al. (2015), where the authors im-
ondary industries that account for the greatest proportions of proved the method for estimating long-term surface PM2.5
both direct and indirect economic loss in each great region concentrations by using satellite remote sensing and a chem-
in China. By doing so, future policymakers and researchers ical transport model to assess the provincial PM2.5 concen-
could obtain an alternative macroeconomic tool to better con- tration levels in China during 2006–2012. The model domain
duct cost-benefit analysis for any environmental or climate includes a map of surface PM2.5 concentrations at a resolu-
change related policy design, and to comprehend health cost tion of 0.1◦ × 0.1◦ over China using the nested-grid GEOS-
studies in its macroeconomic side. Chem model with the most updated bottom-up emission in-
ventory and satellite observations from the Moderate Reso-
lution Imaging Spectroradiometer (MODIS) and Multi-angle
Imaging SpectroRadiometer (MISR) instruments (Geng et
2 Methods
al., 2015).
2.1 Methodological framework 2.3 Health impacts from PM2.5 concentration levels
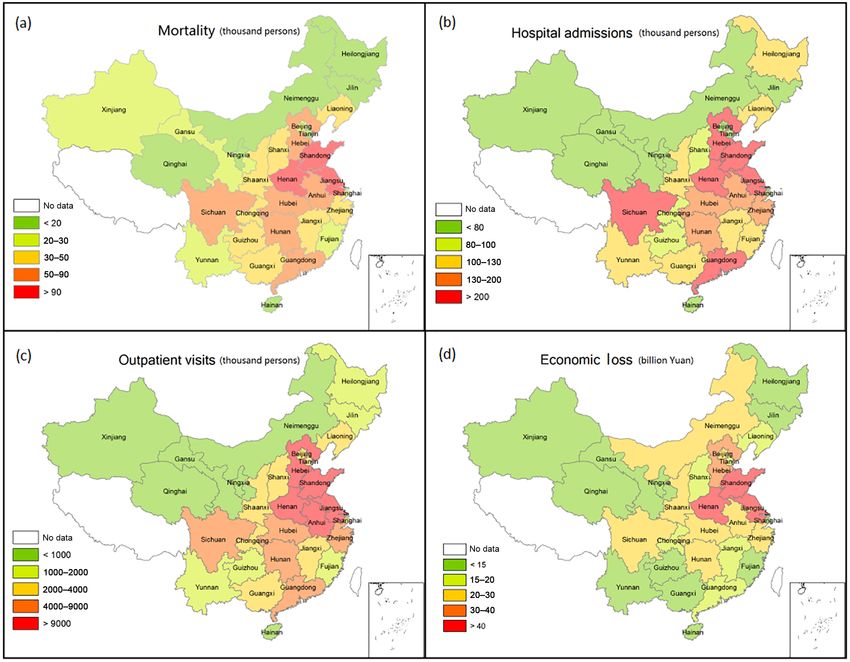
Figure 1 illustrates the overall methodological framework de- Epidemic studies on PM2.5 -induced health outcomes have
veloped by this study. It involves four main parts that are linked PM2.5 air pollution with various health endpoints by
distinguished by four colours. Detailed methods that connect using exposure–response coefficients. This paper focuses on
each part in the flow chart are shown near the arrows. the impacts of PM2.5 pollution on mortality, hospital ad-
PM2.5 concentration levels for 30 provinces of China were missions, and outpatient visits. We referred to an integrated
first identified from an emission inventory using an air qual- exposure–response model developed by Burnett et al. (2014)
ity simulation model. The relative risks for PM2.5 -induced to estimate the relative risks for PM2.5 -induced mortality
mortality (ischemic heart disease (IHD), stroke, chronic ob- (IHD, stroke, COPD, LC), hospital admissions (cardiovas-
structive pulmonary disease (COPD), and LC), hospital ad- cular and respiratory diseases), and outpatient visits (all
missions (cardiovascular and respiratory diseases), and out- causes).
patient visits (all causes) were estimated using an integrated An IER model captures concentration–response relation-
exposure–response (IER) model based on which popula- ships with a specific focus on ischemic heart disease, stroke,
tion attributable fraction (PAF) can be calculated to estimate chronic obstructive pulmonary disease, and lung cancer. The
counts of PM2.5 -induced deaths, admissions, and outpatient relative risk for the mortality estimation function for the four
visits. Additionally, counts of mortality, hospital admissions, diseases were shown in Eq. (1).
and outpatient visits were further translated into a produc-
tive working time loss that was compared with the original For z < zcf RRIER (z) = 1 (1)
industrial working time without any PM2.5 -induced health For z ≥ zcf RRIER (z) = 1 + α{1 − exp[−γ (z − zcf ) ]} δ
effects (full employment and full productivity) to derive the
percentage reduction in industrial value added. Moreover, re- z: PM2.5 exposure in micrograms per metre cubed; zcf :
ductions in industrial value added served as an input in the counter-factual concentration level below which no addi-
Atmos. Chem. Phys., 18, 14433–14443, 2018 www.atmos-chem-phys.net/18/14433/2018/
Y. Xia et al.: Assessment of the pollution–health–economics nexus in China                                               14435

Figure 1. Methodological framework.

tional health risk is assumed; δ: the strength of PM2.5 ; and    coefficients to quantify the relationship between different
γ : the ratio of RR at low-to-high exposures                     levels of PM2.5 exposures and the resulting health outcomes.
   Then, the calculated RR was converted into an attributable       Counts of PM2.5 -induced hospital admissions, and outpa-
fraction (AF) in Eq. (2).                                        tient visits were analogously estimated using Eqs. (2) and
       RR − 1                                                    (3).
AF =                                                  (2)
         RR
                                                                 2.4   Industrial labour time loss
Additionally, excess counts of PM2.5 disease-induced mor-
tality were estimated in Eq. (3).                                Each labourer is assumed to work 8 h every day and 250 days
E = AF × B × P                                             (3)   during 2012. For PM2.5 -induced mortality, each death will
                                                                 result in a total 250 working days lost regardless different
E: PM2.5 -induced mortality counts, B: the national level in-    disease types. For PM2.5 -induced morbidity, each cardiovas-
cidence of a given health effect, which was applied for all      cular admission will result in 11.9 working days lost while
provinces because of limited data; P : the size of the exposed   each respiratory admission causes 8.4 working days lost (Xia
populations.                                                     et al., 2016). Meanwhile, we provided a range for the labour
   For morbidity, we calculated cardiovascular and respira-      time loss estimation of outpatient visits due to data unavail-
tory hospital admissions and outpatient visits for all causes    ability, which ranges from 2 to 4 h per outpatient visit (Xia
using a log-linear response function. The RRs for each cate-     et al., 2018). We assumed each outpatient visits the clinic
gory of morbidity were calculated using Eq. (4) (Jiang et al.,   once during the year. Then, provincial mortality, hospital ad-
2015).                                                           missions, and outpatient visit counts were scaled down to
                                                                 counts among labourers according to labour–population ra-
RR = eβx                                                   (4)
                                                                 tios across all 30 of the provinces (National Statistical Year-
β: the parameter that describes the depth of the curve (Ta-      book, 2013). We further distributed provincial mortality, ad-
ble S1 in the Supplement). They are the exposure–response        missions, and outpatient counts into 30 industries accord-

www.atmos-chem-phys.net/18/14433/2018/                                         Atmos. Chem. Phys., 18, 14433–14443, 2018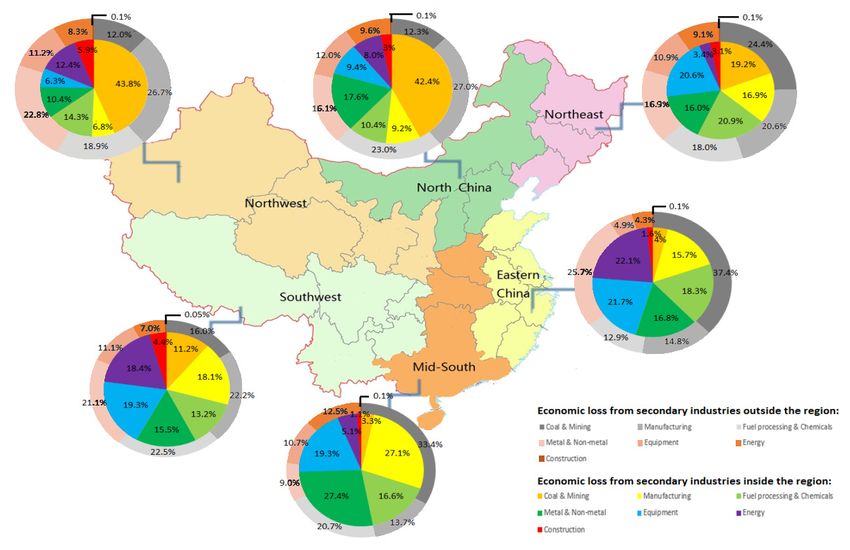
14436                                                    Y. Xia et al.: Assessment of the pollution–health–economics nexus in China

ing to an industrial-total provincial labour ratio. We used                 The basic Leontief IO model (Meng et al., 2018) can be
industrial-total provincial output ratio instead where certain            therefore derived in matrix notation (Eq. 7a and 7b).
industries’ labour data is missing. Additionally, labour time
loss for each case of mortality, admission, and outpatient visit          x = Ax + f                                                    (7a)
were multiplied by industrial counts of mortality, admission,                               −1                 −1
                                                                          x = (I − A)            f , L = (I − A)                        (7b)
and outpatient visit in each province, respectively, and the
results were summed up to derive the industrial total labour              A: matrix of technical coefficients, aij , where aij = zij /xj ;
time loss due to PM2.5 -induced mortality and morbidity.                  L: the Leontief inverse matrix that measures the impact of
Moreover, we compared the industrial total labour time loss               value change in the final demand of a sector on the total out-
to the original labour time with full employment and labour               put value on the economy (Miller and Blair, 2009).
productivity under no PM2.5 -induced health impacts. The re-                 At the same time, a supply-driven IO model takes a rotated
sults show the percentage reductions in industrial working                view of Leontief IO model that shows an opposite influenc-
time, which were used as an indicator for percentage reduc-               ing direction between sectors. It suggests that production in
tions in industrial value added in a supply-driven IO model,              a sector can affect sectors purchasing its outputs as inputs
as we considered labour as the major component for indus-                 during their production processes and it has a supply-side fo-
trial value added. We need to clarify that the industries can             cus. A supply-driven IO model is used to calculate the impact
express very different levels of dependencies on capital and              of changes in primary inputs on sectoral gross production.
labour in reality. However, percentage reductions in labour               For a supply-driven IO model, the basic structure is shown in
time were used as a direct indicator for percentage reduction             Eq. (8a) and (8b).
in industrial value added due to the assumption of the pro-
duction expansion path underlying the input–output model.                 x 0 = v 0 (I − B)−1                                           (8a)
                                                                              0     0                   −1
An input–output model assumes that proportional increase                  x = v G, G = (I − B)                                          (8b)
in industrial output can only be achieved by simultaneous
increases in both capital and labour, indicating that any re-             B: the allocation coefficient (direct output coefficient), where
duction in an input can directly constrain the output growth              bij = zij /xi . It refers to the distribution of sector i’s outputs
in all industries.                                                        in sector j ; v: matrix of industrial value added, including
                                                                          capital and labour input; G: the Ghosh inverse matrix, which
                                                                          measures the economic impacts of changes in a sector’s value
2.5   Indirect economic loss on production supply chain
                                                                          added on other sectors’ output level.

We employed a supply-driven IO model to evaluate the in-
direct economic loss due to PM2.5 -induced mortality and                  3       Results
morbidity along production supply chain. A supply-driven
IO model was developed based on a traditional Leontief IO                 3.1      Total number of affected labour and total economic
model with the spirit of a “circular economy”. A supply-                           loss
driven IO model was derived from a traditional Leontief IO
model. Input–output analyses have been widely applied to                  Firstly, regarding the total number of affected labourers
studies on energy usage (Guan et al., 2014), environmental                and total economic loss, the total economic loss result-
pollution (Meng et al., 2015, 2016b), climate change miti-                ing from PM2.5 -induced health outcomes in China 2012 is
gation and adaptation (Feng et al., 2013; Wiedmann et al.,                CNY 398.23 billion, which corresponds to almost 1 % of na-
2006), and economic perturbations (Steenge and Bočkarjova,               tional GDP in 2012. The total number of affected labourers in
2007; Cho et al., 2001; Santos and Haimes, 2004; Crowther                 China is 0.80 million for PM2.5 -induced mortality, 2.22 mil-
and Haimes, 2005) as well as to different scales, ranging                 lion for PM2.5 -induced hospital admissions, and 79.17 mil-
from national to regional level. For a basic Leontief IO                  lion for PM2.5 -induced outpatient visits (Fig. 2). Figure 2
model, the total output of sector i in an n-sector economy                presents the provincial counts of PM2.5 -induced mortality,
can be illustrated in Eqs. (5) and (6).                                   hospital admissions, outpatient visits, and economic loss
                                                                          with least severe and most severe situations shown from
                                                Pn
                                                                          green to red. For total populations of PM2.5 -induced mor-
xi = zi1 + . . .. + zij + . . .. + zin + fi =    j =1 Zij +fi      (5)    tality and morbidity among 30 provinces, Henan and Shang-
                                                                          dong province have the largest total counts of PM2.5 -induced
x = Z+f                                                            (6)
                                                                          mortality and morbidity, which is consistent with the findings
                                                                          in 2007 study (Xia et al., 2016). Guangdong province has
xi : the total output of sector i; nj=1 Zij : the monetary value
                                  P
                                                                          the greatest counts of PM2.5 -induced hospital admissions at
of sector i’s output in all other sectors; fi : sector i’s final          291 thousand, where a substantial increase of 175 thousand
demand that includes household final consumption, govern-                 can be observed compared with results in 2007. It almost
ment consumption, capital formation, and exports.                         doubles its provincial count of outpatient visits and triples

Atmos. Chem. Phys., 18, 14433–14443, 2018                                                        www.atmos-chem-phys.net/18/14433/2018/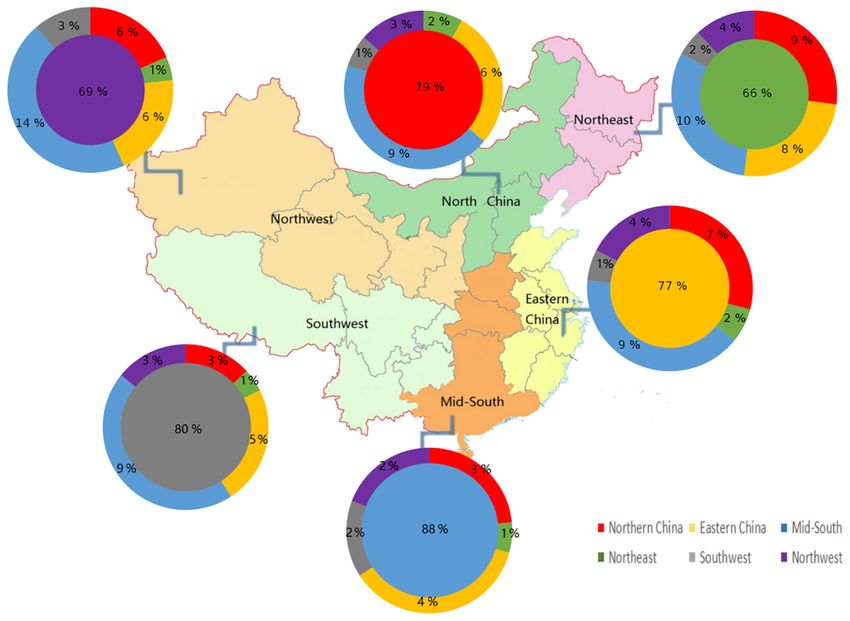
Y. Xia et al.: Assessment of the pollution–health–economics nexus in China                                                            14437

Figure 2. Provincial counts of PM2.5 -induced mortality, hospital admissions, outpatient visits, and economic loss in the study area, 2012.
Provincial counts of PM2.5 -induced mortality (a), hospital admissions (b), outpatient visits (c), and economic loss (d) are displayed in the
four panels above, with least severe and most severe situations shown from green to red. We did not consider Tibet due to the lack of data.

its mortality counts. Meanwhile, increases can be observed               and morbidity, which results in substantial provincial labour
in both counts for the Northwest region, which includes                  time loss. We also calculated the economic loss in China’s
Shaanxi, Gansu, Qinghai, Ningxia, and Xinjiang provinces.                six greater regions. Eastern China and the Mid-South appear
Specifically, the count of hospital admissions in the Shaanxi            to be the two regions suffering the greatest economic loss,
province in 2012, 100 thousand, also doubled that of the                 amounting to CNY 153.39 and 119.21 billion, respectively,
50 thousand in 2007. An even sharper increase of admission               and accounting for 39 % and 30 % of total economic loss in
counts can be seen in the Xinjiang province, where the num-              China, 2012. It is in line with the findings from 2007 study
ber is almost 7 times that from 2007.                                    (Xia et al., 2016), where the economic loss of these two re-
                                                                         gions are CNY 115.33 and 80.88 billion, respectively. There-
3.2   Economic loss by provinces, regions, and industries                fore, there has been a remarkable rise in economic loss for the
                                                                         Mid-South region. Primary industries, including agriculture
Secondly, concerning economic loss by province, region, and              and fishing, entailed the economic loss of CNY 19.12 bil-
industry at the provincial level (Fig. 2), the economic loss in          lion. Secondary industries include all of the manufacturing,
the Henan province exceeds that of the Jiangsu province in               energy, and construction sectors, and they entail the greatest
2007 (CNY 55.90 billion), becoming the province suffering                proportion of economic loss at CNY 320.06 billion (80 % of
the greatest economic loss at 56.37 billion, accounting for              total economic loss). Tertiary industries (e.g. retail services
14 % of the total economic loss in China. This is followed               and entertainment) account for the remaining 15 % of total
by Jiangsu province at CNY 45.32 billion and Shangdong                   economic loss at CNY 59.05 billion.
province at CNY 43.23 billion. This is because all three of the
provinces have the largest counts of PM2.5 -induced mortality

www.atmos-chem-phys.net/18/14433/2018/                                                  Atmos. Chem. Phys., 18, 14433–14443, 2018
14438 Y. Xia et al.: Assessment of the pollution–health–economics nexus in China
Figure 3. Cross-regional economic loss analysis. The diagram demonstrates the interregional economic impacts due to their interdependen-
cies. The left-hand side shows the regional indirect economic loss while the right-hand side denotes the sources for these indirect economic
losses. The proportion of regional indirect loss among regional total economic loss is displayed next to each region’s name on the left-hand
side.
3.3 Cross-regional economic loss at CNY 16.99 and 12.17 billion, respectively. This finding
highlights the increasing significance in capturing the indus-
trial and regional interdependencies and indirect economic
Additionally, this case study also examined the cross- loss in disaster risk analysis because such interdependencies
regional economic losses between the six greater regions can largely raise the overall economic loss far beyond the di-
in China. As one significant advantage of the input–output rect economic loss and constitute a noticeable component of
model is to capture the industrial and regional interdepen- total economic loss.
dencies, it is effective to measure the propagating disaster-
induced indirect economic loss along the production sup- 3.4 Regional direct and indirect loss from secondary
ply chain. We traced the cross-regional economic loss due sector
to their interlinkages, such as interregional trade, as shown
in Fig. 3. The diagram demonstrates the interregional eco- As secondary sectors play a vital role in the Chinese econ-
nomic impacts due to their interdependencies. The propor- omy and entails greatest economic loss among the three in-
tion of regional indirect loss among regional total economic dustries, we specifically analysed the regional economic loss
loss is displayed next to each region’s name on the left-hand that directly and indirectly resulting from secondary sectors
side. Although the majority of regional economic loss came both inside and outside of a region. Focusing on the sec-
from the direct economic loss that occurred within the region ondary sector, Fig. 4 illustrates both direct and indirect eco-
across almost all six of the regions, the Northeast, Eastern nomic loss originating from each region and outside the re-
China, and the Northwest still entail great indirect economic gion. As can be seen from the diagram, despite the fact that
loss from other regions, which occupies 31 %, 21 %, and the majority of economic loss resulting from the secondary
30 % of the total regional economic loss, respectively. In the sectors originated from inside the region for all six of the
Northeast, 18 % of its total regional economic loss originated greater regions in China, in the Northwest and the North-
from North China and Mid-South, including CNY 1.84 bil- east, economic loss attributed to secondary sectors outside
lion from North China and CNY 1.85 billion from Mid- the region still constituted a considerable share due to in-
South. Similarly, the Mid-South is responsible for 9 % of the dustrial and regional interdependencies. Secondary sectors
economic loss in Eastern China at CNY 13.36 billion. It ac- in the Mid-South, Eastern China, and North China became
counts for an even larger proportion of regional economic three major sources for indirect economic loss across all six
loss in the Northwest at 13 %. Meanwhile, Eastern China also of the regions. For instance, in the Northwest, economic loss
accounts for another 8 % of the total regional economic loss from secondary sectors in the Mid-South, Eastern China, and
in Northeast, which amounts to CNY 1.66 billion. Overall, North China account for 14 %, 6 %, and 6 % of total regional
the Mid-South accounts for the largest amount of indirect indirect loss from secondary sectors outside the region, at
economic loss in other Chinese regions at CNY 24.65 bil- CNY 2.20, 0.99, and 0.90 billion, respectively. Similarly, in
lion, which is followed by North China and Eastern China the Northeast, economic loss from secondary sectors in these
Atmos. Chem. Phys., 18, 14433–14443, 2018 www.atmos-chem-phys.net/18/14433/2018/Y. Xia et al.: Assessment of the pollution–health–economics nexus in China 14439
Figure 4. Regional direct and indirect economic loss from secondary sectors. The inner ring denotes the direct economic loss originating
from secondary sectors inside the region, while the outer ring stands for the indirect economic loss from secondary sectors in other regions.
Percentage shown on the inner ring shows the proportion of direct economic loss regarding total regional economic loss and percentages
shown on the outer ring are the proportions of indirect loss from other regions relative to total regional indirect economic loss.
three regions occupy 10 %, 8 %, and 9 % of total regional among subindustries inside and outside the region. They in-
indirect loss from secondary sectors outside the region, at clude coal and mining, manufacturing, fuel processing and
CNY 1.66, 1.33, and 1.46 billion, respectively. This results chemicals, metal and non-metal, equipment, energy, and con-
from their geographical distance to the Mid-South, Eastern struction as displayed in Fig. 5. In North China, the North-
China, and North China, as well as close trade relationships west and the Southwest, most of their indirect economic
with these three regions. The significant roles of Mid-South loss from secondary sectors outside the region came from
and Eastern China in interregional trade have been confirmed manufacturing with 27.0 %, 26.7 %, and 22.2 %, respectively.
earlier by Sun and Peng (2011), where they pointed out the The second largest source in these three regions that ac-
export-oriented nature for trades in Eastern China and the counts for economic loss from secondary sectors in other re-
Mid-South, and their close trade relations with Northwest re- gions is energy, with the greatest amount occurring in North
gions with respect to the import of raw materials. Likewise, China at CNY 2.32 billion, followed by the Northwest at
it is noticeable that indirect economic loss is more likely to CNY 1.29 billion, and the Southwest at CNY 1.26 billion.
come from neighbour-regions, which highlights the possibil- In contrast, coal and mining accounts for the majority of
ity that short geographical distances might accelerate interre- indirect loss from secondary sectors outside the region for
gional trade and strengthen regional interlinkages. Eastern China, the Mid-South and the Northeast at 37.4 %
(CNY 10.83 billion), 33.4 % (CNY 3.65 billion), and 24.4 %
3.5 Direct, indirect loss from subindustries in (CNY 1.30 billion), respectively. One possible underlying
secondary sector reason is that economies in the Northwest, North China,
and the Southwest are mainly dominated by coal and min-
The secondary sector was further broken down into seven in- ing but rely on the import of manufacturing products from
dustries in order to examine the major economic loss sources
www.atmos-chem-phys.net/18/14433/2018/ Atmos. Chem. Phys., 18, 14433–14443, 201814440 Y. Xia et al.: Assessment of the pollution–health–economics nexus in China
Figure 5. Economic loss from seven industries in secondary sector inside and outside the region. The inner circle shows the economic loss
from secondary sector inside the region. The size of circle stands for the different proportions of inner-regional economic loss relative to total
regional economic loss. Colours demonstrate economic loss from seven sectors in secondary sector inside the region. Meanwhile, the outer
circle indicates the economic loss from secondary sectors outside the region. Economic loss resulting from seven sectors are shown in black
and white. Percentages shown on the outer circle are the proportions of indirect loss from other regions relative to total regional indirect
economic loss.
other regions, whereas Eastern China, the Mid-South, and 4 Discussions
the Northeast have more prosperous manufacturing indus-
tries but tend to heavily depend on imports of raw materi-
als from coal and mining industries in the Northwest, North PM2.5 has seriously undermined human health by inducing
China, or the Southwest. With regards to the economic loss contaminant diseases, including IHD, Stroke, COPD and LC.
from secondary sectors inside each region, it shows diver- These diseases have resulted in substantial numbers of mor-
sified patterns across the six greater regions. Coal and min- tality and morbidity that further cause labour degradation in
ing account for the largest part of inner-regional economic terms of productive working time loss along production sup-
loss in North China and the Northwest at 42.4 % and 43.8 %, ply chain. Therefore, there is a growing need to explore the
respectively. Equipment and energy appear to be two major macroeconomic implications of PM2.5 -induced health effects
sources for inner-regional economic loss Eastern China and that can also capture industrial and regional interdependen-
the Southwest, while metal and non-metal and manufactur- cies. However, existing health cost studies assess the health
ing constitute considerable proportions in inner-regional eco- costs at the microeconomic level without an investigation
nomic loss from secondary sectors in the Mid-South, which over these linkages on the production supply side. Mean-
reach CNY 21.86 and 21.61 billion, occupying 27.4 % and while, disaster risk studies rarely involve PM2.5 pollution as a
27.1 %, respectively. disaster that harms human capital more than physical capital.
Thus, methods to quantify the direct damages to infrastruc-
ture seem to be inefficacious when measuring the “damages”
to human health. Inspired by the previous study on China’s
air pollution in 2007 (Xia et al., 2016), the current study ap-
plies an interdisciplinary approach to assess the macroeco-
Atmos. Chem. Phys., 18, 14433–14443, 2018 www.atmos-chem-phys.net/18/14433/2018/Y. Xia et al.: Assessment of the pollution–health–economics nexus in China 14441 nomic impacts of PM2.5 -induced health effects in China 2012 possibility that short geographical distance might accelerate by perceiving reduced labour time as an indicator for reduced interregional trade and strengthen regional interlinkages. In value added so that it can be fed back into a supply-driven North China, Northwest, and Southwest, most of their indi- IO model, and health studies can be integrated into impact rect economic losses originated from manufacturing indus- evaluation and interdependency analysis. The current case tries outside the region with 27.0 %, 26.7 %, and 22.2 %, re- study applies an interdisciplinary approach by combining en- spectively. The second largest source in these three regions vironmental, epidemiological, and macroeconomic studies to that accounts for economic loss from secondary industries in assess the macroeconomic impacts of PM2.5 -induced health other regions is energy, with the greatest amount occurring effects in China during 2012. In the model, environmental in North China at CNY 2.32 billion. In contrast, coal and phenomenon was related with health endpoints using an in- mining accounts for the majority of indirect loss from sec- tegrated exposure–response model, reduction in labour time ondary industries outside the region for Eastern China, the was estimated based on the pollution-induced mortality and Mid-South, and the Northeast at 37.4 % (CNY 10.83 billion), morbidity counts, and industrial reduced labour time was per- 33.4 % (CNY 3.65 billion) and 24.4 % (CNY 1.30 billion), ceived as an indicator for industrial reduced value added, respectively. Such distinctive compositions of outer-regional which was further fed back into a supply-driven input–output economic loss might be due to the different economic struc- model. By doing so, health studies can be integrated into im- tures and dependences between North China, the Northwest, pact evaluation and interdependency analyses. and the Southwest, and Eastern China, the Mid-South, the The results are threefold. Firstly, the total economic Northeast. Turning to the economic loss from secondary in- loss from China’s air pollution during 2012 amounts to dustries inside the region, regions show heterogeneity. Coal CNY 398.23 billion with the majority coming from Eastern and mining account for the largest part of inner-regional eco- China (39 %) and the Mid-South (30 %). The total economic nomic loss in North China and the Northwest at 42.4 % and loss is equivalent with 1.0 % of China’s GDP in 2012, and 43.8 %, respectively, equipment and energy are two major the total number of affected labourers rises to 82.19 mil- sources for inner-regional economic loss Eastern China and lion. Compared with the study in 2007 (Xia et al., 2016), the Southwest, while metal and non-metal and manufactur- although secondary industries remain as the industries which ing constitute considerable proportions in inner-regional eco- encountered the most economic loss (80 %), changes can be nomic loss from secondary industries in the Mid-South. noticed for economic loss at the provincial level. Henan and There are some final remarks for policymakers and re- Jiangsu became two provinces that suffered the greatest eco- searchers here from this typical air pollution issue. On the nomic loss at CNY 56.37 and 45.32 billion, respectively, fol- one hand, given the prosperous interregional trade, pol- lowed by Shangdong province with a total economic loss icymakers are required to conscientiously consider these of CNY 43.23 billion. Henan and Shangdong provinces also increasingly strengthened industrial and regional linkages have the largest numbers of PM2.5 -induced mortality, hos- in climate change mitigation and adaptation policy design pital admissions, and outpatient visits. Secondly, the study based on a better understanding of implications resulting highlights the cascading indirect economic loss triggered from any climate change-induced health issues at both micro by industrial and regional interdependencies in health cost and macroeconomic levels. Meanwhile, sufficient adaptation assessments. In 2012, indirect economic loss constituted a measures are required to be implemented along with the cli- significant part of the total regional economic loss in the mate change mitigation strategies in operation. The purpose Northeast, Eastern China and the Northwest, which occu- of this is to expand the economy beyond the regional geog- pied 31 %, 21 % and 30 % of the total regional economic raphy and natural endowment and to release the current re- loss, respectively. Overall, the Mid-South accounts for the liance on the economy on labour-intensive sectors (Mauricio largest amount of indirect economic loss in other Chinese Mesquita, 2007). On the other hand, researchers of epidemic regions at CNY 24.65 billion, which is followed by North studies should actively integrate these interdependencies into China and Eastern China at CNY 16.99 and 12.17 billion, future health cost evaluations, while researchers of disaster respectively. Additionally, the study specifically focuses on risk analyses should not lose sight on “persistent” disasters seven sectors in the secondary industries and differentiates as described in this study, which affect more human capital economic loss from these sectors inside the region from those and may imply degradation in production factor inputs. outside the region. In Northwest and Northeast, economic loss attributed to secondary industries outside the region still constitute a considerable share due to industrial and regional Data availability. The data that support the findings of this study interdependencies at 31 % and 34 % of total regional eco- are available from the corresponding author on request. nomic loss, respectively. Secondary industries in the Mid- South, Eastern China, and North China became three major sources for indirect economic loss across all the six regions. The Supplement related to this article is available Indeed, we also suggest that indirect economic loss is more online at https://doi.org/10.5194/acp-18-14433-2018- likely to come from neighbour-regions, which highlights the supplement. www.atmos-chem-phys.net/18/14433/2018/ Atmos. Chem. Phys., 18, 14433–14443, 2018
14442                                               Y. Xia et al.: Assessment of the pollution–health–economics nexus in China

Author contributions. DG and YX designed the study and YX car-             mary PM2.5 emissions, Environ. Res. Lett., 9, 024010,
ried it out. JM constructed the multiregional input–output table for       https://doi.org/10.1088/1748-9326/9/2/024010, 2014.
China, 2012. YL and YS provided the requested dataset. YX pre-          Jiang, X., Zhang, Q., Zhao, H., Geng, G., Peng, L., Guan, D., Kan,
pared the paper with contributions from all co-authors.                    H., Huo, H., Lin, J., Brauer, M., Martin, R. V., and He, K.: Re-
                                                                           vealing the hidden health costs embodied in Chinese exports, En-
                                                                           viron. Sci. Technol., 49, 4381–4388, 2015.
Competing interests. The authors declare that they have no conflict     Kan, H. and Chen, B.: Particulate air pollution in urban areas of
of interest.                                                               Shanghai, China: health-based economic assessment, Sci. Total
                                                                           Environ., 322, 71–79, 2004.
                                                                        Mcghee, S. M., Ho, L. M., Lapsley, H. M., Chau, J., Cheung, W.
Special issue statement. This article is part of the special issue         L., Ho, S. Y., Pow, M., Lam, T. H., and Hedley, A. J.: Cost
“In-depth study of air pollution sources and processes within Bei-         of tobacco-related diseases, including passive smoking in Hong
jing and its surrounding region (APHH-Beijing) (ACP/AMT inter-             Kong, Tob. Control, 15, 125–130, 2006.
journal SI)”. It is not associated with a conference.                   Meng, J., Liu, J., Xu, Y., and Tao, S.: Tracing Primary PM2.5
                                                                           emissions via Chinese Supply Chains, Environ. Res. Lett., 10,
                                                                           054005, https://doi.org/10.1088/1748-9326/10/5/054005, 2015.
                                                                        Meng, J., Liu, J., Fan, S., Kang, C., Yi, K., Cheng, Y., Shen, X., and
Acknowledgements. This work was supported by the National
                                                                           Tao, S.: Potential health benefits of controlling dust emissions in
Key R&D Program of China (2016YFA0602604), the National
                                                                           Beijing, Environ. Pollut., 213, 850–859, 2016a.
Natural Science Foundation of China (41629501, 71873059,
                                                                        Meng, J., Liu, J., Xu, Y., Guan, D., Liu, Z., Huang, Y., and Tao,
and 71533005), the Chinese Academy of Engineering (2017-
                                                                           S.: Globalization and pollution: tele-connecting local primary
ZD-15-07), the UK Natural Environment Research Council
                                                                           PM2.5 emissions to global consumption, P. R. Soc. A., 472,
(NE/N00714X/1 and NE/P019900/1), and the Economic and Social
                                                                           20160380, https://doi.org/10.1098/rspa.2016.0380, 2016b.
Research Council (ES/L016028/1).
                                                                        Meng, J., Mi, Z., Guan, D., Li, J., Tao, S., Li, Y., Feng, K., Liu, J.,
                                                                           Liu, Z., Wang, X., Zhang, Q., and Davis, S. The rise of South–
Edited by: Pingqing Fu
                                                                           South trade and its effect on global CO2 emissions, Nat. Com-
Reviewed by: two anonymous referees
                                                                           mun., 9, https://doi.org/10.1038/s41467-018-04337-y, 2018.
                                                                        Mesquita Moreira, M.: Fear of China: Is There a Future for Manu-
                                                                           facturing in Latin America?, World Development, 35, 355–376,
References                                                                 2007.
                                                                        Miller, R. E. and Blair, P. D.: Input-output analysis: foundations and
Bradley, C. J., Neumark, D., Luo, Z., and Schenk, M.: Employ-              extensions, Cambridge University Press, 2009.
  ment and cancer: findings from a longitudinal study of breast and     Miraglia, S. G. E. K., Saldiva, P. H. N., and Böhm, G. M.: An eval-
  prostate cancer survivors, Cancer Invest., 25, 47–54, 2007.              uation of air pollution health impacts and costs in São Paulo,
Burnett, R. T., Pope III, C. A., Ezzati, M., Olives, C., Lim, S. S.,       Brazil, Environ. Manage., 35, 667–676, 2005.
  Mehta, S., Shin, H. H., Singh, G., Hubbell, B., Brauer, M., An-       National Statistical Yearbook 2013: available at: http://www.stats.
  derson, H. R., Smith, K. R., Balmes, J. R., Bruce, N. G., Kan,           gov.cn/tjsj/ndsj/2013/indexch.htm/, last access: 31 January 2017.
  H., Laden, F., Prüss-Ustün, A., Turner, M. C., Gapstur, S. M.,        Santos, J. R. and Haimes, Y. Y.: Modeling the Demand Reduction
  Diver, W. R., and Cohen A.: An integrated risk function for esti-        Input-Output (I-O) Inoperability Due to Terrorism of Intercon-
  mating the global burden of disease attributable to ambient fine         nected Infrastructures, Risk Anal., 24, 1437–1451, 2004.
  particulate matter exposure, Environ. Health Persp., 122, 397–        Steenge, A. E. and Bočkarjova, M.: Thinking about imbalances in
  403, 2014.                                                               post-catastrophe economies: an input–output based proposition,
Cho, S., Gordon, P., Moore II, J. E., Richardson, H. W., Shinozuka,        Econ. Syst. Res., 19, 205–223, 2007.
  M., and Chang, S.: Integrating transportation network and re-         Sun, J. and Peng, W.: Domestic Interregional trade based on re-
  gional economic models to estimate the costs of a large urban            gional trade relations, Soc. Sci. Res., 6, 20–25, 2011 (in Chi-
  earthquake, J. Regional Sci., 41, 39–65, 2001.                           nese).
Crowther K. G. and Haimes Y. Y.: Application of the inoperability       Venners, S. A., Wang, B., Xu, Z., Schlatter, Y., Wang, L., and
  input–output model (IIM) for systemic risk assessment and man-           Xu, X.: Particulate matter, sulfur dioxide, and daily mortality in
  agement of interdependent infrastructures, Syst. Eng., 8, 323–           Chongqing, China, Environ. Health Persp., 111, 562–567, 2003.
  341, 2005.                                                            Wan, Y., Yang, H., and Masui, T.: Air pollution-induced health im-
Feng, K., Davis, S. J., Sun, L., Li, X., Guan, D., Liu, W., Liu, Z.,       pacts on the national economy of China: demonstration of a com-
  and Hubacek, K.: Outsourcing CO2 within China, P. Natl. Acad.            putable general equilibrium approach, Rev. Environ. Health, 20,
  Sci. USA, 110, 11654–11659, 2013.                                        119–140, 2005.
Geng, G., Zhang, Q., Martin, R. V., van Donkelaar, A., Huo, H.,         Wang, H. and Mullahy, J.: Willingness to pay for reducing fatal
  Che, H., Lin, J., and He, K.: Estimating long-term PM2.5 concen-         risk by improving air quality: a contingent valuation study in
  trations in China using satellite-based aerosol optical depth and a      Chongqing, China, Sci. Total Environ., 367, 50–57, 2006.
  chemical transport model, Remote Sens. Environ., 166, 262–270,        Wang, X. J., Zhang, W., Li, Y., Yang, K. Z., and Bai, M.: Air quality
  2015.                                                                    improvement estimation and assessment using contingent valua-
Guan, D., Su, X., Zhang, Q., Peters, G. P., Liu, Z., Lei,
  Y., and He, K.: The socioeconomic drivers of China’s pri-

Atmos. Chem. Phys., 18, 14433–14443, 2018                                                 www.atmos-chem-phys.net/18/14433/2018/
Y. Xia et al.: Assessment of the pollution–health–economics nexus in China 14443 tion method, a case study in Beijing, Environ. Monit. Assess., Xia, Y., Guan, D., Jiang, X., Peng, L., Schroeder, H., and Zhang, 120, 153–168, 2006. Q.: Assessment of socioeconomic costs to China’s air pollution, Wong, C. M., Atkinson, R. W., Anderson, H. R., Hedley, A. J., Ma, Atmos. Environ., 139, 147–156, 2016. S., Chau, P. Y. K., and Lam, T. H.: A tale of two cities: effects of Xia, Y., Li, Y., Guan, D., Tinoco, D. M., Xia, J., Yan, Z., Yang, J., air pollution on hospital admissions in Hong Kong and London Liu, Q., and Huo, H.: Assessment of the economic impacts of compared, Environ. Health Persp., 110, 67–77, 2002. heat waves: A case study of Nanjing, China, J. Clean. Prod., 171, Wong, T. W., Lau, T. S., Yu, T. S., Neller, A., Wong, S. L., Tam, 811–819, 2018. W., and Pang, S. W.: Air pollution and hospital admissions for Xu, Z., Yu, D., Jing, L., and Xu, X.: Air pollution and daily mor- respiratory and cardiovascular diseases in Hong Kong, Occup. tality in Shenyang, China, Arch. Environ. Health, 55, 115–120, Environ. Med., 56, 679–683, 1999. 2000. Wiedmann, T., Minx, J., Barrett, J., and Wackernagel, M.: Allo- Zeng, X. and Jiang, Y.: Evaluation of value of statistical life in cating ecological footprints to final consumption categories with health costs attributable to air pollution, China Environmental input–output analysis, Ecol. Econ., 56, 28–48, 2006. Science, 30, 284–288, 2010. www.atmos-chem-phys.net/18/14433/2018/ Atmos. Chem. Phys., 18, 14433–14443, 2018
You can also read