Adolescents' Reactions to Adverts for Fast-Food and Confectionery Brands That are High in Fat, Salt, and/or Sugar (HFSS), and Possible ...
←
→
Page content transcription
If your browser does not render page correctly, please read the page content below
International Journal of
           Environmental Research
           and Public Health

Article
Adolescents’ Reactions to Adverts for Fast-Food and
Confectionery Brands That are High in Fat, Salt,
and/or Sugar (HFSS), and Possible Implications for
Future Research and Regulation: Findings from a
Cross-Sectional Survey of 11–19 Year Olds in the
United Kingdom
Nathan Critchlow 1,2, * , Jessica Newberry Le Vay 2 , Anne Marie MacKintosh 1 , Lucie Hooper 2 ,
Christopher Thomas 2 and Jyotsna Vohra 2
 1    Institute for Social Marketing and Health, Faculty of Health Sciences and Sport, University of Stirling,
      Stirling FK9 4LA, UK; a.m.mackintosh@stir.ac.uk
 2    Cancer Policy Research Centre, Cancer Research UK, 2 Redman Place, London E20 1JQ, UK;
      jessica.newberrylevay@cancer.org.uk (J.N.L.V.); lucie.hooper@cancer.org.uk (L.H.);
      chris.thomas@cancer.org.uk (C.T.); jyotsna.vohra@cancer.org.uk (J.V.)
 *    Correspondence: nathan.critchlow@stir.ac.uk; Tel.: +44-(0)1786-467382

 Received: 29 January 2020; Accepted: 1 March 2020; Published: 5 March 2020

 Abstract: The influence that marketing for foods high in fat, salt, and/or sugar (HFSS) has on
 adolescents extends beyond a dose-response relationship between exposure and consumption. It is
 also important to explore how marketing shapes or reinforces product/brand attitudes, and whether
 this varies by demography and Body Mass Index (BMI). To examine this, a cross-sectional survey was
 conducted with 11–19 year olds in the United Kingdom (n = 3348). Participants watched 30 s video
 adverts for a fast-food and confectionery brand. For each advert, participants reported reactions on
 eight measures (e.g., 1 = Makes [product] seem unpopular choice–5 = Makes [product] seem popular
 choice), which were binary coded based on whether a positive reaction was reported (Yes/No). At
 least half of adolescents had positive reactions to both adverts for 5/8 measures. Positive reactions
 had associations with age, gender and, to a lesser extent, BMI. For example, 11–15 year olds were
 more likely than 16–19 year olds to report appeal to their age group for the fast-food (OR = 1.33, 95%
 CI: 1.13–1.58) and confectionery advert (OR = 1.79, 95% CI: 1.51–2.11). If these reactions are typical
 of other HFSS products, future research and regulatory change should examine whether additional
 controls on the content of HFSS marketing, for example mandated health or nutritional information
 and revised definitions of youth appeal, offer additional protection to young people.

 Keywords: Marketing; advertising; HFSS; junk food; reactions; obesity; overweight; adolescents;
 food policy; regulation

1. Introduction
    Adolescents in the United Kingdom (UK) are exposed to a variety of marketing activities for
food and drinks that are high in fat, salt, and/or sugar (hereafter ‘HFSS foods’), ranging from mass
media advertising to subtle marketing activities (e.g., sponsorship and celebrity endorsement) [1,2].
Specifically, in a previous study, nine out of ten 11–19 year olds in the UK recalled seeing at least one
marketing activity for HFSS foods in the past month and around one in six recalled seeing television
adverts, social media adverts, or special price offers every day [1]. Reviews of research consistently

Int. J. Environ. Res. Public Health 2020, 17, 1689; doi:10.3390/ijerph17051689         www.mdpi.com/journal/ijerph
Int. J. Environ. Res. Public Health 2020, 17, 1689                                                    2 of 16

suggest that exposure to marketing for HFSS foods has a consequential impact on dietary-related
attitudes and behavior among children and adolescents, including increased consumption, encouraging
parents to purchase (i.e., ‘pester power’), and poorer nutritional knowledge [1,3–6].
      The influence that marketing for HFSS foods has on children and adolescents extends beyond a
dose-response relationship between exposure and consumption. Instead, both theoretical and applied
consumer research which has sought to rationalize how marketing influences consumption—such as
studies based on the message interpretation process model—suggests that emotional and cognitive
reactions to marketing, and how marketing shapes or reinforces product and/or brand attitudes,
also play an important role in influencing behavior among young people [7–10]. A cross-sectional
survey of 18–24 year olds in Australia, for example, found that the association between energy drink
marketing and consumption was mediated through positive product attitudes (e.g., the belief they
improve physical and mental performance) and subjective norms about consumption (e.g., the belief
they are consumed by peers) [11]. Experimental research with both children and adolescents has also
consistently shown that exposure to advertising for HFSS foods is associated with positive attitudes
towards, and stronger attachments to, the brands depicted [5,12–14]. Moreover, qualitative research
has also demonstrated that children and adolescents in the UK consider the marketing of HFSS
foods to stimulate curiosity, hold important cultural and social capital, and normalize and socialize
consumption [15–20].
      Content analysis research, which focuses on the marketing output as the unit of analysis, highlights
at least three ways in which the marketing of HFSS foods may elicit positive emotional responses or
shape product and/or brand perceptions among children and adolescents. First, studies have shown
that marketing for HFSS foods often uses attractive, fun, and engaging design features, such as visually
stimulating graphics, branded characters, auditory cues, and immersive advergames [4,21–24]. Second,
marketing also reportedly features content which may resonate with, or create a positive emotional
response among, children and adolescents. This includes references to celebrities and popular culture,
featuring brand equity characters (e.g., cartoon brand mascots), linking the brand to attractive and
desirable identities or lifestyles, or featuring humorous content [21–24]. Third, marketing may place a
greater emphasis on the sensory or emotive benefits of a product (e.g., taste or texture), as opposed to
presenting objective information about nutrition and health, or may use ambiguous language that
implies greater nutritional benefit than is actually present (e.g., fruit-flavored) [25–27].
      In the UK, existing statutory controls prohibit advertising for HFSS foods on television during
children’s programs or programs with a disproportionately high child audience [28]. In 2019, the UK
Government also consulted on introducing additional placement restrictions, such as limiting television
and online advertising for HFSS foods to 21:30–05:30 (i.e., a ‘watershed’); the outcome of this consultation
is due to be announced in 2020 [1,29,30]. Where marketing activities for HFSS foods are permitted,
content is self-regulated by a combination of the advertising and marketing industries and the food and
drink producers [31]. Examples of stipulations in their current self-regulatory codes include ensuring
the veracity of nutrition or health claims, not condoning or encouraging excessive consumption or
poor nutritional habits, and not directly appealing to those under 16 years old through the selection
of media or the context in which the marketing appears [32]. Critics, however, argue that the UK’s
self-regulatory framework does not use objective criteria to determine youth appeal [33], which leads
to inconsistent or subjective judgements [34]. It is also argued that the self-regulatory approach lacks
expert knowledge and independent advice on what appeals to children and adolescents, and that the
process of adjudication does not adequately take into account the relative expertise of young people
and their parents about how marketing appeals to them and how it may shape product-, brand-,
and nutrition-related attitudes [31,33].
      Although existing research suggests that adolescents in the UK do have positive attitudes towards
marketing for HFSS foods [15–20], much of this evidence is based on qualitative studies which lack
the ability to generalize to larger samples, or content analyses which are only able to hypothesize
(but not show) appeal. In this study, we therefore examine how adolescents react to two adverts for
Int. J. Environ. Res. Public Health 2020, 17, 1689 3 of 16
HFSS foods using a demographically representative sample of 11–19 year olds in the UK. By doing so,
we emphasize the importance of involving their relative expertise when adjudicating to what extent, if
at all, advertising appeals to them and how marketing may shape or reinforce their attitudes towards
HFSS products/brands. We also examine to what extent, if at all, advert reactions are associated with
demography and the Body Mass Index (BMI), to explore whether some adolescents may be more
susceptible to the influence of the advertising of HFSS foods. We use these data to identify and discuss
three avenues for future research and practice that may help to improve the efficacy of regulation and
offer better protection to children and adolescents.
2. Materials and Methods
2.1. Design and Recruitment
The data were obtained from the 2017 Youth Obesity Policy Survey, an online cross-sectional
survey with 11–19 year olds in the UK (n = 3348), conducted between April and May 2017 [1,35].
The survey was hosted by YouGov, a market research company, who recruited a sample intended to be
representative of the UK population from their online panel. Participants aged under 16 years were
approached through e-mails to existing adult panel members (e.g., their parents), while participants
aged >16 years were approached directly via e-mails. Age (i.e., 11–19 years old) and membership of the
online panel were the only inclusion criteria. Respondents received points on their YouGov account
in return for participation (e.g., 50 points is equivalent to £0.50), which can be deemed for monetary
value once a threshold is reached. A survey weight enabled descriptive data to be representative of the
UK population (based on age, gender, ethnicity, region, and social grade).
2.2. Advertising Creatives for HFSS Foods
Participants were shown two adverts for HFSS food brands: (1) a fast-food brand and (2) a
confectionery (sweets) brand that is an affordable with ‘pocket money’ brand (i.e., a small amount
of money typically given to young people on a regular basis for minor expenses). Due to available
space in the survey, which covered a variety of topics related to diet and health [1,35], we were limited
to two HFSS adverts. We deliberately chose adverts that did not contain price offers, promotions,
or competitions, which may have influenced reactions. These two adverts were chosen to reflect
well-known brands whose products would typically be classified as HFSS by the UK Department for
Health’s Nutrient Profiling Model (NPM) [36] and/or were included in Public Health England’s Sugar
Reduction Programme [37]. Video adverts were chosen as they replicated content suitable for both
television (e.g., advertising/commercial break) and online placement (e.g., posted on social media).
These are two marketing activities through which adolescents in the UK report frequently seeing the
marketing of HFSS foods [1] and are activities reportedly associated with an increased consumption
of HFSS food and BMI among adolescents [1,38–40]. Neither advert had knowingly been subject to
prior complaints, adjudications, or informal resolutions through the UK’s self-regulatory system [41].
Both adverts were from 2016—the year before data collection.
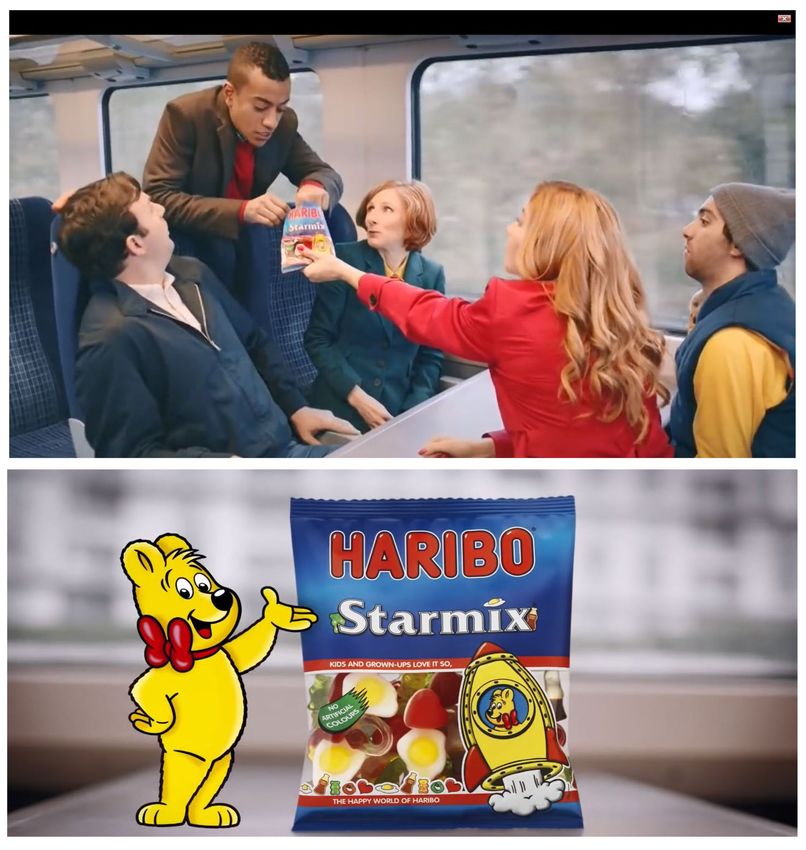
The first advert, from McDonald’s and lasting 30 s, represented a fast-food brand. The advert,
entitled ‘The Summer of Good Times’ [42], depicted people engaged in a variety of activities traditionally
associated with the British summertime, including going to the beach, playing football in a park,
a summer fair (or fête), and a music concert (including footage of a performance by UK female pop
group, ‘Little Mix’). The advert ends with consumers and staff depicted in a McDonald’s restaurant.
The consumers are ordering and eating, while the staff appear to be socializing (Figure 1). Throughout,
the advert features a diverse range of ages, ethnicities, and genders. With the exception of ‘Little Mix’,
all other characters are actors. The final frame includes the slogan “Good times”, the McDonald’s logo,
and social media hashtag “#hellogoodtimes”. An upbeat accompanying song (in an acoustic folk style)
plays throughout, with lyrics congruent to the advert narrative (e.g., “Life is upon us, and the time for
love is here and now”).Int. J. Environ. Res. Public Health 2020, 17, 1689 4 of 16
Figure 1. Stills from McDonald’s ‘Summer of Good Times’ advert (from https://www.youtube.com/watch?
v=EfU-NV1H8FQ).
The second advert, from Haribo and lasting 30 s, represented a confectionery (sweets) brand that
is affordable with ‘pocket money’. The advert is set on a busy commuter train, typical of the UK. The
advert depicts a group of adults sat around a table on the train, with a bag of Haribo Starmix in the
middle (Figure 2) [43]. There is a mixture of ages, genders, and ethnicities, all of whom are adults. All
characters appear to be actors, rather than real-world celebrities. As they share sweets from the packet,
the actors’ voices have been replaced with the voices of children saying what their favorite Haribo
sweets are and why (e.g., “The egg is good, it’s all squidgy and soft”). The advert ends with the iconic
Haribo jingle, “Kids and grown-ups love it so, in the happy world of Haribo”. With the exception of the
jingle, there is no accompanying music, and the advert only features the ambient noise of train travel.
Figure 2. Still images from Haribo’s train advert (from https://www.youtube.com/watch?v=
dSbJWsIScUE).Int. J. Environ. Res. Public Health 2020, 17, 1689 5 of 16
2.3. Measures
2.3.1. Demographics
Details concerning gender, ethnicity, resident UK country (coded: England, Scotland, Wales,
Northern Ireland), and a measure of deprivation (Index of Multiple Deprivation (IMD), a quantitative
measure based on a respondent’s postcode and accounting for a variety of socio-demographic factors)
were obtained from information held about respondents by YouGov or survey questions. We also
obtained information on age (range: 11–19 years old). As the UK’s existing self-regulations define
a child as someone under the age of 16 years old [32], we coded participants as being either 11–15
years or 16–19 years old. Ethnicity was binary coded for analysis purposes. As census data suggests
that ‘White British’ is the dominant ethnicity in the UK ([44], also see Table 1 for weighted data), we
dichotomized participants as ‘White British’ versus ‘Other ethnicities’, which is an approach that is
consistent with previous reporting of this data [1,35].
Int. J. J.
Int. Environ. Res.
Environ. Public
Res. Public Table
Health 2020,
Health Sample
1. 17,
2020, x FOR
17, profile
PEER
x FOR PEER based
REVIEW on unweighted and weighted frequencies.
REVIEW 7 7ofof1616
Unweighted Weighted
Table
Table1.1.Sample
Sampleprofile
profilebased
basedononunweighted
unweightedandandweighted
weightedfrequencies.
frequencies.
Variable % n % n
Unweighted
Unweighted Weighted
Weighted
Age Group
Variable
Variable %% nn %% nn
Age11–15 years old
AgeGroup
Group 60 2010 53 1774
11–15 16–19
11–15 years
years
yearsold old
old 40 6060 1338
2010
2010 47
5353 1574
1774
1774
16–19
16–19years yearsold
Gender old 4040 1338
1338 4747 1574
1574
Gender
Gender
Male 48 1596 51 1707
Male
Male
Female 52 4848 1596
1752 1596 5151
49 1707
1707
1641
Female
Female 5252 1752
1752 4949 1641
1641
Ethnicity
Ethnicity
Ethnicity
White White
White British
British
British 84 8484 2810
2810
2810 76
7676 2555
2555
2555
Other
Other 16 1616 520520 23
2323 775
775
Other 520 775
Not specified or
Not
Notspecified
specifiedororprefer
prefernotnottotoInt. J. Environ. Res. Public Health 2020, 17, 1689 6 of 16
2.3.2. Body Mass Index
Participants were asked to self-report ‘How much do you weigh/How tall are you? Please be as
accurate as possible’, with separate questions for each measure. For height, participants were presented
with a response list that featured feet and inches (e.g., 5ft 4in) and the equivalents in centimeters
(e.g., 163 cm). For weight, participants were presented with a response list that featured stones
and pounds (e.g., 8st 11 lbs) and the equivalents in kilograms (e.g., 55.8 kgs) and pounds only (e.g.,
123 lbs). Participants could also indicate ‘Prefer not to say’ and ‘Don’t Know’. Where possible, the
BMI was calculated using the weight and height data, and participants were categorized using the
extended International Obesity Task Force BMI classifications (including age and gender adjustments
for 11–17 year olds) as either underweight, healthy weight, overweight, or obese [45].
2.3.3. Reactions to the Adverts for HFSS Foods
Immediately after each advert was shown, participants were asked to confirm if they had been
able to watch the content (Yes/No). If successfully watched, participants were asked to what extent each
advert (1) Does not tempt me to try [product]/Tempts me to try the [product]; (2) Makes [product] seem
unappealing/Makes [product] seem appealing; (3) Advert is fun/Advert is boring; (4) Made [product]
seem unhealthy choice/Made [product] seem healthy choice; (5) Made [product] seem unpopular
choice/Made [product] seem popular choice; (6) Made me think that having [product] is boring/Made
me think that having [product] is fun; (7) Would be unappealing to people my age/Would be appealing
to people my age; and (8) I dislike this advert/I like this advert. The reaction measures were based
on preliminary focus group research with 11-19 year olds [16] and prior research exploring how
adolescents react to marketing for other fast-moving consumer goods, such as tobacco [46]. For each
reaction, responses were scored on a five-point Likert Scale (e.g., 1 = Made [product] seem unpopular
choice to 5 = Made [product] seem popular choice). For each, the scale responses were binary coded
into those which had a positive reaction (codes 4 and 5) and those which had a neutral or negative
reaction (codes 1–3).
2.4. Analysis
Data were analysed using SPSS version 24 (SPSS Inc, Chicago, IL, USA). Weighted frequencies
were used to examine sample demographics and the proportion of participants who had a positive
reaction to each advert for each of the eight reaction measures. Binary logistic regressions were
conducted with reactions to each advert as the respective dependent variables (e.g., positive reaction
on appeal to age group for the Haribo advert, coded Yes/No). Participants who had not been able to
watch either advert were excluded on a test-by-test basis. Covariates of age, gender, ethnicity, country,
IMD quintile, and BMI category were included. Reference categories for the binary variables are
reported in the results. For the IMD and BMI category, which had >3 more levels and were ordinal in
nature, the contrast = difference function enabled a comparison of each increasing category relative to
the combined preceding levels. For country, the contrast = simple function compared each of Scotland,
Northern Ireland, and Wales to England.
2.5. Ethics
The study was approved by the University of Stirling’s General University Ethics Panel (GUEP59).
Informed consent was obtained from all participants prior to taking part in the survey. All survey
measures and study materials were designed based on preliminary focus group research [16] and were
pilot tested for cultural and age appropriateness with the target sample.Int. J. Environ. Res. Public Health 2020, 17, 1689 7 of 16
3. Results
3.1. Sample Characteristics
The weighted sample (n = 3348) had an average age of 15.15 years (SD = 2.56), with 53% aged
11–15 years old and 47% aged 16–19 years old (Table 1). There was an approximately even distribution
of males (51%) and females (49%). The majority of respondents were white British (76%) and lived in
England (84%). There was an even proportion from each of the quintiles of deprivation (20%) (Table 1).
After excluding participants with missing data for height or weight status (n = 816, weighted), the
majority of the weighted sample (62%) had a BMI categorized as healthy weight. Seventeen percent of
participants had a BMI classed as underweight, 16% as overweight, and 5% as obese.
3.2. Reactions to the Fast-Food Advert
Three quarters of adolescents (72%, weighted) thought that the fast-food advert made McDonald’s
appear a popular choice (Table 2). Around half thought that the fast-food advert would appeal to
people their age (56%), made McDonald’s seem fun (55%) or appealing (50%), and that the advert was
fun (51%). Approximately a third reported liking the fast-food advert overall (32%) and that it tempted
them to try McDonalds (31%). Around a quarter thought that the advert made McDonald’s seem a
healthy choice (28%).
Table 2. Positive reactions to the fast-food advert.
Overall Sample 11–15 Year Olds
Reaction to Fast-Food Advert % n % n
Made product seem popular choice 72 2335 69 1186
Appealing to age group 56 1795 59 1010
Made product seem fun 55 1772 55 943
Advert was fun 51 1651 50 869
Made product look appealing 50 1620 49 846
Liked the advert 32 1024 34 590
Tempted them to try product 31 1004 35 605
Made product seem a healthy choice 28 900 27 464
Base = All participants; data are weighted; missing data on those who could not watch advert (n = 119, weighted);
variables binary coded from a five-point scale into positive versus neutral and negative reactions.
Binary logistic regression found that younger adolescents (i.e., 11–15 year olds) were more likely
to report that the fast-food advert would appeal to their age group (Adjusted Odds Ratio (AOR) = 1.33,
95% CI: 1.13–1.58), that they liked the advert (AOR = 1.32, 95% CI: 1.11–1.58), and that the advert
tempted them to try McDonalds (AOR = 1.54, 95% CI: 1.28–1.84) (Table 3). Younger adolescents were
less likely to report that the fast-food advert made McDonald’s appear a popular choice (AOR = 0.63,
95% CI: 0.52–0.77). Females were more likely than males to have positive reactions for seven of the
eight measures; the exception was reporting that the advert made McDonald’s appear healthy, which
had no association with gender (p = 0.93). There was a main effect of IMD on temptation to try, with
those from the third (AOR = 0.79, 95% CI: 0.62–0.99) and fourth (AOR = 0.64, 95% CI: 0.52–0.81) IMD
quintiles being less likely to report temptation to try than those from more deprived categories. There
was a main association between BMI and perceived product popularity (p = 0.035), although there were
no significant associations within individual category comparisons. There was no main association of
BMI for all other reactions, although there were two associations to acknowledge within comparisons
of the individual BMI levels. Specifically, those with an obese BMI were more likely than other (lower)
BMI groups to report that the fast-food advert tempted them to try McDonald’s (AOR = 1.53, 95%
CI: 1.05–2.25), while those with an overweight BMI were more likely than those with a healthy or
underweight BMI to report that the advert made McDonald’s seem fun (AOR = 1.32, 95% CI: 1.04–1.67).Int. J. Environ. Res. Public Health 2020, 17, 1689 8 of 16
Table 3. Reactions to the fast-food advert and associations with demography and the BMI group.
Reactions to the Fast-Food (McDonald’s) Advert
Seemed Popular Age Appeal Product Fun Advert Fun Product Appealing Liked Advert Product Healthy Temptation to Try
Variables n AOR p AOR p AOR p AOR p AOR p AOR p AOR P AOR p
Age
16–19 years old 1323 Ref - Ref - Ref - Ref - Ref - Ref - Ref - Ref -
11–15 years old 1063 0.63 0.001 1.33 0.001 0.96 0.65 0.95 0.52 0.88 0.13 1.32 0.002 0.94 0.49 1.54 0.001
Gender
Male 1139 Ref - Ref - Ref - Ref - Ref - Ref - Ref - Ref -
Female 1247 1.45 0.001 1.34 0.001 1.59 0.001 1.82 0.001 1.42 0.001 1.50 0.001 1.01 0.93 1.24 0.02
Ethnicity
Other 397 Ref - Ref - Ref - Ref - Ref - Ref - Ref - Ref -
White British 1989 1.19 0.17 1.16 0.19 1.01 0.97 0.96 0.73 0.97 0.79 0.91 0.45 0.95 0.70 1.09 0.48
Country 0.87 0.42 0.75 0.44 0.55 0.80 0.10 0.41
England 1808 Ref - Ref - Ref - Ref - Ref - Ref - Ref - Ref -
Wales (vs. England) 184 1.09 0.63 1.29 0.12 1.19 0.28 1.08 0.63 1.02 0.90 1.01 0.96 0.92 0.62 1.10 0.58
Scotland (vs. England) 275 0.92 0.56 0.95 0.69 0.99 0.95 1.13 0.36 1.13 0.35 1.03 0.81 1.36 0.03 1.20 0.19
N. Ireland (vs. England) 119 1.04 0.86 1.08 0.68 1.02 0.93 1.32 0.16 1.26 0.24 1.22 0.33 1.25 0.28 1.26 0.25
IMD 0.30 0.31 0.33 0.41 0.75 0.36 0.08 0.001
1 397 Ref - Ref - Ref - Ref - Ref - Ref - Ref - Ref -
2 (vs. 1) 490 0.91 0.54 1.02 0.89 0.99 0.92 1.04 0.78 0.91 0.49 0.97 0.85 1.13 0.39 0.86 0.27
3 (vs. 1, 2) 514 1.31 0.04 1.12 0.34 0.97 0.80 1.05 0.96 0.96 0.68 1.11 0.39 0.84 0.15 0.79 0.04
4 (vs. 1, 2, 3) 570 1.00 0.98 0.82 0.06 0.81 0.04 0.89 0.27 0.89 0.25 0.82 0.06 0.89 0.32 0.64 0.001
5 (vs. 1, 2, 3, 4) 415 0.96 0.74 1.03 0.80 1.05 0.68 1.19 0.12 1.02 0.86 1.00 0.98 0.77 0.03 0.94 0.62
Weight Status 0.04 0.27 0.06 0.51 0.15 0.13 0.23 0.13
Underweight 397 Ref - Ref - Ref - Ref - Ref - Ref - Ref - Ref -
Healthy weight (vs. u/w4 ) 1490 1.25 0.07 1.14 0.24 1.12 0.34 1.07 0.56 1.17 0.16 1.08 0.52 1.27 0.07 1.01 0.95
Overweight (vs. u/w & h’lthy) 375 1.26 0.09 1.23 0.09 1.32 0.02 1.11 0.37 1.23 0.08 1.17 0.21 0.99 0.95 1.09 0.53
Obese (vs. all other) 124 1.61 0.05 1.15 0.46 1.30 0.18 1.25 0.24 1.25 0.24 1.47 0.05 1.24 0.29 1.53 0.03
Notes: Dependent variable for all models: did the participant have a positive reaction (codes 4/5) or a neutral and negative reaction (codes 1–3); Hosmer and Lemeshow for all models
p > 0.05; AOR = Adjusted Odds Ratio; cases with missing data on one or more variables in all models (n = 962, i.e., could not watch video or report BMI).Int. J. Environ. Res. Public Health 2020, 17, 1689 9 of 16
3.3. Reactions to the Confectionery Advert
Approximately three quarters of adolescents (71%, weighted) thought that the confectionery advert
made Haribo appear a popular choice (Table 4). Around two thirds of adolescents also thought that the
advert made the Haribo product seem fun (64%) and that the advert was fun (68%). Approximately
half of adolescents also said they thought that the advert made Haribo look appealing (56%), that they
liked the confectionery advert overall (56%), and that they thought it would appeal to people their age
(48%). Two-fifths (41%) said that the advert tempted them to try Haribo. One in ten adolescents (10%)
thought that the advert made Haribo appear a healthy choice.
Table 4. Positive reactions to the confectionery advert.
Overall Sample 11–15 Year Olds
Reaction to Fast-Food Advert % n % n
Made product seem popular choice 71 2328 69 1210
Advert was fun 68 2229 69 1200
Made product seem fun 64 2089 64 1119
Made product look appealing 56 1835 58 1011
Liked the advert 56 1826 59 1036
Appealing to age group 48 1572 55 963
Tempted them to try product 41 1329 46 810
Made product seem a healthy choice 10 330 13 226
Base = All participants; data are weighted; missing data on those who could not watch advert (n = 74, weighted);
variables binary coded from a five-point scale into positive versus neutral and negative reactions.
Binary logistic regressions found that younger adolescents (i.e., 11–15 year olds) were more likely
to report that the confectionery advert would appeal to their age group (AOR = 1.79, 95% CI: 1.51–2.11),
that they liked the advert (AOR = 1.19, 95% CI: 1.01–1.41), that it made Haribo appear a healthy
choice (AOR = 2.20, 95% CI: 1.64–1.96), and that the advert tempted them to try Haribo (AOR = 1.57,
95% CI: 1.32–1.86) (Table 5). Younger adolescents were less likely to report that the confectionery
advert made the product appear popular (AOR = 0.74, 95% CI: 0.61–0.89). Concerning gender, females
were more likely than males to have positive reactions to the advert for seven of the eight measures;
the exception was reporting that the advert made Haribo appear a healthy option, which had no
association with gender (p = 0.52). Concerning BMI, there was only a main association for product
appeal (p = 0.028); adolescents who had an overweight BMI were more likely than those with a healthy
or underweight BMI to report that the advert made Haribo appear appealing (AOR = 1.38, 95% CI:
1.09–1.74). There was no main association of BMI for all other reactions, although there were two
associations to acknowledge within comparisons of the individual BMI levels. Specifically, adolescents
with an obese BMI were more likely than other BMI groups to report that the confectionery advert
would appeal to their age group (AOR = 1.54, 95% CI: 1.06–2.34) and that it made Haribo appear a
popular choice (AOR = 1.73, 95% CI: 1.08–2.76).Int. J. Environ. Res. Public Health 2020, 17, 1689 10 of 16
Table 5. Reactions to the confectionery (Haribo) advert and associations with demography and the BMI group.
Reactions to the Confectionery (Haribo) Advert
Seemed Popular Age Appeal Product Fun Advert Fun Product Appealing Liked Advert Product Healthy Temptation to Try
Variables n AOR p AOR p AOR p AOR p AOR p AOR p AOR P AOR p
Age
16–19 years old 1341 Ref - Ref - Ref - Ref - Ref - Ref - Ref - Ref -
11–15 years old 1075 0.74 0.001 1.79 0.001 0.98 0.77 0.92 0.38 1.09 0.32 1.19 0.04 2.20 0.001 1.57 0.001
Gender
Male 1146 Ref - Ref - Ref - Ref - Ref - Ref - Ref - Ref -
Female 1270 1.36 0.001 1.18 0.04 1.33 0.001 1.21 0.03 1.39 0.001 1.40 0.001 0.92 0.52 1.27 0.004
Ethnicity
Other 404 Ref - Ref - Ref - Ref - Ref - Ref - Ref - Ref -
White British 2012 1.07 0.57 1.12 0.32 1.00 0.99 1.06 0.64 1.13 0.27 1.32 0.01 0.71 0.05 0.97 0.81
Country 0.13 0.17 0.43 0.06 0.16 0.01 0.06 0.16
England 1829 Ref - Ref - Ref - Ref - Ref - Ref - Ref - Ref -
Wales (vs. England) 186 1.23 0.26 1.17 0.31 1.05 0.77 1.12 0.51 1.19 0.27 0.91 0.56 1.21 0.45 1.30 0.10
Scotland (vs. England) 281 0.79 0.09 0.78 0.06 0.82 0.12 0.72 0.01 0.79 0.07 0.65 0.001 0.87 0.55 0.95 0.71
N. Ireland (vs. England) 120 1.24 0.34 0.95 0.80 1.06 0.76 0.92 0.70 1.03 0.87 1.00 0.98 1.88 0.01 1.35 0.12
IMD 0.55 0.44 0.08 0.40 0.72 0.41 0.17 0.19
1 405 Ref - Ref - Ref - Ref - Ref - Ref - Ref - Ref -
2 (vs. 1) 495 0.83 0.20 0.86 0.26 0.80 0.10 0.93 0.59 0.86 0.27 0.80 0.11 0.96 0.84 0.97 0.80
3 (vs. 1, 2) 522 1.12 0.37 1.04 0.73 1.30 0.02 1.24 0.08 0.99 0.91 1.11 0.37 0.74 0.10 0.93 0.51
4 (vs. 1, 2, 3) 571 1.02 0.90 0.86 0.12 1.01 0.95 0.94 0.57 0.95 0.58 0.95 0.59 0.71 0.06 1.04 0.70
5 (vs. 1, 2, 3, 4) 423 1.07 0.58 0.99 0.92 0.97 0.79 1.05 0.70 0.91 0.40 1.04 0.72 0.99 0.95 0.77 0.02
Weight Status 0.10 0.05 0.15 0.29 0.03 0.14 0.56 0.96
Underweight 396 Ref - Ref - Ref - Ref - Ref - Ref - Ref - Ref -
Healthy (vs. u/w4 ) 1510 1.15 0.25 0.96 0.74 1.01 0.93 1.04 0.76 1.17 0.18 0.89 0.32 1.06 0.78 1.01 0.93
Overweight (vs. u/w & h’lthy) 383 1.08 0.55 1.14 0.28 1.20 0.14 1.03 0.80 1.38 0.01 1.12 0.35 1.19 0.35 0.96 0.75
Obese (vs. all other) 127 1.73 0.02 1.54 0.02 1.40 0.12 1.51 0.06 1.27 0.22 1.32 0.15 1.36 0.30 1.09 0.64
Notes: Dependent variable for all models: did the participant have a positive reaction (codes 4/5) or a neutral and negative reaction (codes 1–3); Hosmer and Lemeshow for all models
p > 0.05, except product fun, where χ2 (8) = 18.75, p = 0.016; AOR = Adjusted Odds Ratio; cases with missing data on one or more variables in all models (n = 932, i.e., could not watch video
or report BMI).Int. J. Environ. Res. Public Health 2020, 17, 1689 11 of 16
4. Discussion
The principal finding is that adolescents in the UK reacted positively to the two HFSS food adverts,
with the majority having positive reactions on five of the eight measures for each advert. This included
positive perceptions concerning the brand (e.g., perceived popularity and appeal), advert design (e.g.,
fun and appeal to age group), and impact on behavior (e.g., temptation to try). A secondary finding is
that positive reactions had key associations with demography and, to a lesser extent, BMI category.
This included that younger adolescents were more likely to report that both adverts would appeal to
their age group and that they were tempted to try the brands promoted.
The findings are consistent with consumer research that has demonstrated the importance of
examining how marketing shapes and reinforces attitudes towards HFSS products/brands [7–21],
in addition to research examining the associations between the volume and frequency of marketing
exposure and dietary outcomes [1]. The findings are also consistent with suggestions that some
young people may be more susceptible to the persuasive intent of HFSS marketing. For example,
younger adolescents were more likely to report positive reactions to the two adverts for several
measures, including perceived appeal to their age group, temptation to try, and perceived healthiness
of the confectionery product. This trend may be explained, at least partly, by suggestions that the
ability of younger age groups to recognize the commercial and persuasive intent of marketing is
less developed and, therefore, they may be more susceptible [47,48]. Gender was also an important
factor, with females more likely than males to react positively for all measures for both adverts, except
perceived healthiness. Compared to other fast-moving consumer goods, such as tobacco [49,50] and
alcohol [51], there is comparatively less research on the role of gender in the design and impact of HFSS
marketing [52]. This represents an important avenue for future research, particularly using in-depth
qualitative methodologies that continue to be under-represented in the HFSS marketing literature [5].
For the most part, there was no main association between the BMI category and positive advert
reactions. Comparisons of individual categories, however, did suggest some tentative associations.
For example, those with an obese BMI were more likely to report temptation to try the fast-food
product and perceived age appeal for the confectionery brand. This study, however, was only based
on self-reported BMI, which may not always provide accurate estimations among young people [53].
Further research based on anthropometric measures (e.g., in-person experiments) could better explore
to what extent (if at all) the BMI category is associated with positive reactions and susceptibility.
4.1. Potential Avenues for Future Research and Potential Implications for Regulation
If the results of this study are typical of reactions to wider marketing activities for HFSS food
products/brands in the UK, then our findings highlight three avenues for future research and regulation
change that may offer better protection to children and adolescents. First, a quarter of adolescents
thought that the fast-food advert made the brand appear healthy and one in ten thought this for the
confectionery advert; 11–15 year olds were two times more likely than older adolescents to think
that the confectionery advert made the product appear healthy. Although neither advert explicitly
claimed that their products were healthy or nutritious, neither contained any information to the
contrary either; a trend consistent with previous content analysis research on the marketing of HFSS
foods [21]. In the fast-food advert, it could also be argued that healthiness was passively/indirectly
implied through the activities depicted (e.g., playing football and running on a beach) and the products
clearly shown (e.g., bottles of water or fruit juice—the only time an HFSS product is clearly visible is
on a waterproof top, see top right image in Figure 1). In France, all television adverts for HFSS foods
must display one of four health messages and, from January 2021, it will also become mandatory to
include a ‘nutri-score’ graphic that provides an easy-to-read indication of the nutritional content [31,54].
Evaluating what impact, if any, nutri-scores and mandatory health messages in advertising have
on consumer perceptions of HFSS product healthiness, or whether knowing the nutritional content
would have had a moderating effect on other advert reactions in this study (e.g., temptation to tryInt. J. Environ. Res. Public Health 2020, 17, 1689 12 of 16
and perceived popularity), represents an important avenue for research that could inform regulatory
change in the UK.
Second, for both adverts, younger adolescents (i.e., 11–15 year olds) were more likely to report
several positive reactions than older adolescents (i.e., 16–19 year olds), including appeal to their age
group and temptation to try the products/brands depicted. In the UK, there is incongruence in how
appeal to young people is defined across different parts of the same self-regulatory codes. For HFSS
foods, marketing must not be directed at those aged under 16 years (i.e., children) through either
the selection of media or the context in which it appears [32]. There are also restrictions on using
licensed characters (e.g., celebrities) if targeting consumers under 11 years old. Elsewhere in the same
self-regulations, however, appeal to young people is defined differently. For instance, marketing
for age-restricted products such as alcohol, gambling, and electronic cigarettes must not particularly
appeal to those under 18 years old (e.g., by creating associations with youth culture) and must not
prominently feature real or fictitious people who are (or appear to be) under 25 years old [55–57].
These stipulations are in addition to placement restrictions similar to HFSS foods. The two adverts in
this study did plausibly contain content that would not have been permitted under these alternate
definitions, including associations with youth culture (e.g., the pop-group ‘Little Mix’), content that
may appeal to young people (e.g., humorous child-like voiceovers), and featuring young people
under 25 years old. Future research should therefore explore to what extent, if at all, applying these
alternate regulatory criteria to the marketing of HFSS foods could reduce appeal to children and
younger adolescents. Research could also further consider how both approaches compare to other
more restrictive statutory controls on marketing design and content. For example, alcohol advertising
in France is only permitted to include factual information about the products depicted; no lifestyle and
evocative messages are allowed, such as those which feature in the creatives used in this study [31,58].
Third, the findings show the potential benefit of involving the relative expertise of young people
in interpreting and highlighting the appeal of advertising among this age group—something seemingly
lacking in the current self-regulatory framework. Previous research has shown that the adjudications
of self-regulatory bodies—including whether marketing may appeal to young people—are not always
consistent with the views of harm-reduction and advocacy organisations [34,59], researchers [60],
the general population [61], or young people [62]. To date, however, much of this research has focused
on other age-restricted fast-moving consumer goods, in particular alcohol. Future studies should
therefore use these existing methodologies to examine to what extent, if at all, existing self-regulatory
decisions for HFSS marketing are congruent to the perspectives of young people. Where incongruence
is evident, research exploring the perspectives of multiple stakeholders involved in the production,
research, regulation, and consumption of marketing—including children, adolescents, and their
parents—would be of value to identify effective ways of reducing appeal and to form a consensus on
effective and appropriate regulatory change.
4.2. Limitations
The Youth Obesity Policy Survey covered a variety of topics [1,35,38–40] and, due to space
restraints, we only included two adverts for HFSS foods as stimuli. These adverts were intended to be
illustrative, but not representative, of all HFSS products; reactions may vary for other brands or other
marketing creatives from the two brands featured (e.g., different marketing campaigns). Replication
across different HFSS products and brands is imperative. We also did not include a comparator advert,
to ascertain to what extent (if at all) reactions to HFSS food marketing differs to advertising for non-food
products (e.g., toys or electronic devices). The creatives also only represent video adverts suitable
for television or online placement, and are not representative of all marketing activities (e.g., print,
packaging, or sponsorship). The eight reaction measures, albeit informed by focus groups [16] and
existing research [46], are not exhaustive of all possible reactions. It is plausible that young people
may have formed other opinions to the adverts (both positive and negative) that were not captured in
the measures, and a more detailed understanding concerning appeal and interpretation could haveInt. J. Environ. Res. Public Health 2020, 17, 1689 13 of 16
been generated by showing creatives in qualitative research [15–20]. We also cannot determine to
what extent, if at all, reactions were influenced by existing heuristics and attitudes towards the brands
depicted (e.g., due to prior exposure to other forms of marketing). Artificial exposure in a survey and
self-reporting reactions is not representative of real-world exposure to advertising, where processing
may be automatic or there may be other competing attentional burdens. Finally, the findings only
show reactions to the adverts and self-reported temptation to try. The data cannot show whether the
adolescents would have acted on the promotional messages or any subsequent effect on weight.
5. Conclusions
Adolescents in the UK reported a variety of positive reactions to the two HFSS adverts shown in
this study, including perceived brand popularity, age appeal, perceived healthiness, and temptation to
try. There were key associations with demography and, to a lesser extent, BMI category, which suggests
that some adolescents are more susceptible to the influence of advertising for HFSS foods. For example,
younger adolescents were more likely to report perceived appeal to their age group and temptation
to try, while female adolescents were more likely to have positive reactions for seven of the eight
measures. If these reactions are typical of marketing for other HFSS food products and brands, the
findings link to three possible avenues for research that could help improve the efficacy of regulation
in the UK and offer better protection to children and young people. These include testing the impact
of clearly displaying nutritional information and health messaging in adverts and testing alternative
methods of regulating appeal to young people based on existing approaches for other fast-moving
consumer goods (e.g., age-restricted products). Additionally, they include testing to what extent, if at
all, existing self-regulatory decisions are congruent to the views of young people, and involving the
perspectives of multiple stakeholders (including children and their parents) in identifying effective
and appropriate revisions to regulation.
Author Contributions: Conceptualisation, N.C., J.N.L.V., L.H., C.T., and J.V.; methodology, L.H., A.M.M., C.T.,
and J.V.; formal analysis, N.C.; investigation; N.C.; resources, L.H., C.T., and J.V.; data curation, L.H., C.T., and J.V.;
writing—original draft preparation, N.C.; writing—review and editing, N.C., J.N.L.V., and A.M.M.; supervision,
N.C. and J.V.; project administration, N.C.; funding acquisition, N.C. All authors have read and agreed to the
published version of the manuscript.
Funding: This work was supported by a grant from Cancer Research UK (C61042/A28892). The Article Processing
Charge was funded by the University of Stirling.
Acknowledgments: The authors thank YouGov for their assistance in preparing and managing delivery of
the survey and raw data, Ellen Saw (Cancer Policy Research Centre, Cancer Research UK) for managing the
administration and commission of the project, and NatCen Social Research for their contribution to the original
scoping studies.
Conflicts of Interest: L.H., C.T., J.N.L.V., and J.V. were employed by the Cancer Policy Research Centre at Cancer
Research UK—the funder—at the time of conducting the study. N.C. was on secondment as a research consultant
for the Cancer Policy Research Centre at Cancer Research UK at the point of conducting the study. The views
expressed are those of the researchers and not necessarily those of their respective funder/employer(s).
References
1. Critchlow, N.; Bauld, L.; Thomas, C.; Hooper, L.; Vohra, J. Awareness of marketing for high fat, salt, or sugar
(HFSS) foods, and the association with higher weekly consumption among adolescents: A rejoinder to the
UK Government’s consultations on marketing regulations. Public Health Nutr. 2020, in press.
2. Cairns, G. The Impact of Food and Drink Marketing on Scotland’s Children and Young People: A Report on the
Results of Questions about Exposure and Purchase Responses Included IPSOS-Mori’s 2014 Young People in Scotland
Survey; University of Stirling: Stirling, UK, 2015.
3. Boyland, E.; Nolan, S.; Kelly, B.; Tudur-Smith, C.; Jones, A.; Halford, J.C.; Robinson, E. Advertising as a cue
to consume: A systematic review and meta-analysis of the effects of acute exposure to unhealthy food and
non-alcoholic beverage advertising on intake in children and adults. Am. J. Clin. Nutr. 2016, 103, 519–533.
[CrossRef] [PubMed]Int. J. Environ. Res. Public Health 2020, 17, 1689 14 of 16
4. Cairns, G.; Angus, K.; Hastings, G.; Caraher, M. Systematic reviews of the evidence on the nature, extent
and effects of food marketing to children: A retrospective summary. Appetite 2013, 62, 209–215. [CrossRef]
[PubMed]
5. Smith, R.; Kelly, B.; Yeatman, H.; Boyland, E. Food marketing influences children’s attitudes, preferences,
and consumption: A systematic critical review. Nutrients 2019, 11, e875. [CrossRef]
6. Hastings, G.; McDermott, L.; Angus, K.; Stead, M.; Thomson, S. The Extent, Nature, and Effects of Food Promotion
to Children: A Review of the Evidence; WHO: Geneva, Switzerland, 2006.
7. Jackson, K.M.; Janssen, T.; Gabrielli, J. Media/marketing influences on adolescent and young adult substance
abuse. Curr. Addict. Rep. 2018, 5, 146–157. [CrossRef]
8. Austin, E.W.; Chen, M.-J.; Grube, J.W. How does alcohol advertising influence underage drinking? The role
of desirability, identification, and scepticism. J. Adolesc. Health 2006, 38, 376–384. [CrossRef]
9. McClure, A.C.; Stoolmiller, M.; Tanski, S.E.; Engels, R.C.; Sargent, J.D. Alcohol marketing receptivity,
marketing-specific cognitions, and underage binge drinking. Alcohol Clin. Exp. Res. 2013, 37, 404–413.
[CrossRef]
10. Harris, J.L.; Brownell, K.D.; Bargh, J.A. The food marketing defense model: Integrating psychological
research to protect youth and inform public policy. Soc. Issues Policy Rev. 2010, 3, 211–271. [CrossRef]
11. Buchanan, L.; Yeatman, H.; Kelly, B.; Kariippanon, K. Digital promotion of energy drink to young adults is
more strongly linked to consumption than other media. J. Nutr. Educ. Behav. 2018, 50, 888–895. [CrossRef]
12. Buchanan, L.; Kelly, B.; Yeatman, H. Exposure to digital marketing enhances young adults’ interests in energy
drinks: An exploratory investigation. PLoS ONE 2017, 12, e171226. [CrossRef]
13. Kelly, B.; Boyland, E.; King, L. Children’s exposure to television food advertising contributes to strong brand
attachment. Int. J. Environ. Res. Public Health 2019, 16, e2358. [CrossRef] [PubMed]
14. Norman, J.; Kelly, B.; McMahon, A.T.; Boyland, E.; Chapman, K.; King, L. Remember me? Exposure to
unfamiliar food brands in television advertising and online advergames drives children’s brand recognition,
attitudes, and desire to eat foods: A secondary analysis from a crossover experimental-control study with
randomisation at the group level. J. Acad. Nutr. Diet. 2020, 120, 120–129. [CrossRef] [PubMed]
15. Anzar, C.; MacGregor, A.; Rosenberg, G.; Porter, L.; Lepps, H. Ad Brake: Primary School Children’s Perceptions
of Unhealthy Food Advertising on TV; Cancer Research UK: London, UK, 2016.
16. MacGregor, A.; Bicquelet, A.; Lepps, H.; Porter, L.; Eadie, D.; McKell, J.; MacKintosh, A.M.; Thomas, C.;
Hooper, L.; Vohra, J. It’s Just There to Trick You: A Qualitative Study of 11–19 Year Olds’ Perceptions of Food and
Drink Marketing; Cancer Research UK: London, UK, 2016.
17. MacGregor, A.; Attygalle, K.; Shields, J.; Newberry Le Vay, J.; Whiteside, E.; Clark, M.; Vohra, J. Still under
Pressure; But Pressing for Change: Young People’s Perceptions of What Influences Their Food Choices and What
Changes They Want to See; Cancer Research UK: London, UK, 2019.
18. Thiachon, P.; Quach, T.N. Online marketing communications and childhood’s intention to consume unhealthy
foods. Aust. Mark. J. 2016, 24, 78–86. [CrossRef]
19. Lawlor, M.A.; Dunne, A.; Rowley, J. Young consumers’ brand communications literacy in a social networking
site context. Eur. J. Mark. 2016, 50, 1993–2017. [CrossRef]
20. Coates, A.E.; Hardman, C.A.; Halford, J.C.G.; Christiansen, P.; Boyland, E.J. “It’s Just Addictive People That
Make Addictive Videos”: Children’s Understanding of and Attitudes Towards Influencer Marketing of
Food and Beverages by YouTube Video Bloggers. Int. J. Environ. Res. Public Health 2020, 17, 449. [CrossRef]
[PubMed]
21. Critchlow, N.; Angus, K.; Stead, M.; Newberry Le Vay, J.; Whiteside, E.; Clark, M.; Hudson, B.; Vohra, J.
Digital Feast: Navigating a Digital Marketing Mix, and the Impact on Children and Young People’s Dietary Attitudes
and Behaviour; Cancer Research UK: London, UK, 2019.
22. British Heart Foundation. The 21st Century Gingerbread House: House Companies are Marketing Food to Children
Online; British Heart Foundation: London, UK, 2011.
23. Harris, J.L.; Schwartz, M.B.; Brownell, K.D.; Sarda, V.; Ustjanauskas, A.; Javadizadeh, J.; Weinberg, M.;
Munsell, C.; Speers, S.; Bukofzer, E.; et al. Fast food F.A.C.T.S: Food Advertising to Children and Teens Score,
Evaluating Fast Food Nutrition and Marketing to Youth; Yale Rudd Centre for Food Policy and Obesity: New
Haven, CT, USA, 2010.
24. Truman, E.; Elliot, C. Identifying food marketing to teenagers: A scoping review. Int. J. Behav. Nutr. Phys.
Act. 2019, 16, 67. [CrossRef]Int. J. Environ. Res. Public Health 2020, 17, 1689 15 of 16
25. Kelly, B.; Bochynska, K.; Kornman, K.; Chapman, K. Internet food marketing on popular children’s websites
and food product websites in Australia. Public Health Nutr. 2008, 11, 1180–1187. [CrossRef]
26. Brady, J.; Mendelson, R.; Farrell, A.; Wong, S. Online marketing of food and beverage to children: A content
analysis. Can. J. Diet Pract. Res. 2010, 71, 166–171. [CrossRef]
27. Coon, K.A.; Tucker, K.L. Television and children’s consumption patterns: A review of the literature. Minerva
Pediatr. 2002, 54, 423–436.
28. OFCOM. HFSS Advertising Restrictions: Final Review; Office of Communication: London, UK, 2010.
29. HM Government. Childhood Obesity: A Plan for Action; HM Government: London, UK, 2016.
30. Department of Health & Social Care. Introducing Further Advertising Restrictions on TV and Online for Products
High, Fat, Sugar and Salt; Department of Health and Social Care: London, UK, 2019.
31. Critchlow, N.; Angus, K.; Stead, M.; Saw, E.; Newberry Le Vay, J.; Clark, M.; Whiteside, E.; Froguel, A.;
Vohra, J. Lessons from the Digital Frontline: Evidence to Support the Implementation of Better Regulation of Digital
Marketing for Food and Drinks High Fat, Salt, and Sugar; Cancer Research UK: London, UK, 2019.
32. Advertising Standards Authority. The UK Code of Non-Broadcast Advertising and Direct & Promotional Marketing:
Section 15, Food, Food Supplements, and Associated Health or Nutrition Claims; Advertising Standards Authority:
London, UK, 2019.
33. British Heart Foundation and Children’s Food Campaign. Protecting Children from Unhealthy food Marketing:
A British Heart Foundation and Children’s Food Campaign Proposal for a Statutory System to Regulate Non-Broadcast
Food Marketing to Children; British Heart Foundation: London, UK, 2008.
34. Clark, M.; Powell, C. Through the Looking Glass: A Review of the Topsy Turvy World of the Regulations that are
Supposed to (but don’t) Protect Children from Online Marketing of Junk Food; Children’s Food Campaign and
Sustain: London, UK, 2013.
35. Thomas, F.; Thomas, C.; Hooper, L.; Rosenberg, G.; Vohra, J.; Bauld, L. Area deprivation, screen time
and consumption of food and drink high in fat, salt, and sugar (HFSS) in young people: Results from a
cross-sectional study in the UK. BMJ Open 2019, 9, 027333. [CrossRef]
36. Department for Health. Nutrient Profiling Technical Guidance; Department for Health: London, UK, 2011.
37. Public Health England. Sugar Reduction Programme: Progress Made by Industry in the First Year; Public Health
England: London, UK, 2018.
38. Thomas, C.; Hooper, L.; Petty, R.; Thomas, F.; Rosenberg, G.; Vohra, J. 10 Years on: New Evidence on TV
Marketing and Junk Food Eating Among 11–19 Year Olds 10 Years After Broadcast regulations; Cancer Research
UK: London, UK, 2019.
39. Thomas, C.; Hooper, L.; Rosenberg, G.; Thomas, F.; Vohra, J. Under Pressure: New Evidence on Young People’s
Broadcast Marketing Exposure in the UK; Cancer Research UK: London, UK, 2019.
40. Thomas, F.; Hooper, L.; Petty, R.; Thomas, C.; Rosenberg, G.; Vohra, J. A Prime Time for Action: New Evidence
on the Link between Television and On-Demand Marketing and Obesity; Cancer Research UK: London, UK, 2018.
41. Advertising Standards Authority. Rulings. Available online: https://www.asa.org.uk/codes-and-rulings/
rulings.html (accessed on 7 January 2020).
42. McDonald’s UK. Summer of Good Times with Little Mix | Brand | McDonald’s | TV ad [YouTube video].
Available online: https://www.youtube.com/watch?v=EfU-NV1H8FQ (accessed on 7 January 2020).
43. Home Cinema Adverts. Haribo Starmix — Train [YouTube video]. Available online: https://www.youtube.
com/watch?v=dSbJWsIScUE (accessed on 7 January 2020).
44. UK Government. Regional Ethnic Diversity, Published 1st August 2018. Available online:
https://www.ethnicity-facts-figures.service.gov.uk/uk-population-by-ethnicity/national-and-regional-
populations/regional-ethnic-diversity/latest (accessed on 28 February 2020).
45. Cole, T.J.; Lobstein, T. Extended international (IOTF) body mass index cut-offs for thinness, overweight and
obesity. Pediatr. Obes. 2012, 7, 284–294. [CrossRef]
46. Ford, A.; MacKintosh, A.M.; Moodie, C.; Richardson, S.; Hastings, G. Cigarette pack design and adolescent
smoking susceptibility: A cross-sectional survey. BMJ Open 2013, 3, e003282. [CrossRef] [PubMed]
47. Carter, O.B.; Petterson, L.J.; Donovan, R.J.; Ewing, M.T.; Roberts, C.M. Children’s understanding of the
selling versus persuasive intent of junk food advertising: Implications for regulations. Soc. Sci. Med. 2011,
72, 962–968. [CrossRef]
48. Rozendaal, E.; Buijzen, M.; Valkenburg, P. Comparing children’s and adults cognitive advertising
competencies in the Netherlands. J. Child. Media 2010, 4, 77–89. [CrossRef]Int. J. Environ. Res. Public Health 2020, 17, 1689 16 of 16
49. Amos, A.; Greaves, L.; Nichter, M.; Bloch, M. Women and tobacco: A call for including gender in tobacco
control research, policy, and practice. Tob. Control 2011, 21, 236–243. [CrossRef]
50. Kaufman, N.J.; Nichter, M. The Marketing of Tobacco to Women: Global perspectives. In Gender, Women and
the Tobacco Epidemic; Samet, J.M., Yoon, S.-Y., Eds.; WHO: Geneva, Switzerland, 2010.
51. Atkinson, A.M.; Sumnall, H.; Begley, E.; Jones, L. A Rapid Narrative Review of Literature on Gendered Alcohol
Marketing and Its Effects: Exploring the Targeting and Representation of Women; Institute for Alcohol Studies:
London, UK, 2019.
52. Adams, J.; White, M. Socio-economic and gender difference in nutritional content of foods advertising in
popular UK weekly magazines. Eur. J. Public Health 2009, 19, 144–149. [CrossRef]
53. Robinson, E.; Oldham, M. Weight status misperceptions among UK adults: The use of self-reported vs.
measured BMI. BMC Obes. 2016, 3, 21. [CrossRef]
54. Lewis, S. France to Make Nutri-Scire Mandatory on All Food Ads, but Waiver Possible.
Available online: https://iegpolicy.agribusinessintelligence.informa.com/PL219372/France-to-make-
Nutriscore-mandatory-on-all-food-ads-but-waiver-possible (accessed on 7 January 2020).
55. Advertising Standards Authority. The UK Code of Non-Broadcast Advertising and Direct & Promotional Marketing:
Section 16, Gambling; Advertising Standards Authority: London, UK, 2019.
56. Advertising Standards Authority. The UK Code of Non-Broadcast Advertising and Direct & Promotional Marketing:
Section 18, Alcohol; Advertising Standards Authority: London, UK, 2019.
57. Advertising Standards Authority. The UK Code of Non-Broadcast Advertising and Direct & Promotional Marketing:
Section 22, Electronic Cigarettes; Advertising Standards Authority: London, UK, 2019.
58. Gallopel-Morvan, K.; Spilka, S.; Mutatayi, C.; Riguard, A.; Lecas, F.; Beck, F. France Evin law on the control
of alcohol advertising: Content, effectiveness, and limitations. Addiction 2017, 112, 86–93. [CrossRef]
59. Alcohol Concern and Alcohol Research UK. Fit. for Purpose? An Analysis of the Role of the Portman Group in
Alcohol Industry Self-Regulation; Alcohol Concern and Alcohol Research UK: London, UK, 2018.
60. Noel, J.; Babor, T.F.; Robaina, K. Industry self-regulation of alcohol marketing: A systematic review of content
and exposure research. Addiction 2017, 112, 28–50. [CrossRef]
61. Searle, R.; Alston, D.; French, D.P. Do UK television alcohol advertisements abide by the code of broadcast
advertising rules regarding the portrayal of alcohol? Alcohol Alcohol. 2014, 49, 472–478. [CrossRef]
62. Aiken, A.; Lam, T.; Gilmore, W.; Burns, L.; Chikritzhs, T.; Lenton, S.; Lloyd, B.; Lubman, D.; Ogeil, R.;
Allsop, S. Youth perception of alcohol advertising: A current advertising regulations working? Aust. N. Z. J.
Public Health 2018, 42, 234–239. [CrossRef] [PubMed]
© 2020 by the authors. Licensee MDPI, Basel, Switzerland. This article is an open access
article distributed under the terms and conditions of the Creative Commons Attribution
(CC BY) license (http://creativecommons.org/licenses/by/4.0/).You can also read