INDIA'S ENGAGEMENT WITH THE GLOBAL ECONOMIC ORDER - UNISCI
←
→
Page content transcription
If your browser does not render page correctly, please read the page content below
Revista UNISCI / UNISCI Journal, Nº 49 (Enero/January 2019)

 INDIA'S ENGAGEMENT WITH THE GLOBAL ECONOMIC ORDER
                            Sanjana Joshi1 and Samridhi Bimal2
                 Indian Council for Research on International Economic Relations

                                                Abstract:
India, the world’s largest democracy, is today the world's sixth-biggest economy and is widely referred
to as the “bright spot” in the global economy still struggling to the recover from the 2008 crisis.
Economic liberalization and internationalization initiated in the 1990s has steadily gained traction
leading India to move from being a marginal participant to a deeply engaged partner in the global
economic order with an active and visible presence. India’s “increasing weight in the global economy”
is also dramatically transforming its political and strategic importance in the evolving post-Cold War
world order.
Key words: India, Global Economy, Engagement, Strategic Partnerships, World Order

        Título en Castellano: El compromiso de la India con el orden económico mundial

                                                Resumen:
La India, la democracia más grande del mundo, es hoy la sexta economía del mundo y se la conoce
ampliamente como una "zona destacada" en la economía mundial que todavía lucha por recuperarse
de la crisis de 2008. La liberalización económica y la internacionalización iniciada en la década de
1990 ha logrado una tracción constante que lleva a la India a pasar de ser un participante marginal a
un socio profundamente comprometido en el orden económico global con una presencia activa y
visible. El creciente peso de la India en la economía mundial también ha transformado
dramáticamente su importancia política y estratégica en la configuración de un orden mundial en
evolución tras la guerra fría.
Palabras Clave: India, Economía Mundial, Compromiso, Asociación Estratégica, Orden
Mundial.

                                      Copyright © UNISCI, 2019.
  Las opiniones expresadas en estos artículos son propias de sus autores, y no reflejan necesariamente la
 opinión de UNISCI. The views expressed in these articles are those of the authors, and do not necessarily
                                       reflect the views of UNISCI.

1
  Sanjana Joshi is a Senior Consultant with the Indian Council for Research on International Economic Relations
(ICRIER), New Delhi
 Email: sjoshi@icrier.res.in
2
  Samridhi Bimal is a Consultant with the Indian Council for Research on International Economic Relations
(ICRIER), New Delhi.
Email: sbimal@icrier.res.in
DOI: http://dx.doi.org/10.31439/UNISCI-34

                                                      63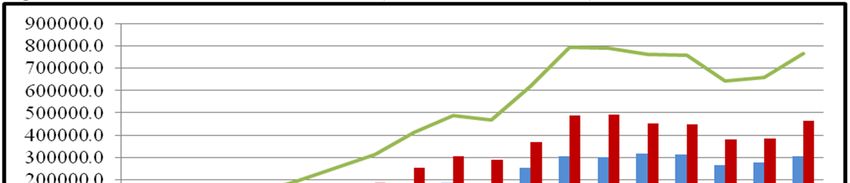
Revista UNISCI / UNISCI Journal, Nº 49 (Enero/January 2019)

1. Introduction:
Since the end of the Cold War and the subsequent economic exigencies that led India to initiate
economic liberalization in the early 1990s the country has come a long way. From being a
marginal participant India is now deeply engaged with the global economic order as an active
and visible contributor. Indeed, the Indian economy today is integrated with the global economy
at a level as never before with a steady liberalization of the trade and investment regimes and
the country’s “increasing weight in the global economy” has also dramatically transformed its
strategic importance in the evolving world order.
         According to the recently released updated figures for 2017 by the World Bank, India,
the world’s largest democracy, is now the world's sixth-biggest economy. Growth in India is
projected to advance 7.3 per cent in FY 2018-19 and 7.5 per cent in FY 2019-20.3 It is the
fastest growing country among the world's major emerging economies.4 On the other hand,
growth in China is anticipated to slow from 6.5 percent in 2018 to 6.3 percent in 2019. 5
Similarly, as per the Internal Monetary Fund (IMF) India’s growth is expected to increase to
7.3 per cent in 2018 and 7.4 per cent in 2019 while in China, growth is projected to moderate
to 6.6 per cent in 2018 and 6.2 per cent in 2019.6 The estimate by the United States Department
for Agriculture Economic Research Service (USDA), based on data collated by the World Bank
and IMF is that India is well poised to become the third-largest economy by 2030, surpassing
four developed nations Japan, Germany, Britain and France.7 In the longer term, the key finding
of the PWC Report The World in 2050 is that in the coming years emerging markets (E7) could
grow around twice as fast as advanced economies (G7) on average.8 As a result, six of the seven
largest economies in the world are projected to be emerging economies in 2050 led by China
(1st), India (2nd) and the US could be down to third place in the global GDP rankings.9
        The key indicators highlighting the deepening integration of the Indian economy with
the global economy include the growing share of trade in the economy, increasing inward and
outward Foreign Direct Investment (FDI), as well as the emergence of India as a provider of
development assistance to other developing countries. India's exports stood at US$ 221.83
billion in April-August 2018 and major exports partners included US, China, Japan, and EU.10
India is also energetically tapping newer markets in Africa and Latin America. The cumulative
FDI flows into India (April 2000- June 2018) were US$ 389.599 billion and the major sectors
attracting FDI were the services sector (including banking, insurance, R&D, testing and
analysis among others), telecommunications, construction development, automobile, drugs and
pharmaceuticals as well as the power sector.11 Notably, from one of the highest recipient of

3
  “World Bank Forecasts 7.3 per-cent growth for India; making it fastest growing economy”. The Economic Times,
6 June 2018 at https://economictimes.indiatimes.com/news/economy/indicators/world-bank-forecasts-7-3-per-
cent-growth-for-india-making-it-fastest-growing-economy/articleshow/64478238.cms
4
  The World Bank, Press Release, 5 June 2018, at http://www.worldbank.org/en/news/press-
release/2018/06/05/global-economy-to-expand-by-3-1-percent-in-2018-slower-growth-seen-ahead
5
  Ibid.
6
   “World Economic Outlook, October 2018: Challenges to Steady Growth; October 8, 2018”, at
https://www.imf.org
7
  “India’s economy to become 3rd largest, surpass Japan, Germany by 2030”. Hindustan Times, Apr 28, 2017 at
https://www.hindustantimes.com/business-news/india-s-economy-will-become-third-largest-in-the-world-
surpass-japan-germany-by-2030-us-agency/story-wBY2QOQ8YsYcrIK12A4HuK.html
8
  “The World in 2050”, pwc, at https://www.pwc.com/gx/en/issues/economy/the-world-in-2050.html
9
  Ibid.
10
   “India: A Snapshot” at https://www.ibef.org/economy/indiasnapshot/about-india-at-a-glance
11
   “Fact Sheet on Foreign Direct Investment (FDI) from April, 2000 to June, 2018”. Department of Industrial
Policy and Promotion, Ministry of Commerce and Industry, Government of India, at
http://dipp.nic.in/sites/default/files/FDI_FactSheet_23August2018.pdf

                                                     64
Revista UNISCI / UNISCI Journal, Nº 49 (Enero/January 2019)
multi-lateral development aid, India has also transitioned into the role of provider, particularly
in its neighborhood, and in the last three years it has given more aid to foreign countries than it
has received.12
2. India’s Trade with the World
From exports of US$ 17.9 billion and imports worth US$ 23.7 billion in 1990-91, India's global
trade stood at US$ 767.9 billion in 2017-18, according to the Ministry of Commerce and
Industry.13 The World Bank notes that the per cent share of trade (sum of exports and imports
of goods and services) in GDP in the case of India has risen from a little over 15 percent in
1990 to 40 per cent in 2017. 14
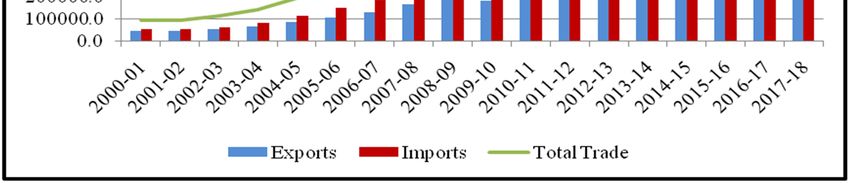
Figure 1: India's Trade with the World (Values in US$ million)
Source: RBI Handbook of Statistics on Indian Economy 2017-18
India’s total merchandise exports have increased more than six times during the last two
decades, from US$ 44.5 billion in 2000-01 to US$ 302.4 billion in 2017-18.15 The rise though
has not been steady over the entire period. In the last decade, India’s export growth has seen
ups and down, being in negative territory four times - in 2009-10 as an aftershock of the 2008
financial crisis, in 2012-13 as a result of euro zone crisis and consecutively in 2014-15 and
2015-16 as a result of fall in global demand and fall in commodity prices impacting terms of
trade for commodity exporters.
Imports on the other hand have increased by more than nine times during the last two
decades, from US$ 50.3 billion in 2000-01 to US$ 459.67 billion in 2017-18.16 As pointed by
Nagesh Kumar, India’s trade liberalization measures resulted in peak tariff rates coming down
12
“Emerging power India gives more aid than it receives”. The New Indian Express, 22nd March 2017, at
http://www.newindianexpress.com/nation/2017/mar/22/emerging-power-india-gives-more-aid-than-it-receives-
1584604.html
13
India's global trade rises 16 per cent to $ 767.9 billion in 2017-18”, Economic Times, 25 April 2018, at
https://economictimes.indiatimes.com/news/economy/foreign-trade/indias-global-trade-rises-16-per-cent-to-767-
9-billion-in-2017-18/articleshow/63914160.cms
14
World Bank Open Data, at https://data.worldbank.org
15
“India’s Foreign Trade: March 2018”, PIB Release, 13 April 2018, at
http://pib.nic.in/newsite/PrintRelease.aspx?relid=178671
16
Ibid.
65Revista UNISCI / UNISCI Journal, Nº 49 (Enero/January 2019)
from 150 per cent in the early 1990s to just 10 per cent by 2007.17 Import licensing has been
dismantled and quantitative restrictions on imports were phased out two years ahead of India’s
WTO schedule and majority of the tariff lines (over 70 per cent) have been bound under WTO.
As per the latest World Trade Organization (WTO) estimates India’s applied most favored
nation import tariffs are 13.4 per cent (simple average) and 7 per cent (trade-weighted
average)18.
With regard to trend in the composition of Indian exports Table 1 shows the falling
share of primary products over 1995-2017. The share of primary products including agricultural
and mineral products has declined from 23 per cent in 1995-96 to just 13 per cent in 2017-18.
Table 1: Structure of India’s Exports (Share in Total Exports)
1995-96 2005-06 2017-18
Primary Products 23 15 13
Manufactured Goods 75 70 69
Petroleum Products 1 11 12
Others 1 2 6
Source: RBI Handbook of Statistics on Indian Economy 2017-18
Although the share of manufactured goods shows a decline of 6 percentage points between
1995-96 and 2017-18, on the other India has emerged as a global petroleum refining hub.19
Moreover, among manufacturing goods, the share of engineering goods has risen steadily from
14 percent in 1995-96 to 25.16 per cent of all merchandise exports in 2017-18.20 Machinery
and equipment and chemicals and related products are two more categories whose exports share
has risen over the last decade. The structure of India’s imports has also changed with increasing
volumes and value of petroleum and crude. While the increase in volume is attributable to the
rising domestic consumption linked to economic growth the rise in import value has been driven
by rising crude oil prices over the past decade.
The stellar performance of India services exports is another significant aspect of the
country’s outward economic orientation and has drawn global attention. Reforms in the service
sector were a part of the overall reform program initiated in the 1990s21 and the share of trade
in services in India’s GDP has jumped from 3 per cent in 1990-91 to 11 per cent in 2017-18.
India’s service exports have not only grown more rapidly than its merchandise exports, they
also grew faster than global service exports.22 For the period 1980-2010, India’s service exports
grew at a CAGR of 13.2 per cent while world exports of services grew at the rate of 7.84 per
17
Kumar, Nagesh: “International Trade, Foreign Direct Investment & Capital Market Reforms” in Hussain
Haqqani (ed.): India and the Global Economy. 2014, New Delhi, Hudson Institute, at
https://www.hudson.org/content/researchattachments/attachment/1420/indiaandthe_global_economy_hudson.pdf
18
“India-Import Tariffs”, India Country Commercial Guide, at https://www.export.gov/article?id=India-Import-
Tariffs
19
Kumar, Nagesh, op.cit.
20
“Highlights of Engineering Exports during 2017-18” at https://www.eepcindia.org/exports-highlights-2017-
18.aspx
21
See Chanda, Rupa (2002): Globalization of Services: India’s Opportunities and Constraints, New Delhi, Oxford
University Press
22
Mukherjee, Arpita: “The Service Sector in India”, ADB Economics Working Paper Series, nº 352 | June 2013
at https://www.adb.org/sites/default/files/publication/30285/ewp-352.pdf
66Revista UNISCI / UNISCI Journal, Nº 49 (Enero/January 2019)
cent and a substantial part of this growth (21.7 per cent) was from 1991–2010.23 In 2017-18 the
total services exports were US$ 195 billion.24
As India’s engagement with the global economy has gained traction a major change
has taken place in the direction of India’s trade in terms of reduced dependence on
conventional developed trade partners like the European Union and the United States and
diversification of trade in new and emerging markets.
Figure 2: Change in % Share of India’s Exports to Key Partners
Source: Export Import Data Bank, Dept. of Commerce, Government of India
For example, the share of EU in India’s trade has decreased from 27 per cent in 1995-96 to 13
per cent in 2017-18 while the share of North America has decreased from 14 per cent in 1995-
96 to 10 percent in 2017-18. On the other hand the Association of Southeast Asian Nations
(ASEAN) share in India’s trade has gone up from 7 percent in 1995-96 to 31 per cent in 2017-
18. In terms of the direction of exports in 2017-18, 39 per cent of India’s exports have gone to
OECD countries closely followed by the developing economies of Asia with a share of 33 per
cent. In terms of regional distribution of imports, in 2017-18, majority of India’s imports came
from within Asia (accounting for a share of 36 per cent). The most significant increase is from
China which had a share of 2 per cent in 1995-96 that has increased to 16 per cent in 2017-18.
Figure 3: Change in % Share of India’s Imports from Key Partners
Source: Export Import Data Bank, Department of Commerce, Government of India
23
Ibid.
24
“India Services”, Ministry of Commerce and Industry, Government of India, at
https://www.indiaservices.in/Service-Trade-Data
67Revista UNISCI / UNISCI Journal, Nº 49 (Enero/January 2019)
Over time India has also come to embrace bilateral and regional trade agreements in various
forms such as Regional Trading Arrangements (RTAs), Free Trade Agreements (FTAs),
Preferential Trade Agreements (PTAs), Comprehensive Economic Partnership Agreements
(CEPAs), and Comprehensive Economic Cooperation Agreements (CECAs).25 The objective
is “to diversify and expand the markets for exports as well as ensuring access to the needed raw
materials, intermediates and capital goods for stimulating value added domestic
manufacturing”.26
Table 2: India’s Current Trade Agreements
Country/Grouping Year
Asia Pacific Trade Agreement (APTA) 1975
Global System of Trade Preferences (GSTP) 1988
India-Sri Lanka FTA 1998
India-Afghanistan PTA 2003
India-MERCOSUR 2004
South Asian Free Trade Area (SAFTA) 2004
India-Chile 2005
India-Singapore CECA 2005
India-Korea CEPA 2009
India-Nepal (Revised) FTA 2009
India-ASEAN FTA 2010
SAARC Agreement on Trade in Services (SATIS) 2010
India-Japan CEPA 2011
India-Malaysia CECA 2011
Source: Department of Commerce, Ministry of Commerce and Industry, Government of India
The following trade agreements with other country/groupings are under negotiation:27
• India - EU Broad based Trade and Investment Agreement (BTIA)
• India - Sri Lanka Economic and Technical Cooperation Agreements (ETCA)
• India - Thailand Comprehensive Economic Cooperation Agreement (CECA)
• India - Mauritius Comprehensive Economic Cooperation and Partnership Agreement
(CECPA)
• India - EFTA Trade and Economic Partnership Agreement (TEPA)
• India - New Zealand Comprehensive Economic Cooperation Agreement (CECA)
• India - Australia Comprehensive Economic Cooperation Agreement (CECA)
• BIMSTEC Comprehensive Economic Cooperation Agreement (CECA)
• India - Canada Free Trade Agreement (FTA)
• Regional Comprehensive Economic Partnership (RCEP) Agreement
25
Das, Ram Upendra: “India-Japan Comprehensive Economic Partnership Agreement (CEPA) Some Implications
for East Asian Economic Regionalism and RCEP”, RIS Discussion Paper # 186, January 2014 at
http://ris.org.in/images/RIS_images/pdf/DP%20186-Dr%20Ram%20Upendra%20Das.pdf
26
“India’s Trade Agreements: Dynamics and Diagnostics of Trade Prospects”, Report by the PHD Chamber of
Commerce and Industry, India, May 2018 at http://phdcci.in/image/data/Research%20Bureau-
2014/Economic%20Developments/Economic-2018/March/Report%20on%20India.pdf
27
“Proposals on Free Trade” PIB Press Release, March 29, 2017 at
http://pib.nic.in/newsite/PrintRelease.aspx?relid=160131
68Revista UNISCI / UNISCI Journal, Nº 49 (Enero/January 2019)
3. Trends in India’s Inward and Outward FDI
The New Industrial Policy (NIP) of 1991 recognized the important role of FDI in terms of
bringing greater competitiveness and efficiency, enabling modernization, technological up
gradation, creating a sound base for export promotion and above all integrating India with rest
of the world. 28 The key reforms in dismantling the “restrictive and selective” regime have
included:
• amendment of the Foreign Exchange Regulation Act (FERA) to remove the general
ceiling of 40 per cent on foreign ownership in FDI projects,
• establishment of the Foreign Investment Promotion Board (FIPB),
• setting up of set up of the Foreign Investment Implementation Authority (FIIA) to
facilitate quick approvals,
• granting of permission to foreign investors and Non-Residents Indian (NRI) investors
to repatriate their profits and capital,
• enactment of the Special Economic Zones Act,
• automatic permission for technology agreements in high priority industries,
• liberalization of technology imports,
• hike in the foreign equity participation limits to 51 per cent for existing companies
• liberalization of the use of foreign “brands name”,
• signing of the Convention of Multilateral Investment Guarantee Agency (MIGA) for
protection of foreign Investments, and
• allowing of FDI to 100 per cent in single brand retailing and 51 per cent in multiple
brand retailing among several others.29
Accordingly, FDI inflows to India have showed an increasing trend since the year 2000 as
shown below and FDI inflows have nearly doubled over the past decade:
Figure 4: India’s Direct Investment Inflows from 2000-2017 (Values in US$ million)
Source: RBI Handbook of Statistics on Indian Economy 2017-18
28
Goel, M.M. and Walia, Ritu: “Determinants of Foreign Direct Investment (FDI) in India: An Analysis”,
Finance India, Vol. XXXI, No. 3, September 2017
at http://www.rgniyd.gov.in/sites/default/files/academic_pdf_publication/FDI.pdf
29
Vyas, Abhishek Vijaykumar: “An Analytical Study of FDI in India (2000-2015)”, International Journal of
Scientific and Research Publications, vol. 5, Issue 10 (October 2015), at http://www.ijsrp.org/research-paper-
1015/ijsrp-p4631.pdf. “Reforms and FDI Inflows into India”, at
http://shodhganga.inflibnet.ac.in/bitstream/10603/12952/12/12_chapter%205.pdf
69Revista UNISCI / UNISCI Journal, Nº 49 (Enero/January 2019)
According to UNCTAD’s World Investment Report 201830, India is the tenth-most attractive
destination for FDI globally and attracted US$ 40 billion in 2017. In sharp contrast FDI in India
was a meager US$132 million in 1991. In terms of developing countries, it is ranked fifth (after
China, Hong Kong, Brazil and Singapore). The cumulative FDI flows into India (April 2000-
June 2018) were US$ 389.599 billion and the major sectors attracting FDI were as below:
Table 3: Sectors Attracting Highest FDI Equity Inflows in India
Sector % Share in Cumulative FDI Inflows
(up to March 2018)
Services Sector 18
Computer Software and Hardware 8
Telecommunications 8
Construction Development: Township, 7
Housing, Built-up Infrastructure
Automobile Industry 5
Trading 5
Drugs and Pharmaceuticals 4
Chemicals (Other than fertilizers) 4
Power 4
Construction (Infrastructure) Activities 3
Note: * Services sector includes financial, banking, insurance, non-financial/business, outsourcing, R&D, courier, tech. testing and analysis
Source: “Fact Sheet on Foreign Direct Investment (FDI) from April 2000 to March 2018”. Department of
Industrial Policy and Promotion, Ministry of Commerce and Industry, Government of India
The share of some top investing countries in India is as below:
Table 4: % Share of Top Investing Countries in Cumulative FDI Inflows from April
2000-March 2018
Country Share
Mauritius 34
Singapore 18
Japan 7
United Kingdom 7
USA 6
Germany 3
France 2
UAE 2
Source: “Fact Sheet on Foreign Direct Investment (FDI) from April, 2000 to March, 2018”. Department of
Industrial Policy and Promotion, Ministry of Commerce and Industry, Government of India
In recent years a significant trend has also been the increase in outbound investments from India
both in terms of magnitude as well as geographical spread and sectoral composition. As pointed
out by Jaya Prakash Pradhan till a “a few decades back, Indian industries and firms were taken
to be inward looking, seeking protection from FDI and imports” 31 . However, “against the
backdrop of liberalization and openness policies that have been instituted since the 1990s the
Indian ODI landscape is changing with the participation of increasing numbers of Indian firms
from a wide range of industries, the proactive role of State-owned enterprises in seeking
30
“World Investment Report 2018”, UNCTAD, at https://unctad.org/en/PublicationsLibrary/wir2018_en.pdf
31
Pradhan, Jaya Prakash: “Indian Outward FDI: A Review of Recent Developments”, in Transnational
Corporations (UNCTAD) 24 (2), pp. 43–70 at https://unctad.org/en/PublicationChapters/diaeia2017d3a2_en.pdf
70Revista UNISCI / UNISCI Journal, Nº 49 (Enero/January 2019)
overseas energy resources, and the growing distribution of investments, which are now
geographically well spread across developed and developing regions.”32 The “Indian firms are
turning into global players with a global market focus and are undertaking overseas investments
for international production, acquisition of foreign-created assets and foreign R&D
activities.”33
Table 5: India's Actual ODI Outflows, April 2014-December 2017 (Values in US$ billion)
Year ODI
2014-15 6.8
2015-16 10.6
2016-17 14.8
2017-18 (up to 31st December) 7.3
Total 39.5
Source: “Fact Sheet on Overseas Direct Investment (ODI) from April 2014 to December 2017”, Department of
Economic Affairs, Ministry of Finance, Government of India
Table 6: % Share of Top Countries Receiving Indian ODI, April 2014-December 2017
Country Share
Mauritius 20
Singapore 30
USA 14
UAE 8
Netherlands 8
UK 7
Switzerland 4
Russia 2
Source: “Fact Sheet on Overseas Direct Investment (ODI) from April 2014 to December 2017”, Department of
Economic Affairs, Ministry of Finance, Government of India
Table 7: Sectors Attracting Highest ODI Flows from India
Sector % Share in Cumulative ODI Flows
(up to March 2018)
Manufacturing 30
Financial, Insurance and Business
Services 29
Wholesale, Retail Trade, Restaurants
and Hotels 12
Transport, Storage and Communication
Services 9
Agriculture and Mining 9
Community, Social and Personal
Services 4
Electricity, Gas and Water 3
Source: “Fact Sheet on Overseas Direct Investment (ODI) from April 2014 to December 2017”, Department of
Economic Affairs, Ministry of Finance, Government of India
32
Ibid.
33
Ibid.
71Revista UNISCI / UNISCI Journal, Nº 49 (Enero/January 2019)
4. India’s thrust on Trade Facilitation, Ease of Doing Business and Cross-border
Connectivity
In April 2015 the government announced the Foreign Trade Policy (FTP) 2015-2020)
underlined the importance of foreign trade in the growth of the Indian economy and aimed at
doubling India’s exports of goods and services. The policy described India’s market and product
strategy along with measures required for trade promotion, infrastructure development and
overall enhancement of the trade ecosystem. 34 The objective is “to provide a stable and
sustainable policy environment for foreign trade; link rules, procedures and incentives for
exports and imports with other initiatives such as Make in India, Digital India, and Skills India,
to create an Export Promotion Mission; promote the diversification of India’s export basket by
helping various sectors of the Indian economy to gain global competitiveness; expand its
markets and better integrating with major regions; and to provide a mechanism for regular
appraisal.35 Trade facilitation and enhancing the ease of doing business are the priority areas in
this new FTP seeking to realize India’s trade potential. 36
To this end, India ratified the WTO Agreement on Trade Facilitation (TFA) in April
2016, and soon after unveiled the National Trade Facilitation Action Plan (NTFA) 2017-2020
that seeks to transform the trade ecosystem by reducing the time and cost of doing business.37
This is to be achieved by simplification of procedures, easy access to all trade related
information and infrastructure augmentation. In line with the TFA the focus of India’s action
plan is on four pillars:
1. Transparency: improved access to accurate and complete information,
2. Technology: development and use of digital and detection technologies to ease
out trade bottlenecks and improve efficiency,
3. Simplification of Procedures and Risk based Assessments: simplified, uniform
and harmonized procedures with increased adoption of a risk based management
approach, and
4. Infrastructure Augmentation: enhancement of infrastructure leading to and in
Sea Ports, Airports, Railways, Roads, and Land Borders.38
These four pillars rest on a robust foundation provided by Coordinated Border Management
through Intra-Government and Inter-Agency cooperation and collaboration.39 The action plan
also lays out specific activities with timelines with a view to monitor the outcomes and links
them with the responsible agency to ensure ownership and remove redundancy of action.40
In this context one of the key outcome indicators identified by Indian policymakers is
the increase in ease of doing business. Indeed, in recent years, the ease of doing business (EDB)
rank has become one of the most widely discussed statistics in Indian economic policy circles.41
34
“Foreign Trade Policy 2015-2020 Unveiled”, PIB Press Release, 1 April 2015 at
http://pib.nic.in/newsite/PrintRelease.aspx?relid=117917
35
“Foreign Trade Policy (2015 - 2020)”, Government of India at http://dgft.gov.in/ForeignTradePolicy
36
Ibid.
37
“India: National Trade Facilitation Action Plan 2017-2020”, at http://www.cbic.gov.in/resources//htdocs-
cbec/implmntin-trade-facilitation/national-trade-facilitation.pdf
38
Ibid.
39
Ibid.
40
Ibid.
41
Moorthy, Vivek and Jason, A. Arul: “The Ease of Doing Business Rank: An Assessment of its
Macroeconomic Relevance”, IIMB-WP N0. 521, June 2016 at http://www.iimb.ac.in/sites/default/files/2018-
07/WP%20No.%20521.pdf
72Revista UNISCI / UNISCI Journal, Nº 49 (Enero/January 2019)
As Moorthy and Jason point out, while there is not much evidence of strong correlation
between the EDB rank and growth, for strategic business and corporate decisions such as where
to locate a plant or for where to channelize FDI, the EDB rank would be a probable decision
input.42
Accordingly, India is making substantial efforts in this direction. The notable
achievement in this regard has been a jump in India’s rank in the World Bank’s annual “Doing
Business Report” (DBR). In the 2019 Report43 India has moved 23 places to rank at 77 among
the 199 countries surveyed. Last year India had improved its rank by 30 places to reach the
100th rank. This is the second consecutive year for which India has been recognized as one of
the top improvers. India has exhibited the highest improvement in two years by any large
country since 2011, improving its rank by 53 positions.
Table 8: India’s Ease of Doing Business Ranking
Year Ranking
2014 142
2015 130
2016 130
2017 100
2018 77
Source: Doing Business, The World Bank (http://www.doingbusiness.org)
In the current report India has improved its rank in 6 out of 10 indicators and has moved closer
to international best practices (Distance to Frontier score) on 7 out of the 10 indicators.44 The
DBR 2019 notes “The reforms in India included streamlining the process of obtaining a
building permit and improved building quality controls…..Starting a business was made easier
through consolidation of multiple application forms and introduction of a goods and services
tax (GST), while getting electricity was made faster and cheaper….Other reforms in India
included strengthening access to credit as well as making it easier and faster to pay taxes and
trade across borders by reducing the time and cost to export and import through various
initiatives, including the implementation of electronic sealing of containers, upgrading of port
infrastructure and allowing electronic submission of supporting documents with digital
signatures.”45
In tandem, enhancing of connectivity with its “immediate and extended
neighborhood” is also being actively pursued by India. In the words of Prime Minister Narendra
Modi, India’s path of international engagement includes “rebuilding connectivity, restoring
bridges and rejoining India with our immediate and extended geographies”46 whereby “India’s
broadest connectivity vision encompasses development partnerships extending from “the
islands of the Indian Ocean and Pacific to the islands of the Caribbean and from the continent
of Africa to the Americas.”47 Presently two major policy initiatives - Act East Policy and the
42
Ibid.
43
“Doing Business 2019” at http://www.worldbank.org/content/dam/doingBusiness/media/Annual-
Reports/English/DB2019-report_web-version.pdf
44
Ibid.
45
Ibid.
46
“Inaugural Address by Prime Minister at Second Raisina Dialogue”, January 17, 2017, at
https://mea.gov.in/Speeches-Statements.htm?dtl/27948/Inaugural_Address
47
Ibid.
73Revista UNISCI / UNISCI Journal, Nº 49 (Enero/January 2019)
Neighborhood First Policy – are the primary drivers of India’s efforts to improve and augment
connectivity with countries and regions across its borders.
Seeking to strengthen India’s economic, political and security relations with the
ASEAN nations in the post-Cold War regional landscape The Look East Policy was launched
in 1991. Gradually the policy went on to encompass India’s engagement with Japan, Republic
of Korea, and China and in recent years, India’s outreach in the Asia Pacific has extended to
Australia and the Pacific Island Countries.48 In 2014 it was upgraded to the Act East Policy
underlining the need for a more action-oriented policy to deepen India’s focus on the countries
to India’s east.49 At the same time the policy is increasingly projected as the new economic
development strategy for India's North Eastern Region (NER) and the policy objective is the
economic integration of the region with South East Asia.50 To achieve this goal the emphasis is
on the “3 C’s - Commerce, Connectivity and Culture”51.
With the Act East Policy, therefore, connectivity enhancing projects are being
undertaken with renewed vigor both within NER and beyond its borders. These include a 4,000-
km long ring road connecting the NER states, an ambitious rail network connecting all state
capitals in Northeast India, the Kaladan Multi-Modal Transit Transport (KMTT) Project
between India and Myanmar, India-Myanmar-Thailand (IMT) Trilateral Highway, India,
Myanmar and Thailand Motor Vehicle Agreement (MVA), extension of the Trilateral Highway
to Laos, Cambodia and Vietnam, direct air connectivity between select cities in NER and
ASEAN countries as well as up gradation of infrastructure at land border crossing points for
seamless movement of goods and people.
Similarly connectivity is a key focus of the Neighbourhood First Policy that places
priority on advancing ties with India’s neighboring countries.52 The rationale for the policy is
the belief that the primary focus of India’s foreign policy has the neighborhood, the immediate
periphery as the country’s security and prosperity, is closely interlinked and interdependent
with this region.53 Greater connectivity, and stronger economic exchanges guided by the mantra
of "shared prosperity through connectivity” aim to bring a new vision to not just bilateral
relations but also regional cooperation.54
A prominent success in this context has been the 2016 Agreement on the establishment
of a Trilateral Transport and Transit Corridor between India, Afghanistan and Iran. The plan
envisages connecting the Chabahar port in Iran via rail link to Zahedan in Iran to Zaranj in
Afghanistan and there onwards into Delaram which is also in Afghanistan.55 Once completed
48
Singh, Antara Ghosal: “India’s Vision for Connectivity: A Discourse Analysis” in India and Connectivity
Frameworks, (2017), Delhi Policy Group Report at
http://www.delhipolicygroup.org/uploads_dpg/publication_file/india-and-connectivity-frameworks-1074.pdf
49
Gaens, Bart and Ruohomäki, Olli: “India’s ‘Look East’ – ‘Act East’ Policy”, FIIA Briefing Paper 222, June
2017 at https://storage.googleapis.com/upi-live/2017/10/bp222_indias-look-east--act-east-policy.pdf
50
Panda, Bhagirathi: “Act East Policy, India’s North-East and Thailand: Issues in Economic Integration” at
https://www.researchgate.net/publication/324330796_Act_East_Policy_India's_North-
East_and_Thailand_Issues_in_Economic_Integration
51
“Remarks by External Affairs Minister at the 5th Roundtable of the ASEAN-India Network of Think Tanks”,
January 06, 2018 at https://mea.gov.in/Speeches-Statements.htm?dtl/29337
52
Singh, Antara Ghosal. op.cit.
53
“Speech by Minister of State for External Affairs at the Gateway of India Dialogue”, June 14, 2016, at
https://www.mea.gov.in/Speeches-Statements.htm?dtl/26910
54
Ibid.
55
“India, Iran and Afghanistan ink trade corridor pact”, LiveMint, May 24, 2016 at
https://www.livemint.com/Politics/pI08kJsLuZLNFj0H8rW04N/India-commits-huge-investment-in-
Chabahar.html
74Revista UNISCI / UNISCI Journal, Nº 49 (Enero/January 2019)
the project will facilitate easy movement of Afghan goods to come up to Zahedan in Iran from
where they can be transported to Chabahar and shipped to India and vice versa for India goods
bound for Afghanistan.56 The eventual aim is to connect this corridor with the multi-modal
International North South Transport Corridor connecting South Asia and Europe.
Taking cue from the growing discourse on transforming transport corridors into
economic corridors India has also initiated the Bangladesh-Bhutan-India-Nepal (BBIN)
connectivity project wherein a Motor Vehicles Agreement (MVA) was signed by the Transport
Ministers of the BBIN countries in Bhutan in June 2015 for “seamless flow of passenger and
cargo traffic in the region”57. Despite subsequent hesitation on part of Bhutan to ratify the
agreement the other participating countries are moving ahead with its implementation and have
agreed on the text of the passenger protocol. Trial runs for cargo vehicles along scheduled routes
are also underway.
5. Strategic Aspects of India’s Economic Growth
In the evolution of India’s “new foreign policy strategy” a major transition in post-Cold War
Indian foreign policy pertains to the realization of the importance of economic power that put
emphasis on economics in the making of foreign policy.58 As India initiated domestic economic
reforms and pragmatically sought out new partners in the global economy for its developmental
needs the resulting economic growth set off another major transition which is about the shift
from being a leader of the “Third World” to the recognition of the potential that India could
emerge as a great power in its own right.59 According to C. Raja Mohan, while independent
India has always had a sense of its own greatness the realization of this aspiration never seemed
realistic until the Indian economy began to grow rapidly in the 1990s.60 As India has gradually
emerged as “a player of some significance in the global economy”61 not only is the country
“seeking accommodation into the global order as a major power”62 with growing confidence,
others are also increasingly accepting it as a key strategic. In a globalised world, just as India
engages the world, India is also being engaged by the world.63
The most notable convergence of interests between India and other major powers is
evident in the case of the United States. In sharp contrast to the theme of “estranged
democracies” that emphasized the widely divergent word views of the two nations, the US has
come to regard India as a “natural partner” and the geopolitical importance of a liberal,
democratic and economically rising India underlines most contemporary US global strategic
formulations. In the words of former US Ambassador to India, Robert Blackwell, the United
States has to “strengthen political, economic and military-to-military relations with those Asian
56
Ibid.
57
“BBIN pact: India, Bangladesh, Nepal okay vehicle movement procedure’, LiveMint, 15 January 2018 at
https://www.livemint.com/Politics/kVaw1u3uvAq3SVugqTGkCI/BBIN-pact-India-Bangladesh-Nepal-okay-
vehicle-movement-pr.html
58
Mohan, C. Raja: “India’s New Foreign Policy Strategy”, Draft paper presented at a Seminar in Beijing by China
Reform Forum and the Carnegie Endowment for International Peace, Beijing, 26 May 2006 at
https://carnegieendowment.org/files/Mohan.pdf
59
Ibid.
60
Ibid.
61
“India: Economic Survey 2011-12”, Chapter 4, “India and the Global Economy”, at
https://www.indiabudget.gov.in/budget2012-2013/es2011-12/echap-14.pdf
62
Passi, Ritika and Pant, Harsh V.: “Debating Disruption: Change and Continuity” in Passi, Ritika and Pant, Harsh
V. (Ed.) Raisina Files: Debating Debating Disruption: Change and Continuity, vol 3 (January 2018), at
https://www.orfonline.org/wp-content/uploads/2018/01/Raisina_Files_2018_Web1.pdf
63
Bava, Ummu Salma: “New Powers for Global Change? India’s Role in the Emerging World Order”, FES
Briefing Paper 4 | March 2007 at https://library.fes.de/pdf-files/iez/global/04372.pdf
75Revista UNISCI / UNISCI Journal, Nº 49 (Enero/January 2019)
states that share our democratic values and national interests. That spells India…”64 In this
context, in 2005, the two countries launched their “Global Partnership” and signed a defense
framework agreement to expand bilateral security cooperation. Another high point was the 2008
Civil Nuclear Agreement that dramatically reversed three decades of US nonproliferation
policy. The deepening and broadening strategic partnership between the two countries today
finds expression in the term “Indo-Pacific” gaining traction as a geopolitical construct.65 As
noted by a US official - “We have strong and growing ties with India. We talk about Indo-
Pacific in part because that phrase captures the importance of India’s rise”. 66 Indeed
Washington’s support for a greater role for India in regional and global affairs has been aptly
described by US President Barack Obama –“The United States does not just believe, as some
people say, that India is a rising power; we believe that India has already risen. India is taking
its rightful place in Asia and on the global stage. And we see India’s emergence as good for the
United States and good for the world”.67
Another significant political turn around that has greatly benefitted India in recent years
is the upgrading of low-key relations between Japan and India to a “global and strategic
partnership” in 2006. As noted in the Roadmap for New Dimensions to the Strategic and Global
Partnership between Japan and India “a strong, prosperous and dynamic India is in the interest
of Japan…” and that “Japan and India share a congruence of interests”.68 In 2008 the two
countries issued the Joint Declaration on Security Cooperation between Japan and India
wherein it was agreed to create a comprehensive framework for the enhancement of security
cooperation. The declaration affirmed “similar perceptions of the evolving environment in the
region and the world at large” and on signing the declaration, the Japanese and Indian Prime
Ministers asserted that the strategic partnership between the two countries would become “an
essential pillar for the future architecture of the region”.69 The only other country with which
Japan has signed a similar declaration is Australia. The Free and Open Indo-Pacific Strategy
announced by Japanese Prime Minister Shinzo Abe last year wherein Japan will “enhance
connectivity between Asia and Africa to promote stability and prosperity across the regions”
further highlights the importance Japan has come to place on its strategic partnership with India.
In fact Japan’s assistance for the development of India’s North Eastern Region is already a
“concrete symbol” in this regard.
A similar pattern of increasingly converging strategic interests has been discernable in
India-Australia relations. This has led to the up gradation of bilateral relationship between the
two nations to a “Strategic Partnership”, including a Joint Declaration on Security Cooperation
64
“India, U.S. share vital national interests”, The Hindu, 11 December 2002 at
https://www.thehindu.com/thehindu/2002/12/11/stories/2002121103411200.htm
65
Mohan, C. Raja: “Donald Trump’s ‘Indo-Pacific’ and America’s India Conundrum”,
ISAS Insights nº 476 – 13 November 2017 at https://www.isas.nus.edu.sg/wp-
content/uploads/media/isas_papers/ISAS%20Insights%20No.%20476-%20Donald%20Trump's%20'Indo-
Pacific'%20and%20America's%20India%20Conundrum.pdf
66
“”Indo-Pacific” over “Asia Pacific” reflects India’s rise: US official”, Economic Times, 5 November 2017 at
https://economictimes.indiatimes.com/news/defence/indo-pacific-over-asia-pacific-reflects-indias-rise-us-
official/articleshow/61519684.cms
67
“Remarks by the President and First Lady in Town Hall with Students in Mumbai, India,” White House release,
7 November 2010 at https://obamawhitehouse.archives.gov/the-press-office/2010/11/07/remarks-president-and-
first-lady-town-hall-with-students-mumbai-india
68
“Joint Statement On the Roadmap for New Dimensions to the Strategic and Global Partnership between Japan
and India”, 22 August 2007 at https://www.mofa.go.jp/region/asia-paci/pmv0708/joint-2.html
69
Brewster, David: “The Australia–India Security Declaration: The Quadrilateral Redux?” Security Challenges,
vol. 6, no. 1 (Autumn 2010), pp. 1-9, at http://www.securitychallenges.org.au/ArticlePDFs/vol6no1Brewster.pdf
76Revista UNISCI / UNISCI Journal, Nº 49 (Enero/January 2019)
in 2009. 70 Indeed, shedding its previous reluctance ASEAN too has moved to formalize a
“strategic partnership” with India in 2012.
6. Conclusion
India’s post-Cold War engagement with the global economy has been instrumental in
unshackling the country’s growth potential. The embrace of economic liberalization and
internationalization has paid rich dividend in terms of meeting the country’s developmental
needs as well as providing it greater say in the global economic order. No doubt the ‘China
challenge’ is the context for India’s emergence as a major strategic player in the evolving world
order, a role that has been endorsed particularly by the United States, however, it is India’s
economic rise that has imparted it this standing.
Bibliography
Bava, Ummu Salma: “New Powers for Global Change? India’s Role in the Emerging World
Order”, FES Briefing Paper, 4 | March 2007
Brewster, David: “The Australia–India Security Declaration: The Quadrilateral Redux?”
Security Challenges, vol. 6, nº 1 (Autumn 2010).
Chanda, Rupa (2002): Globalization of Services: India’s Opportunities and Constraints, New
Delhi: Oxford University Press
Das, Ram Upendra: “India-Japan Comprehensive Economic Partnership Agreement (CEPA)
Some Implications for East Asian Economic Regionalism and RCEP”, RIS Discussion Paper #
186, January 2014
Gaens, Bart and Ruohomäki, Olli: “India’s ‘Look East’ – ‘Act East’ Policy”, FIIA Briefing
Paper 222, June 2017.
Goel, M.M. and Walia, Ritu: “Determinants of Foreign Direct Investment (FDI) in India: An
Analysis”, Finance India, vol. XXXI, nº 3 (September 2017).
Kumar, Nagesh: “International Trade, Foreign Direct Investment & Capital Market Reforms”
in Hussain Haqqani (ed.) (2014): India and the Global Economy, New Delhi: Hudson Institute
Mohan, C. Raja: “Donald Trump’s ‘Indo-Pacific’ and America’s India Conundrum”,
ISAS Insights No. 476 – 13 November 2017
Moorthy, Vivek and Jason, A. Arul: “The Ease of Doing Business Rank: An Assessment of its
Macroeconomic Relevance”, IIMB-WP, nº 521 (June 2016).
Mukherjee, Arpita: “The Service Sector in India”, ADB Economics Working Paper Series, nº
352 | (June 2013)
Passi, Ritika and Pant, Harsh V.: “Debating Disruption: Change and Continuity” in Passi, Ritika
and Pant, Harsh V. (ed.) (2018): Raisina Files: Debating Disruption: Change and Continuity,
Volume 3, Observer Research Foundation.
70
“India-Australia Bilateral Relations” at
https://www.mea.gov.in/Portal/ForeignRelation/Australia_05_09_2017.pdf
77Revista UNISCI / UNISCI Journal, Nº 49 (Enero/January 2019)
Pradhan, Jaya Prakash: “Indian Outward FDI: A Review of Recent Developments”,
Transnational Corporations (UNCTAD) vol. 24, nº 2 (2017).
Singh, Antara Ghosal: “India’s Vision for Connectivity: A Discourse Analysis” in Krishan
Singh Hemant (dir.) (2017): India and Connectivity Frameworks, Delhi Policy Group Report.
Vyas, Abhishek Vijaykumar: “An Analytical Study of FDI in India (2000-2015)”, International
Journal of Scientific and Research Publications, vol. 5, Issue 10 (October 2015).
78You can also read