Privileged Rebels: A Longitudinal Analysis of Distinctive Economic Traits of Catalonian Secessionism - MDPI
←
→
Page content transcription
If your browser does not render page correctly, please read the page content below
genealogy
Article
Privileged Rebels: A Longitudinal Analysis of
Distinctive Economic Traits of
Catalonian Secessionism
Josep M. Oller 1, *, Albert Satorra 2 and Adolf Tobeña 3
 1   Department of Genetics, Microbiology and Statistics, University of Barcelona, 28008 Barcelona, Spain
 2   Department of Economics and Business, Universitat Pompeu Fabra, 08005 Barcelona, Spain;
     albert.satorra@upf.edu
 3   Department of Psychiatry and Forensic Medicine, Institute of Neurosciences,
     Autonomous University of Barcelona, 08193 Cerdanyola (BCN), Spain; adolf.tobena@uab.cat
 *   Correspondence: joller@ub.edu

 Received: 7 December 2019; Accepted: 10 February 2020; Published: 15 February 2020

 Abstract: During the last decade, the Catalonian secessionist challenge induced a chronic crisis within
 Spain’s politics that does not offer hints of a viable arrangement. The rapidly escalating demands for
 secession ran almost in parallel with the accentuation of the economic recession that followed the
 disruption of the world financial system in 2008–2010. Such secession claims reached maximums
 during 2012–2014, attaining support levels of nearly 50% of citizenry in favour of independence.
 These figures subsequently diminished a bit but remained close to that level until today. Despite
 the coincident course, previous studies had shown that the impact of economic hardships was not a
 major factor in explaining the segregation urgencies, connecting them instead to triggers related to
 internecine political struggles in the region: Harsh litigations that resulted in an abrupt polarization
 along nationalistic features in wide segments of the population. In this longitudinal analysis based
 on the responses of 88,538 individuals through a regular series of 45 official surveys, in the period
 2006–2019, we show that economic factors did play a role in the secessionist wave. Our findings
 showed that the main idiomatic segmentation (Catalan vs. Spanish, as family language) interacted
 with economic segmentations in inducing variations on national identity feelings that resulted in
 erosions of the dual CatSpanish identity. Moreover, our findings also showed that the more privileged
 segments of Catalonian citizenry where those that mostly supported secession, whereas poorer and
 unprotected citizenry was clearly against it. All the data points to the conclusion that the secessionist
 challenge was, in fact, a rebellion of the wealthier and well-situated people.

 Keywords: Catalonia; secessionism; household net income; family/mother language

1. Introduction
     Catalonian secessionism acquired relevance in Spanish politics from 2010 onwards. Before that,
social activism and political parties pursuing secession were a minor issue. Secessionist forces won
three regional elections and sustained governments by tiny majorities in the Autonomous Parliament
in this period. Two anomalous consultations about self-determination were organized and around 2
million (38% of population census) supported secession from Spain. An “Independence Declaration”
was proclaimed on 27 October 2017, devoid of any legal or practical consequence. Such a move resulted
in the full suspension of home rule, sanctioned by Spanish Parliament, that endured until mid-2018.
     Secessionist parties renovated their lead at the last regional election (27 December 2017). The
Spanish Government decided to advance elections both to defuse the crises and finish the suspension
of home rule. The results, however, confirmed the stagnation though the formation of a new Regional

Genealogy 2020, 4, 19; doi:10.3390/genealogy4010019                            www.mdpi.com/journal/genealogy
Genealogy 2020, 4, 19                                                                                                    2 of 17

Government had to wait until mid-2018, after several attempts to reinstate in power the rebellious
leaders who had fled to exile or been imprisoned. These unsuccessful efforts were blocked by legal
provisions dictated by the Spanish High Court. A left-wing government was formed in Spain, in
June 2018, which had the initial support from Catalonian and Basque nationalists. This seemed to
open an opportunity to explore new arrangements but the talks between the Central Government and
the secessionist Catalan government did not lead to any advancement. At Spain‘s general election
of 28 April 2019, left-wing parties renovated their lead, although without reaching a stable majority.
The formation of a new government had to wait until January 2020, after a new general election, on
November 2019, that finally led to an apparently viable left coalition. On 14 October 2019, the Spanish
Supreme Court1 handed down sentences of several years in prison to nine secessionist leaders, finding
them guilty of sedition for their role in the failed 2017 bid for independence.
      The surge of pressing demands for independence has thus endured, with minor oscillations,
since 2010. Two regional elections (September 2015; December 2017), two illegal referendums of
self-determination in which only the secessionists went to the poll stations (9 November 2014; 1 October
2017), and a series of systematic surveys both by CEO (the official survey agency of the Regional
Government)2 and CIS (the official survey agency of the Central Government)3 , showed the existence
of a political division in two halves on the issue of secession. Over the last five years the question “Do
you want Catalonia to be an independent state?” (CEO series of “political barometers”) received 45% to
48% “YES” answers to “NO” answers from 44% to 48%, and 5–10% remnants of “DON’T KNOW/NO
ANSWER”. Results on 21 December 2017 regional elections disclosed an almost perfectly divided
society: Turnout reached an historical mark of 79.1%; secessionist parties got 2,079,330 votes (47.33%),
whereas non-secessionist parties won 2,227,421 votes (50.71%). A narrow margin of 150,000 votes
distanced unionists from secessionists.
      Catalan unionists (around three million, from a census of 5.5 million within a population of 7.5
million) did not join the secessionist venture. Most of them have familial, affective and economic
links with Spain. They are heterogeneous though they predominate on coastal conurbations around
Barcelona and Tarragona, as well as in other medium-sized towns (Lepic 2017; Maza et al. 2019). They
remained expectant all along the secessionist surge, but during October 2017, in the weeks preceding
the “Independence Declaration”, unionist activism increased amid escalating tensions (Barrio and Field
2018; Garcia 2018). They deployed demonstrations in downtown Barcelona that competed with the
huge ones that secessionists had mounted repeatedly (Barrio and Field 2018; Coll et al. 2018; Crameri
2014, 2015; Garcia 2018; Tobeña 2017a, 2017b).
      The main social consequence of the sustained secessionist campaign has been the excavation of
a deep political divide between two large fractions of Catalan citizenry, secessionists and unionists,
which was absent before the precipitous demands of segregation from Spain (Amat 2015; Elliott 2018;
Ucelay-da Cal 2018). The lack of a social majority behind the vigorous but failed secessionist venture
opened apprehensions and frictions that were mostly unknown previously. Neighbours, colleagues
and even friends and families who had shared feelings of belonging to both Catalonia and Spain (in
different degrees) as a part of their attachments and values, are now divided on the issue of secession
and must endure living together amid unsolved tension (Garcia 2018; Morel 2018; Coll et al. 2018; Oller
et al. 2019a, 2019b).
      The secessionist movement devoted, from the start, big efforts to convincing the world that it
was deeply rooted on a spontaneous and widely distributed aspiration to attain sovereignty that came
from all corners and social strata within Catalonian citizenry. That is, without distinctions that might
suggest the operation of a political agenda biased by economic, territorial or cultural/ascendancy based

1   In Spain the “Supreme Court” is the highest judiciary level. The “Tribunal Constitucional” (High Spanish Court) is the
    highest instance for both legislative and judiciary litigations, equivalent to the Supreme Court in other Western countries.
2   CEO (Centre d’Estudis d’Opinió, http://ceo.gencat.cat/).
3   CIS (Centro de Investigaciones Sociológicas, http://www.cis.es/cis/opencms/ES/index.html).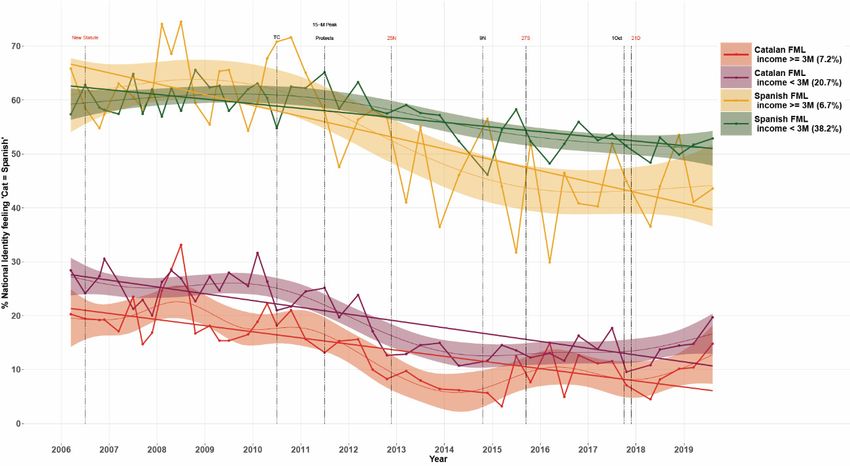
Genealogy 2020, 4, 19                                                                                   3 of 17

interests. It must be recognized that that kind of discourse obtained a good reception (Crameri 2014,
2015; Minder 2017; Dowling 2018; Cardenal 2020), though there were cautions signalling towards
the concomitant influence of top-down mechanisms rooted on a harsh political struggle between
secessionist formations to lead the region (Barrio and Field 2018; Elliott 2018).

1.1. Antecedents
      While initial interpretations of the upsurge of Catalonian secessionism linked the appearance
of the wave of social discontent to resentment over economic grievances against the Spanish state,
during the extensive downturn of the 2008–2012 world financial crisis, recent analyses have discarded
those interpretation. Applying different statistical methods, both (Bel et al. 2019; Romero-Vidal 2019)
established the inability of important contextual factors to explain the surge and maintenance of the
Catalonian secessionist push: Neither the impact of the economic crisis in 2008–2013 or the evolution of
preferences for governance options within the region, along the whole period 1991–2018, were able to
convincingly explain the appearance of intense and sustained demands for full sovereignty. Cohering
with that, (Maza et al. 2019) multivariate analysis of voting behaviour at the last regional elections
(21 December 2017), showed a clear priority of family ascendancy origins over economic factors to
explain the electoral results. The authors (Cuadras-Morató and Rodon 2019) obtained fully concordant
findings as well. The authors (Borrell and Llorach 2015) and others (Bosch and Espasa 2014; Sánchez
Cartas 2015) had already shown that the attempts to justify the secessionist challenge as a response to
the chronic maltreatment by a parasitic Spanish state acting with extractive procedures towards the
Catalonian economy were devoid of substance and worked only as propaganda weapons to nourish
the conflict.
      In a systematic longitudinal analysis, (Oller et al. 2019a, 2019b) showed that family language/ascendancy
origins and the biased influence of regional media were crucial and unavoidable factors of the ongoing
division between secessionists and unionists. Those two factors influenced important realignments on
both national identity feelings and support for secession. The same study offered hints about the potential
relevance of economic segmentations as added factors for differential alignments. The relevance of some
socioeconomic ingredients on preferences for secession was first highlighted by (Llaneras 2017) using
data from CEO surveys near the crucial months of autumn 2017. Secession appealed mostly to native
Catalans: It was higher among citizens born in Catalonia and with at least one parent born there, with a
maximum (75%) for those with long native ascendancy. For citizens coming from abroad or from other
Spanish regions, and for those born in the region from migrant parents, secession was not attractive at
all (CEO barometer July 2017). The divide depended also on incomes: Citizens with highest incomes
and those who responded “we live comfortably” were the ones that backed secession. On the contrary,
people with low salaries and those disclosing “many economic difficulties” were against secession. These
previous but partial findings demanded further study that might reveal the influence of economic factors
on fragmentation tensions that have appeared, in different parts of Europe, during the last two decades
(Sorens 2005, 2008; Serrano 2013; Muñoz and Tormos 2013, 2015; Bourne 2014; Muro and Vlaskamp 2016;
Piketty 2019).

1.2. Plan of the Study
      Our main aim, in this paper, is to display a series of longitudinal findings that may shed light
on the potential relevance that some economic factors played upon the surge of the fissure between
Catalonian unionists and secessionists. By building upon the complete series of data from iterated
official CEO polls (the Survey Agency of the Regional Government), including 85.538 respondents
from 45 surveys, we will show the evolving changes along the period 2006–2019 of national identity
feelings and political preferences on the issue of secession.
      After displaying the differential geographical distribution of both electoral preferences and the
degree of support for secession, we will explore, in detail, the role of various economic and social
transitions that might have contributed to establishing the pattern of traits that currently characterize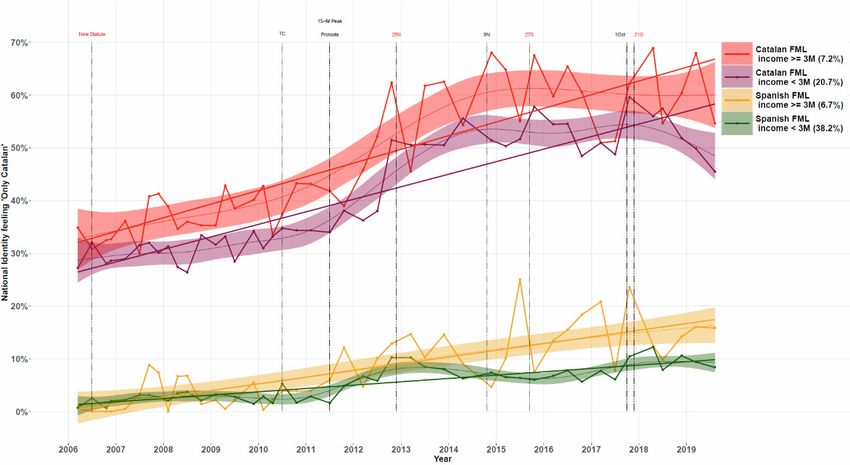
Genealogy 2020, 4, 19                                                                                           4 of 17

     the division and entrenchment between secessionists and unionists. We will try to explore, afterwards,
     potential interactions between economic segmentations with variations of national identity feelings
     in the main two segments of Catalonian citizenry; those whose family language is Catalan vs. those
     whose family language is Spanish. This is mandatory since previous findings had established the
     priority of this ethnolinguistic cleavage rooted on ascendancy origins (Oller et al. 2019a, 2019b).
          We expect that this longitudinal dissection of the relevance of socioeconomic ingredients upon
     the secessionist push in Catalonia will contribute to illuminating factors that may help not only to
     understand its origins and development, but to hopefully contribute as well to attenuating the more
     worrying consequences of such a crisis.

     2. Methods
            To 4,display
Genealogy 2020,          the structure
                  x FOR PEER REVIEW  of secessionist vs. unionist preferences among Catalonian citizenry
                                                                                                 6 of 17 we
      started by using the official electoral data from the last regional election (21 December 2017). The
      geographical distribution of the pro-secession vote was examined by adding the results of the three
3. Results
      secessionist political parties: JxCat, ERC and CUP. We obtained a map (Figure 1) with 947 current
     We started by geographically localizing the relevance of support for secession using the official
      Catalan municipalities coloured in distinctive tones: In red when the sum of the secessionist vote
results of the last regional elections (21 December 2017), and adding the votes obtained by the three
      was greater than 50% of the municipal census and in pale pink, otherwise. Secondly, we obtained a
main current secessionist parties: JxCat (right), ERC (left) and the CUP (far left). These regional
      map with the 947 current Catalan municipalities coloured in five green hues according to percentages
elections are the event where secessionist support is more clearly revealed, as majorities at the
      of unionism votes on the electoral census of each municipality (Figure 2). These results are also
Autonomous Parliament and the Government depend on them.
      summarized in Table 1.

           Figure 1. Geographic distribution of secessionism at regional elections 21 December 2017. The
     Figure 1. Geographic distribution of secessionism at regional elections 21 December 2017. The
          percentages by municipalities are computed over their corresponding electoral census. Secessionism
     percentages by municipalities are computed over their corresponding electoral census. Secessionism
           is majoritarian (in red) at 76% of the municipalities, representing 78% of the surface of the whole
     is majoritarian (in red) at 76% of the municipalities, representing 78% of the surface of the whole
           region, but only 20% of the electoral census live in this area, while the remaining 80% live in the rest of
     region, but only 20% of the electoral census live in this area, while the remaining 80% live in the rest
           Catalonia (in rose pale). Secessionism is concentrated at inland counties mainly, whereas unionism
     of Catalonia (in rose pale). Secessionism is concentrated at inland counties mainly, whereas unionism
          predominates on overpopulated coastal areas and in some Pyrenean and peripheral counties as well.
     predominates on overpopulated coastal areas and in some Pyrenean and peripheral counties as well.

     As in Figure 1, when secession support at each municipality was greater than 50% of the electoral
census, they were indicated in red. The highest values were found at the smallest municipalities,
while they progressively dropped at the largest municipalities of Barcelona and Tarragona
conurbations. Barcelona city showed intermediate scores. The main trend is exemplified with the
following two results: Santa Cecília de Voltregà: Electoral census 163 citizens, secession support:
Genealogy 2020, 4, 19                                                                                                5 of 17
Genealogy 2020, 4, x FOR PEER REVIEW                                                                                7 of 17

           Figure 2. Geographic distribution of non-secessionist vote at regional elections 21 December 2017. The
     Figure  2. Geographic
           percentages        distribution ofare
                          by municipalities   non-secessionist
                                                 computed overvote  at regional
                                                               all their        electionselectoral
                                                                         corresponding    21 December    2017.
                                                                                                   census. TheThe
                                                                                                                different
     percentages    by   municipalities  are  computed   over  all their  corresponding    electoral  census.  The
           shades of green correspond to the different percentages of unionist forces at each municipality. Observe
     Genealogy
           the2020,
     different      4, x complementary
                 shades
                pattern  FOR
                           of PEER
                              greenREVIEW
                                     correspond    to the different
                                          to that observed in Figure percentages
                                                                      3.            of unionist forces at each          8 of 17
     municipality. Observe the pattern complementary to that observed in Figure 3.

    The summary of the results for Figures 1 and 2 appears in Table 1 (from the electoral data of 21–
12–2017, the last regional elections):

                    Table 1. Secessionists and non-secessionists in different geographic areas.

                                                    Secessionists      Non-Secessionists
                             Zone in Red               1.069M              0.434M
                           Zone in Pale Pink           0.996M              2.829M
                                 Total                 2.065M              3.263M

     Secessionists are majoritarian in three quarters of the territory, but less than 25% of the electoral
census live in those parts of the region, while in the remaining part, more than 75% of the census is
concentrated.
     We developed also an alternative method to visualize the differential distribution of the pro-
secession vote, presented in Figure 3. The municipalities are ordered in terms of an index, developed
from a factorial analysis obtained from electoral data in general and regional elections throughout
the period 2008–2012. This index, which shall be referred to hereafter as the unionism index, measures
the degree of support for unionist forces at each municipality, from low to high degrees. The
         Figure
          Figure 3.
                  3. Catalonian
                      Catalonianmunicipalities
                                  municipalitiessorted
                                                  sortedbybythethevalue
                                                                   valueofofan
                                                                             anindex
                                                                                 indexmeasuring
                                                                                         measuring“unionism”
                                                                                                     “unionism”degree.
                                                                                                                    degree.
accumulated census and percentages of support for secessionist forces are represented for each
         This
          This is an
                  an index
                      indexbased
                             basedonon  a factor
                                     a factor    analysis
                                              analysis overover   electoral
                                                            electoral        data
                                                                       data in thein   the period
                                                                                    period         2008–2012.
                                                                                            2008–2012.   For eachFor  each
                                                                                                                   abscissa
municipality. The percentage of secession support is represented through a smooth curve, based on
          point, we
         abscissa     show
                   point, wethe accumulated
                              show             electoral
                                    the accumulated      census census
                                                       electoral  to the left of that
                                                                          to the      point,
                                                                                 left of      from 0%
                                                                                         that point,    to 0%
                                                                                                     from  100%   in green.
                                                                                                               to 100%  in
moving averages.
          We show
         green.   Wealso  a smoothed
                       show             average (in
                              also a smoothed        red) of(in
                                                  average     thered)
                                                                  corresponding     secessionismsecessionism
                                                                       of the corresponding         at each municipality.
                                                                                                                  at each
            Note that the Note
           municipality.    highest thatvalues appear at
                                          the highest     the smallest
                                                       values  appear municipalities,
                                                                       at the smallestwhile  they progressively
                                                                                        municipalities,         fall
                                                                                                        while they
            at the largest fall
           progressively    municipalities    in the
                                 at the largest      Barcelona metropolitan
                                                 municipalities              area.metropolitan
                                                                in the Barcelona   The Barcelona  municipality
                                                                                               area.            had
                                                                                                     The Barcelona
            intermediatehad
           municipality   behavior.
                                intermediate behavior.

     3.1. Longitudinal Changes of Household Net Incomes on the Main Family Language Segments
          Based on Household net income levels among citizens with family/mother language Catalan
     and those with family/mother language Spanish, we estimated the medians of household net incomes
     for each linguistic segment throughout the period 2006–20194. Citizens with family language Catalan
Genealogy 2020, 4, 19                                                                                 6 of 17

                        Table 1. Secessionists and non-secessionists in different geographic areas.

                                                     Secessionists          Non-Secessionists
                             Zone in Red                1.069 M                  0.434 M
                           Zone in Pale Pink            0.996 M                  2.829 M
                                 Total                  2.065 M                  3.263 M

     We built then a way to visualize the distribution of the pro-secession vote across municipalities
of the region. They were ordered according the ranks of an index obtained considering municipal,
regional and general election results in the period 2008–2012 and a factorial analysis. Such an index can
be interpreted as a measure of “unionism”. Then we plotted simultaneously the cumulative electoral
census, from 0% to 100% and a smooth moving average of percentages of secession support at each
municipality (Figure 3). The shape of both plots shows the relationship between municipality sizes
and support for secession. Further details could be supplied by the authors to any interested reader.
     We then proceeded to analyze the evolution of several measures obtained by consecutive CEO
barometers (the official survey agency of the Regional Government), during the period 2006–2019,
from representative samples of Catalonian citizenry through personal interviews. Sample sizes for
each survey oscillated between 2500 and 1500 citizens, with the exception of autumn 2017, which had
only 1338 citizens. This longitudinal analysis was based on responses of 88,538 individuals through
a regular series of 45 official surveys, in the period 2006–2019. Our variables came from particular
questions on these CEO barometers. Specifically, our main economic variable was “household net
incomes” for the whole population and its interaction with the main family/mother language segments
(Catalan vs. Spanish). We estimated medians of “household net incomes” of segments defined by
the second one. We also used a binary variable “household net incomes ≥3000 €/month”, with two
possible results “Yes” or “No”, discarding the relatively few answers “do not know” or “do not answer”
(“DK/NA”). We also used the qualitative variables “economic resistance limit in case of economic
breakdown” (based on questions asked in two surveys in 2016 and 2017), and “perception of own
economy last year”, both in combination with support for secession in a (hypothetical) referendum of
self-determination (as is specifically asked in these CEO barometers, but only from 2015 onwards).

Longitudinal Variations on National Identity Feelings Depending on “Household Net Incomes” and
Linguistic Segments
     We focused our analyses on the evolution of national identity (sense of belonging feelings) because
these CEO barometers maintained a specific question on this issue, without changes, along the whole
period. It had six options: “only Catalan”, “more Catalan than Spanish”, “as Catalan as Spanish”,
“more Spanish than Catalan”, “only Spanish”, and DK/NA. Previous work had established substantial
covariation between national identity feelings and preferences in favour of or against secession, despite
addressing different features (Oller et al. 2019a, 2019b). We considered the variable family/mother
language and the dichotomous variable net income plus. First, we plotted the evolution of the national
identity “only Catalan” on the four groups obtained crossing the main two segments of family/mother
language (Catalan vs. Spanish) with the dichotomous variable net income plus (with also two levels,
according to whether the household net incomes were greater than, equal to, or less than 3000 €/month).
The graphics allowed comparisons of different evolution for these groups. Secondly, we obtained the
same graphs for the national identity “as Catalan as Spanish” on the same groups, and finally we did
the same with the national identity “only Spanish”.
     We additionally analysed this data, just as an approximation, through the perspective of Analysis
of Covariance (ANCOVA). For the sake of simplicity, we started with two ordinary univariate analyses
and continued with a combination of them in a trivariate version of MANCOVA that we shall describe
hereafter. At the start, we considered two factors for both analyses the levels of which were the possible
values of the qualitative variable family/mother language (with two levels corresponding to the main
linguistic segments, Catalan and Spanish) and the dichotomous variable net income plus (according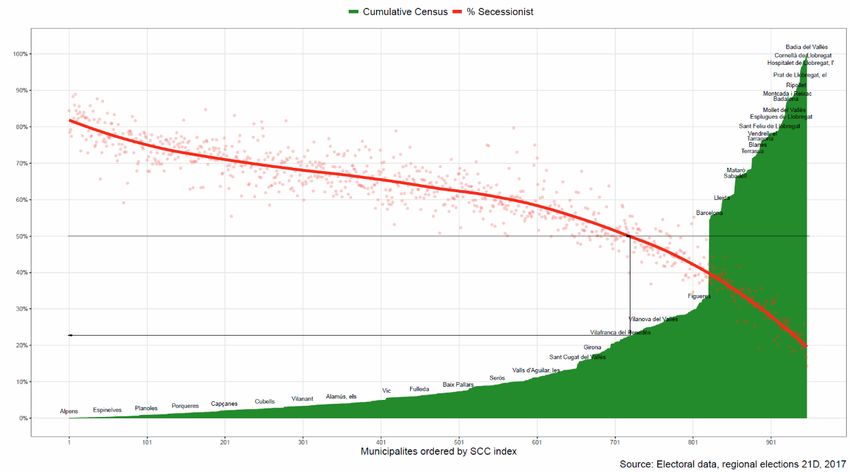
Genealogy 2020, 4, 19                                                                                 7 of 17

to whether the household net income was greater than, equal to, or less than 3000 €/month), using
time (from 2006) as a covariate and considering as a dependent variable the percentages of those who
self-identified as “only Catalan”, for the first analysis, “as Catalan as Spanish”, for the second one,
and “only Spanish” for the third one. Since the interactions between factors were highly significant,
to facilitate the analysis we built a new factor, group, with four levels, combining the two levels of
family/mother language factor and both levels of the factor net income plus. We used this factor to
replace the previously mentioned original binary factors at the final analysis.
      Notice that there were two sources of randomness: One corresponding to the sample procedure
and another corresponding to the political and communicative events throughout the period: We
used a linear model as a simple way to deal with both sources of variability, just as an approximation,
introducing time (in years, from 2006) to try to capture potential trends and checking the global
adequacy of this approach examining the standard output supplied by the function lm of R package
statistics. We supply also a graphic plot illustrating the dependence of each percentage (“only Catalan”
and “as Catalan as Spanish”), with respect to the time covariate, in each one of the four levels
determined by both factors.
      As a final remark, in most of the plots, we marked relevant historical events that might have
been crucial to understanding the evolution of the variables along the period. These events were: The
date when a new home rule was approved (New Statute 2006); the resolution of the Spanish High
Court (Tribunal Constitutional-TC) that sanctioned 14 articles (over 223) as contrary to the Spanish
constitution and restricted the preamble and another 27 articles (June 2010); the peak protests of the
social 15M movement (15M Peak Protests, June 2011); the regional elections of 25 November 2012
(25N); the illegal consultation about independence of 9 November 2014 (9N); the regional elections
of 27 September 2015, (27S); the illegal referendum about secession, 1 October 2017 (1 Oct) and the
regional elections 21 December 2017 (21D).
      We were fully aware of the limits and restrictions we adopted in our analyses of an obviously
multi-causal phenomenon. We limited ourselves to studying significant stochastic dependencies
between variables, a strictly statistical work (descriptive plus correlational), although it is true that, in
this context, high stochastic associations might suggest plausible explanations, of at least part of the
mechanisms that shaped the observed trends.

3. Results
     We started by geographically localizing the relevance of support for secession using the official
results of the last regional elections (21 December 2017), and adding the votes obtained by the three main
current secessionist parties: JxCat (right), ERC (left) and the CUP (far left). These regional elections
are the event where secessionist support is more clearly revealed, as majorities at the Autonomous
Parliament and the Government depend on them.
     As in Figure 1, when secession support at each municipality was greater than 50% of the electoral
census, they were indicated in red. The highest values were found at the smallest municipalities, while
they progressively dropped at the largest municipalities of Barcelona and Tarragona conurbations.
Barcelona city showed intermediate scores. The main trend is exemplified with the following two
results: Santa Cecília de Voltregà: Electoral census 163 citizens, secession support: 89.0%; Badía
del Vallés: Electoral census 10,560 citizens, secession support: 14.5%. Figure 2 presents an image
complementary to the previous one, showing percentages of support for unionist forces at each
municipality with different shades of green.
     The summary of the results for Figures 1 and 2 appears in Table 1 (from the electoral data of
21–12–2017, the last regional elections):
     Secessionists are majoritarian in three quarters of the territory, but less than 25% of the electoral
census live in those parts of the region, while in the remaining part, more than 75% of the census
is concentrated.
Genealogy 2020, 4, 19 8 of 17
We developed also an alternative method to visualize the differential distribution of the
pro-secession vote, presented in Figure 3. The municipalities are ordered in terms of an index,
developed from a factorial analysis obtained from electoral data in general and regional elections
throughout the period 2008–2012. This index, which shall be referred to hereafter as the unionism
index, measures the degree of support for unionist forces at each municipality, from low to high
degrees. The accumulated census and percentages of support for secessionist forces are represented
for each municipality. The percentage of secession support is represented through a smooth curve,
based on moving averages.
3.1. Longitudinal Changes of Household Net Incomes on the Main Family Language Segments
Based on Household net income levels among citizens with family/mother language Catalan and
those with family/mother language Spanish, we estimated the medians of household net incomes for
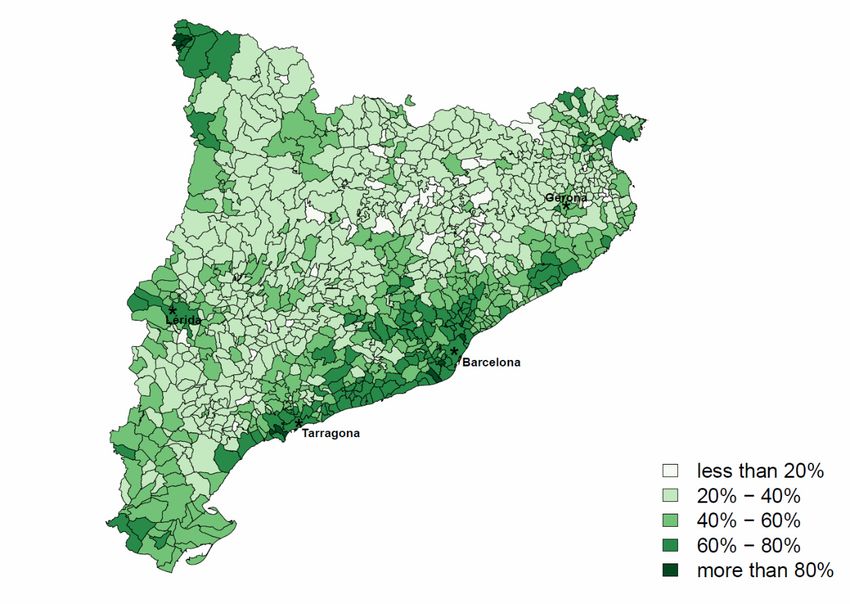
each linguistic segment throughout the period 2006–20194 . Citizens with family language Catalan
exhibited higher household incomes throughout the entire period compared with citizens with family
language Spanish. The trend line suggests that the economic crisis increased the magnitude of such
inequality
Genealogy (Figure
2020, 4, x FOR4).
PEER REVIEW 9 of 17
Figure 4. Evolution
Evolution of
ofmedian
medianestimates
estimates of
ofhousehold
household net
netincomes
incomesamong
among citizens
citizens with
withfamily/mother
family/mother
language Catalan
language Catalan vs. those with family/mother
those with family/mother language Spanish. Observe
Observe thethe differences between
groupsand
these groups andhow
howthey
they increase
increase along
along thethe economic
economic crisis.
crisis. Primary
Primary source:
source: CEO barometers
CEO barometers 2006–
2006–2019.
2019. FML: Family/mother
FML: Family/mother languagelanguage
(FML (FML Spanish:
Spanish: 56% of56% of Catalonian
Catalonian citizenry;
citizenry; FML Catalan:
FML Catalan: 36%;
36%; FML
FML both both Catalan
Catalan and and Spanish
Spanish 6%;6%; source:
source: EULP2018-Enquesta
EULP2018-Enquesta Usos
Usos lingüísticsde
lingüístics delala població,
població,
Institut Estadístic Catalunya; https://
https://www.idescat.cat/pub/?id=eulp).
www.idescat.cat/pub/?id=eulp).
Figure 55 displays
Figure displays the
the percentages
percentagesofof“Yes”
“Yes”inina a(hypothetical)
(hypothetical)referendum
referendum ofof
self-determination
self-determination in
population
in segments
population determined
segments determined by by
family/mother
family/mother language andand
language the the
binary variable
binary “household
variable “household net
incomes ≥3000 €/month” with two values “high” (greater than 3000 €/month) or
net incomes ≥3000 €/month” with two values “high” (greater than 3000 €/month) or “low” (lower“low” (lower than
than €/month).
3000 3000 The difference
€/month). between
The difference thesethese
between idiomatic segments
idiomatic was was
segments hugehuge
throughout the 2015–2019
throughout the 2015–
period.
2019 ThereThere
period. were were
also differences depending
also differences on income:
depending Wealthier
on income: respondents
Wealthier were more
respondents wereinmore
favour
in
favour of secession in both idiomatic segments. Finally, a slight tendency to increase support of
secession appeared among Spanish speaking citizens with lower incomes.
4 Until summer 2011 the survey question explicitly asked for ‘family language’, and after that for ‘childhood language in the
family’. This change resulted in a decrease in the percentage of people who answered ’both languages’ and an increase in
the Spanish-mother language segment, but it did not significantly affect other variables within the surveys immediately
before and after that change.Institut Estadístic Catalunya; https:// www.idescat.cat/pub/?id=eulp).
Figure 5 displays the percentages of “Yes” in a (hypothetical) referendum of self-determination
in population segments determined by family/mother language and the binary variable “household
net incomes
Genealogy ≥3000
2020, 4, 19 €/month” with two values “high” (greater than 3000 €/month) or “low” (lower 9 of 17
than 3000 €/month). The difference between these idiomatic segments was huge throughout the 2015–
2019 period. There were also differences depending on income: Wealthier respondents were more in
of secession
favour in both idiomatic
of secession segments.
in both idiomatic Finally, aFinally,
segments. slight tendency to increase
a slight tendency to support
increaseofsupport
secession
of
appeared among Spanish speaking citizens with lower incomes.
secession appeared among Spanish speaking citizens with lower incomes.
Covariation between
Figure 5. Covariation between household
household net
net incomes
incomes and family/mother language segments on
support for secession in aa (hypothetical)
(hypothetical) referendum
referendum of of self-determination. Attached to each label
self-determination. Attached
comes respondent percentages,
percentages, for
for each
each segment,
segment, at
at a July 2019 CEO survey; rests up to 100% were
DK/NA responses. 1M == oneone thousand
thousand euros/month.
euros/month. FML:
FML: Family/mother
Family/mother language.
language.
3.2. Longitudinal Variations on National Identity Feelings by Household Net Incomes and Family/Mother
Language Segments
To obtain a more detailed picture of the potential relevance of economic variables in influencing
the division between secessionism and unionism we analysed the evolution of “national identity”
feelings in the main two linguistic segments taking into account the variable “household net incomes ≥
3000 €/month”, with two values “high” (greater than 3000 €/months) or “low” (lower than 3000 €/month).
First, we directed focus (Figure 6) to the national identity “only Catalan” for Catalan speakers (as
defined by family/mother language) and for Spanish speakers (also defined by family/mother language).
In both idiomatic segments, wealthier strata moved towards an increase on the national identity
“only Catalan”, although the jump was much more substantial on the fraction that had Catalan as
family language. Observe the distance between the biggest group, family/mother language Spanish,
with household net income not greater than 3000 €/month, in green (38.2% of respondents, at that
survey), and the family/mother language Catalan group with household net income greater than
3000 €/month (7.2% of respondents, at that survey), in red. Notice also that trend lines overlap or
almost overlap at the beginning of the period and we may conjecture that Catalan subgroups (red and
purple) should have had similar figures in the recent past, around the start of the present century. The
sizes of the purple and orange subgroups were 20.7% and 6.7%, respectively, at the last survey.the division between secessionism and unionism we analysed the evolution of “national identity”
feelings in the main two linguistic segments taking into account the variable “household net incomes
≥ 3000 €/month”, with two values “high” (greater than 3000 €/months) or “low” (lower than 3000
€/month). First, we directed focus (Figure 6) to the national identity “only Catalan” for Catalan
speakers2020,
Genealogy (as4, defined
19 by family/mother language) and for Spanish speakers (also defined 10 ofby
17
family/mother language).
6. Evolution of “only Catalan” national identity depending on family/mother language and
Figure 6.
household net income (2006–2019). The size of this identification type went from 14.2% of the entire
Catalonian population
Catalonian populationininaaMarch
March2006
2006survey,
survey,
upup
to to 23.5%
23.5% in July
in July 2019.
2019. Attached
Attached to each
to each labellabel are
are size
size percentages,
percentages, for each
for each group,
group, at a CEO
at a July July CEO
2019 2019 survey.
survey. FML:FML: Family/mother
Family/mother language.
language.
These
In bothabrupt variations
idiomatic segments,on wealthier
the national identity
strata moved“only Catalan”
towards were on
an increase clearly dependent
the national on family
identity “only
language and on household
Catalan”, although the jump was net incomes
much more ≥3000 €/month.on
substantial Their
the respective
fraction that relevance
had Catalan was examined
as family
through
language. a standard
Observe analysis of covariance.
the distance between The dependent
the biggest variables
group, were percentages
family/mother language of “only
Spanish,Catalan”
with
national identity, considering a factor group (four levels), and time (year)
household net income not greater than 3000 €/month, in green (38.2% of respondents, at that survey), as a covariate, with an
adjusted
and the R-squared
family/mother of 0.95282
languagewithCatalan
a very significant
group with global p-value net
household < 2.2income −16
× 10 greater
. The group thanfactor
3000
and the interactions
€/month were highly
(7.2% of respondents, atsignificant
that survey), in red.comparing the slope of the regression lines, only those within family/mother language Spanish were
significantly different (p-value obtained by Tukey method were equal to 0.0003). The slopes of
household net incomes greater than 3000 €/month segments, comparing family/mother language
Catalan versus the corresponding Spanish were also different (p-values obtained by Tukey method,
equal to 2020,
Genealogy 0.009). Other results from this analysis were also obtained and can be supplied by the authors
4, 19 11 of 17
to interested readers on demand.
Figure 7.7. Evolution
Evolutionofof
“as“as Catalan
Catalan as Spanish”
as Spanish” national
national identityidentity depending
depending on family/mother
on family/mother language
language and household
and household net incomenet income (2006–2019).
(2006–2019). The size ofThe
thissize of this identification
identification type went
type went from 42.5%from 42.5%
at a March
at a March
2006 survey,2006 survey,
to 39.2% to 39.2%
in July in July 2019.
2019. Attached Attached
to each to each
label are label are size
size percentages, forpercentages,
each group, for
at aeach
July
group, at asurvey.
CEO 2019 July CEO
FML:2019 survey. FML:language.
Family/mother Family/mother language.
The same
sameanalysis
analysisofof covariance
covariance waswasfinally applied
finally to thetopercentages
applied of “onlyofSpanish”
the percentages national
“only Spanish”
identity as dependent variable (Figure 8), with the same factor group and time as
national identity as dependent variable (Figure 8), with the same factor group and time as covariates, covariates, as before,
with an adjusted
as before, with anR-squared of 0.7906, aofworse
adjusted R-squared 0.7906,model fit than
a worse modelthe fit
previous
than the cases, but still
previous withbut
cases, a very
still
significant global p-valueGenealogy 2020, 4, x FOR PEER REVIEW 12 of 17
significant.
Genealogy 2020,Again,
other standard results for this analysis were obtained and can be supplied by
4, 19 12 ofthe
17
authors to interested readers on demand.
Figure 8. Evolution
Evolution of
of “only
“only Spanish”
Spanish” national
national identity
identity depending
depending on family
family language
language and Household
Household
net income (2006–2019). The size of this identification was pretty stable across the whole period, with
levels between 6% and 7%. Attached
Attached to
to each
each label
label re size percentages, for each group, at a July 2019
survey. FML: Family/mother language.
survey. language.
To complete
3.3. Other Economic theMeasures
analysis, we considered both dependent variables simultaneously (MANCOVA),
obtaining that group factor, the covariate Time and the interactions were highly significant. Again,
Finally, we compared the degree of secession support among different groups obtained
other standard results for this analysis were obtained and can be supplied by the authors to interested
considering their reported economic resistance limits (in months), in case of an economic breakdown
readers on demand.
(Figure 9). Results showed that secessionism significantly increased with higher economic resistance
and Other
3.3. endurance: People
Economic with higher financial resources were much more in favour of secession. A
Measures
very similar trend appeared when the measure was perception of the own economy during last year.
When Finally, we compared
that perception the degree
improved, of secession
support support among
for secession different
was higher as groups obtained
well. In considering
all, these findings
their
consistently indicated that the recent secessionist wave in Catalonia has been sustained(Figure
reported economic resistance limits (in months), in case of an economic breakdown 9).
by those
Results showed that
society segments that enjoy
secessionism significantly
better economic increased
resources with well-being.
and higher higher economic resistance and
endurance: People with higher financial resources were much more in favour of secession. A
very similar trend appeared when the measure was perception of the own economy during last year.
When that perception improved, support for secession was higher as well. In all, these findings
consistently indicated that the recent secessionist wave in Catalonia has been sustained by those society
segments that enjoy better economic resources and higher well-being.Genealogy 2020, 4, 19 13 of 17
Genealogy 2020, 4, x FOR PEER REVIEW 13 of 17
Figure 9. Support for secession and Economic wellbeing. Left: Secession was much more popular
Figure 9. Support for secession and Economic wellbeing. Left: Secession was much more popular
among those with higher economic resistance limits (in months), in case of an economic breakdown.
among those with higher economic resistance limits (in months), in case of an economic breakdown.
Percentages are means from CEO barometers 2016–2017. Right: It was also more popular among those
Percentages are means from CEO barometers 2016–2017. Right: It was also more popular among those
with a good perception of the evolution of their economies during the last year. Percentages derived
with a good perception of the evolution of their economies during the last year. Percentages derived
from CEO barometer July 2019.
from CEO barometer July 2019.
4. Discussion
4. Discussion
The present study adds important findings to the recent longitudinal description of crucial vectors
The present
characterizing thestudy
division adds important findings
of Catalonian society intoto thetworecent longitudinal
confronted description
communities, of crucial
unionists and
vectors characterizing the division of Catalonian society into two confronted
secessionists, through the eruption of an unexpected and mostly not yet fully explained secession crisis communities, unionists
and secessionists,
within through the
a rich and advanced eruption
region of an unexpected
of Southern Europe (Ollerand etmostly not yet
al. 2019a, fully explained secession
2019b).
crisisFigures
within 1a and
rich 2andofferadvanced
a usefulregion of Southern
complement to ourEurope (Oller et al. 2019a,
main longitudinal portrait 2019b).
by showing maps
Figures 1 and 2 offer a useful complement to our main
of the geographical distribution of support to secessionist and unionist forces usinglongitudinal portrait byrecent
showing maps
electoral
of the geographical
results. They displaydistribution
that heavilyofpopulated
support tocoastal
secessionist and
areas of unionistwere
Catalonia forcesless
using recent electoral
enthusiastic about
results. They display that heavily populated coastal areas of Catalonia were
secession. This was also reflected on the score (y-axis value) of the unionism index (Figure 3), where less enthusiastic about
secession. This was also reflected on the score (y-axis value) of the unionism
large municipalities correspond mainly to towns situated on the coastal conurbations of the region. index (Figure 3), where
large municipalities
These big conurbations correspond mainlyproportions
have the highest to towns situated on the
of citizens fromcoastal
migrantconurbations
origins, either of the
fromregion.
other
These big conurbations have the highest proportions of citizens from
Spanish regions or from abroad (Barceló 2014; Guntermann et al. 2018; Hierro 2015; Lepic 2017; OEC migrant origins, either from
other Spanish
Group regions
2017; Rodon and orGuinjoan
from abroad (Barceló 2014; Guntermann et al. 2018; Hierro 2015; Lepic 2017;
2018).
OECThe Group 2017; Rodon
economic findings and Guinjoan
presented 2018).
here offer a systematic scenario. Figure 4 shows that there was a
The economic findings presented
persistent difference of family incomes between here offerthe
a systematic scenario. Figure
two main segments 4 showscitizenry,
of Catalonian that there was
those
a persistent
whose familydifference
language of family incomes
is Catalan vs. thosebetween
whose familythe two main segments
language is Spanish;oftheCatalonian citizenry,
former enjoying a
those whose family language is Catalan vs. those whose family language
higher median income across all the period. The income of both groups fluctuated with the development is Spanish; the former
enjoying
of a higher
the lengthy median income
repercussions of theacross all the period.
2008 financial crises,The
but income of both
the distance of groups
incomesfluctuated
between bothwith
the development
groups persisted andof theevenlengthy
tended repercussions of the 2008 the
to increase throughout financial
period. crises, but5 the
Figure showsdistance of incomes
the evolution of
between both groups persisted and even tended to increase throughout the
percentages of support for secession in a (hypothetical) referendum of self-determination differentiating period. Figure 5 shows
the levels
two evolution of percentages
of income (above andof support
below for secession
3000 euros) in a (hypothetical)
and combining referendumlanguage
that with family/mother of self-
determination Catalan
segmentation, differentiating two levels
vs. Spanish. Theofgraph
income (above and
illustrates that,below 3000 euros)
regardless of theirandlevel
combining that
of income,
with family/mother language segmentation, Catalan vs. Spanish.
citizenry with family/mother language Catalan gave substantially more support to secession than the The graph illustrates that,
regardless of their level of income, citizenry with family/mother language Catalan gave substantially
more support to secession than the Spanish language segment. The difference was so large that itGenealogy 2020, 4, 19 14 of 17
Spanish language segment. The difference was so large that it appears to reveal that the sharp division
on the preference for secession depends mainly on an ethnolinguistic cleavage.
Results displayed at Figures 6–8 present longitudinal analyses of variations on different national
identity feelings throughout the whole period 2006–2019. Figure 6 focuses on the evolution of national
identity feeling “only Catalan” differentiating between the abovementioned two levels of income. The
escalation of the identity feeling “only Catalan” was maximum for the wealthier segment of those
with family/mother language Catalan. At the start of the period, however, there were no distinctions
on that restrictive national identity within such a Catalan speaking citizenry segment. For citizens
with family/mother language Spanish, there was also a very slight trend of increasing “only Catalan”
identity, and again the wealthier ones taking the same lead, though a bit later. Figure 7 displays
the evolution of differences on the national identity “as Catalan as Spanish” using the same type of
segmentations. There was an erosion of this dual identity on both citizenry idiomatic segments, with
the erosion being higher for the wealthier subgroups. To be noted is that, for the wealthier pertaining
to the family/mother language Spanish group, the erosion of this dual identity was more intense,
whereas the poorer remained more stable. Figure 8 displays the variations on national identity “only
Spanish” within both citizenry lingustic segments differentiating again for levels of income, though
these were very thin strata (low percentages) within the population. For the family/mother language
Catalan fraction there was no variation at all, as percentages of that identity for this citizenry segment
were close to zero. The family/mother language Spanish segment presented large fluctuations which
were likely due to the very small sizes.
Finally, Figure 9 introduced two subjective measures of economic resistance/endurance and
perception of current personal economic situation. Two findings were relevant: One, that the
intensity of support for secession varied significantly with these measures (the degree of secession
support aligning positively and strikingly with both measures); and, second, support for secession
attained maximums when economic resistance was stronger and economic perception was clearly
optimistic. In all, these results cohere with previous (partial) findings reported by other authors on the
relation between secession support and economic wellbeing (Llaneras 2017; Coll et al. 2018; Piketty
2019) and extend their relevance by showing consistent differences across the whole period of the
secessionist campaign. They also unveiled suggestive co-variations between the main ethno-linguistic
cleavage at the region and economic segmentations, but gave more relevance to the idiomatic than to
economic distinctions.
Before the dawn of the secessionist surge, (Boylan 2015) had already shown using CEO surveys
2011–2013, that national identity (being Catalan native or assimilated) was a much better predictor
of desire for secession, than perceived grievances coming from an unfair fiscal treatment or other
economic–political factors. Cohering with that, (Miley 2007) established the operation of divergent
modes of national identification across the main segments of Catalonian society that rested on an
ethno-cultural gap. Departing from CIS5 surveys and other social data, he challenged the depiction of
Catalonian nationalism as a form of “civic nationalism”. He described a cleavage that distinguished
the self-identification of two citizenry segments: “Native, Catalan speaking” citizens and their
Spanish-speaking neighbours with immigrant origins from other regions of Spain. “Mother tongue”
had, in fact, the strongest impact upon identity feelings as predominantly Catalan vs. mostly Spanish
or mixed “CatSpanish”. In subsequent studies, (Miley 2013) showed that there was also a gap between
political preferences of these citizenry segments and those implemented by their representatives
in the Regional Parliament: Language and education policies, particularly, were inconsistent with
preferences of Spanish-speaking citizens. He identified, moreover, two mechanisms that blocked their
representation in the region’s institutions: (1) A clear under-representation of those citizens within
Parliament; and (2) a partial assimilation of some Spanish-speaking politicians into the attitudes of
5 CIS (Centro de Investigaciones Sociológicas, http://www.cis.es/cis/opencms/ES/index.html).Genealogy 2020, 4, 19 15 of 17
Catalan-speaking rulers. He concluded that the social bases of support for Catalan nationalism were
“overwhelmingly ethnic” and that the movement was an elite-led, “top down” project.
The present findings add likelihood to that depiction, since we were able to show that
ethno-linguistic distinctions were more powerful than economic segmentations in describing variations
on both national identity feelings and polarized profiles on the issue of secession, across the entire
period of the secessionist campaign. In previous though partial and transversal studies, (Barceló 2014)
had already shown that idiomatic and neighbourhood contexts were crucial to keeping distinctive
national identity boundaries in Catalonia, and (Hierro 2015) showed that both parents’ identities and
neighbourhood composition were able to counteract the effects of compulsory schooling, mainly or
exclusively in Catalan language, at inducing changes in national identities in Catalonia.
The author (Piketty 2019) recently discussed data on Catalonian economic segmentations in
relation to preferences in favour of, or against secession, which are also fully coincident with the present
longitudinal findings. After contrasting findings obtained from different rent strata or educational
levels, he concluded that Catalonian claims for secession should be conceived as a form of “fiscal
egoism” born within a rich European region. A phenomenon, by the way, that he and others suggest
might appear as well on a variety of segregation tensions that have erupted in other countries, within
the European Union (Bourne 2014; Griffiths et al. 2015; Muro and Vlaskamp 2016; Miley and Garvía
2019; Piketty 2019).
5. Conclusions
To recapitulate, our findings show that the more privileged segments of Catalonian citizenry
were those that supported secession more consistently, using different economic measures. They
also show that these segments abruptly aligned their national identity towards the exclusive feeling
“only Catalan”, with high intensity and departing from recognizable points during the secessionist
push. That trend was particularly important in the citizenry fraction that uses Catalan as their family
language. On the other hand, poorer, fragile, and less protected Catalonian citizenry (using Spanish,
mainly, as their family language) was mostly against secession. They presented also less polarized
profiles or abrupt variations on national identity measures. All the data points to the conclusion that the
Catalonian secessionist challenge was, in fact, a rebellion of the rich, well-situated, and predominantly
well-protected people.
Author Contributions: Conceptualization, J.M.O., A.S. and A.T.; methodology, J.M.O., A.S. and A.T.; software,
J.M.O. and A.S.; validation, J.M.O. and A.S.; formal analysis, J.M.O. and A.S.; investigation, J.M.O., A.S. and A.T.;
resources, J.M.O., A.S. and A.T.; data curation, J.M.O. and A.S.; writing—original draft preparation, A.T. and
J.O.; writing—review and editing, A.T.; visualization, J.M.O.; funding acquisition A.T. All authors have read and
agreed to the published version of the manuscript.
Funding: This research was partially funded by AFOSR-MINERVA FA9550-18-0496 Grant and Bial Foundation
Grant 163/14, to sustain AT work.
Conflicts of Interest: The authors declare that they have no conflicts of interest.
Ethical Statements: The data for this research came from the CEO barometers, the official survey agency of
the Regional Government. Full legal Spanish requirements and restrictions to conduct studies about voting
and political opinion were complied, in accordance also with ESOMAR Int. Code on Market, Opinion and
Social Research and Data Analytics. All the statistical analyses fulfilled conditions established by the Ethical
Commissions of the University of Barcelona, Pompeu Fabra University and the Autonomous University of
Barcelona for treatment of human data, when their source are surveys made by official agencies or private firms
under specific external regulations with due guarantees. An ethics approval was not required for this secondary
analysis of the data, as per the authors’ Institutions and national regulations.
Data Availability: As already stated the primary data is public and easily accesible at CEO web (Centre d’Estudis
d’Opinió, http://ceo.gencat.cat/). In addition to the data provided here, many other analytical and graphic results
were obtained for the period 2006–2019. In particular, all series of mosaic plots derived by crossing different pairs
of variables. All of them can be supplied by the authors to interested readers on demand.You can also read