Financial Stability Risks and Policy Options - europa.eu
←
→
Page content transcription
If your browser does not render page correctly, please read the page content below

IN-DEPTH ANALYSIS
Requested by the ECON committee
Monetary Dialogue Papers, February 2020

                  Financial Stability
                   Risks and Policy
                       Options

          Policy Department for Economic, Scientific and Quality of Life Policies
                        Directorate-General for Internal Policies
               Authors: Christophe BLOT, Jérôme CREEL and Paul HUBERT               EN
                               PE 642.374 - January 2020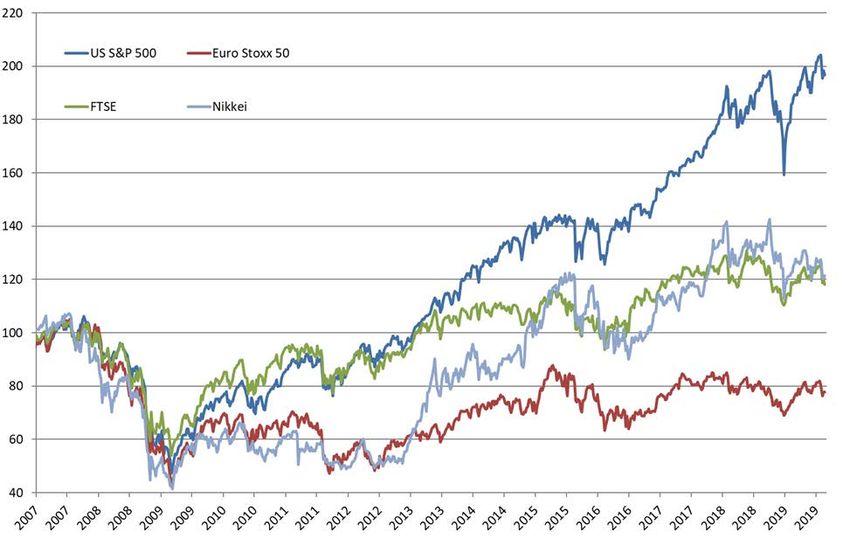
Financial Stability
   Risks and Policy
       Options
     Monetary Dialogue Papers,
          February 2020

Abstract
We pay special attention to the different types of financial risk
discussed in the public debate: equity, housing, corporate debt,
public debt sustainability, and banks and insurance companies’
profits. Our assessment does not point to significant risks in the
euro area even if attention should be drawn on some local or
specific market segments. Even if monetary policy may not be
the most appropriate tool to dampen these risks, the ECB has still
some policy options to respond to an economic slowdown.
This document was provided by Policy Department A at the
request of the Committee on Economic and Monetary Affairs.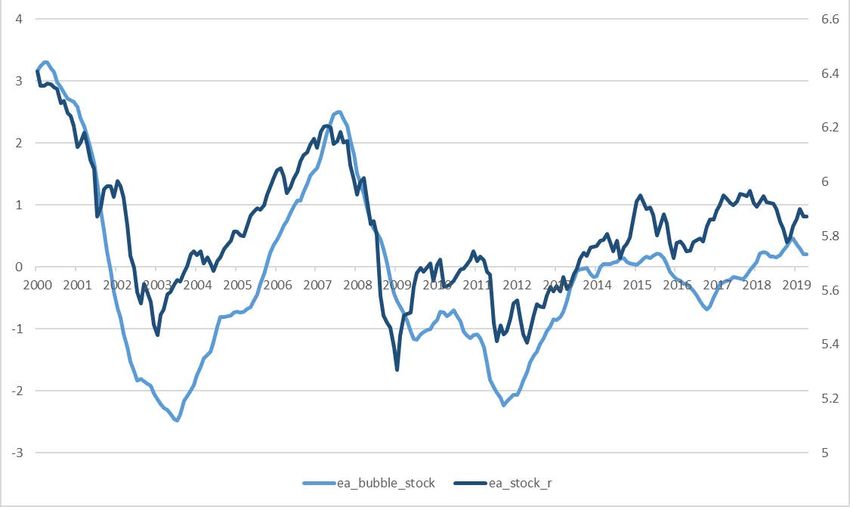
This document was requested by the European Parliament's Committee on Economic and Monetary
Affairs.

AUTHORS
Christophe BLOT, Sciences Po – OFCE & Université Paris Nanterre
Jérôme CREEL, Sciences Po – OFCE & ESCP
Paul HUBERT, Sciences Po – OFCE

ADMINISTRATOR RESPONSIBLE
Drazen RAKIC

EDITORIAL ASSISTANT
Janetta CUJKOVA

LINGUISTIC VERSIONS
Original: EN

ABOUT THE EDITOR
Policy departments provide in-house and external expertise to support EP committees and other
parliamentary bodies in shaping legislation and exercising democratic scrutiny over EU internal
policies.

To contact the Policy Department or to subscribe for updates, please write to:
Policy Department for Economic, Scientific and Quality of Life Policies
European Parliament
L-2929 - Luxembourg
Email: Poldep-Economy-Science@ep.europa.eu

Manuscript completed: January 2020
Date of publication: January 2020
© European Union, 2020

This document was prepared for the February 2020 Monetary Dialogue between the ECON Committee
and the ECB President. It is available on the internet, also as part of a compilation, at:
https://www.europarl.europa.eu/committees/en/econ/monetary-dialogue.html

DISCLAIMER AND COPYRIGHT
The opinions expressed in this document are the sole responsibility of the authors and do not
necessarily represent the official position of the European Parliament.
Reproduction and translation for non-commercial purposes are authorised, provided the source is
acknowledged and the European Parliament is given prior notice and sent a copy.
For citation purposes, the study should be referenced as: Blot, C., Creel, J., Hubert, P., Financial stability
risks and policy options, Study for the Committee on Economic and Monetary Affairs, Policy Department
for Economic, Scientific and Quality of Life Policies, European Parliament, Luxembourg, 2020.
Financial Stability Risks and Policy Options

CONTENTS
LIST OF ABBREVIATIONS                                                                        4
LIST OF FIGURES                                                                              5
LIST OF TABLES                                                                               5
EXECUTIVE SUMMARY                                                                            6
   INTRODUCTION                                                                              7
   FINANCIAL STABILITY RISK DIAGNOSIS                                                        8
   2.1. Equity market                                                                        8
   2.2. Corporate bond market                                                                9
   2.3. Housing market                                                                      10
   2.4. Bank profitability                                                                  13
   2.5. Public debt sustainability                                                          15
   THE EFFECT OF MONETARY POLICY ON ASSET PRICES                                           18
   POLICY OPTIONS IN CASE OF A RECESSION                                                   20
   4.1. QE for corporates                                                                   20
   4.2. QE to households                                                                    20
   4.3. Macroprudential policies                                                            20
   4.4. Public investment                                                                   21
REFERENCES                                                                                 22
ANNEX                                                                                      25

                                        3                                          PE 642.374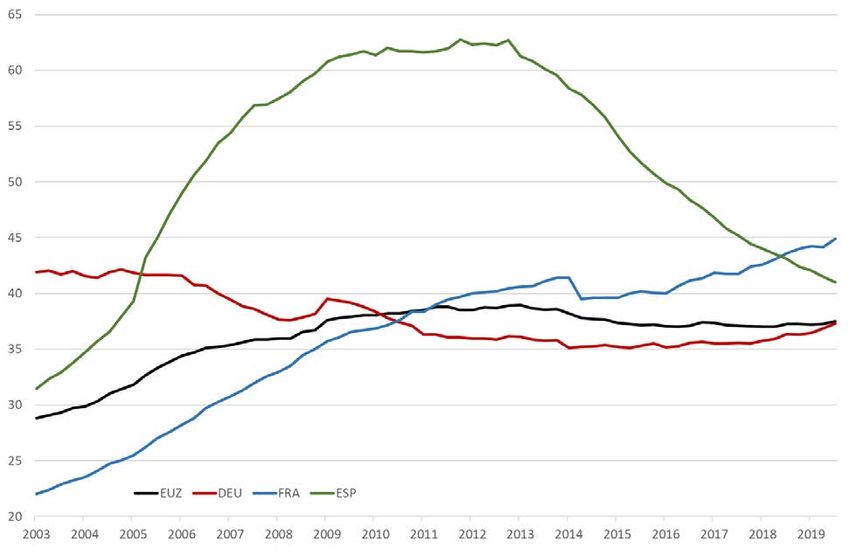
IPOL | Policy Department for Economic, Scientific and Quality of Life Policies

LIST OF ABBREVIATIONS
 ABSPP              Asset-Backed Securities Purchase Programme

 CBPP               Covered Bond Purchase Programme

 ECB                European Central Bank

 ELB                Effective Lower Bound

 FRFA               Fixed Rate Full Allotment

 HICP               Harmonised Index of Consumer Prices

 LTRO               Long Term Refinancing Operations

 MRO                Main Refinancing Operations

 OMT                Outright Monetary Transactions

 PCA                Principal Component Analysis

 SMP                Securities Market Programme

 TLTRO              Targeted Long Term Refinancing Operations

 VLTRO              Very Long Term Refinancing Operations

 ZLB                Zero Lower Bound

PE 642.374                                             4
Financial Stability Risks and Policy Options

LIST OF FIGURES
Figure 1:    Euro area stock price indices                                                                8
Figure 2:    Euro area stock price imbalances                                                             9
Figure 3:    Total debt of non-financial corporations                                                    10
Figure 4:    House price dynamics (deflated by CPI)                                                      11
Figure 5:    Outstanding amount of credits for house purchase                                            13
Figure 6:    Euro area banks’ profits                                                                    14
Figure 7:    German banks’ profits                                                                       14
Figure 8:    Turnover and profits of major euro area insurance companies                                 15
Figure 9:    Public debt dynamics under different shocks                                                 16
Figure 10:   Asset price imbalances                                                                      18
Figure 11:   Non-linear responses of asset price imbalances to monetary surprises                        19

LIST OF TABLES
Table 1:     Synchronicity of house price cycles                                                         12

                                                   5                                            PE 642.374
IPOL | Policy Department for Economic, Scientific and Quality of Life Policies

EXECUTIVE SUMMARY
•   It is crucial to monitor financial risks regularly and to account for the multiple sources of these
    risks.
•   The valuation level of equity markets in the euro area is still 20 % below its peak of 2007.
    Comparatively, the US Standard and Poors’ index is twice its value of 2007.
•   Risks have emerged for corporate debt and notably leveraged loans, which share some
    similarities with the subprime market. However, securitisation of these loans is less important
    than it was for subprime loans. These markets also differ in terms of the underlying nature of risk.
•   House prices in the euro area are synchronised and risks remain moderate except in Germany
    where house price have sharply risen and are disconnected from house price cycles in other
    countries. However, credit dynamics in Germany remain subdued.
•   The argument that banks’ profitability is negatively affected by low interest rates is often made.
    Yet, banks’ and insurance companies' profits are steady and are recovering since 2012.
•   Although monetary policy is expected to influence asset prices, there is evidence that central
    banks may affect stock price imbalances but no evidence that they could do so for housing
    markets.
•   Policy options in case of a recession range from an extension of QE towards corporates and
    households – to support investment and consumption – the use of macroprudential tools – to
    mitigate the effect of financial risks – and fiscal policy notably in an environment characterised by
    low interest rates.

PE 642.374                                             6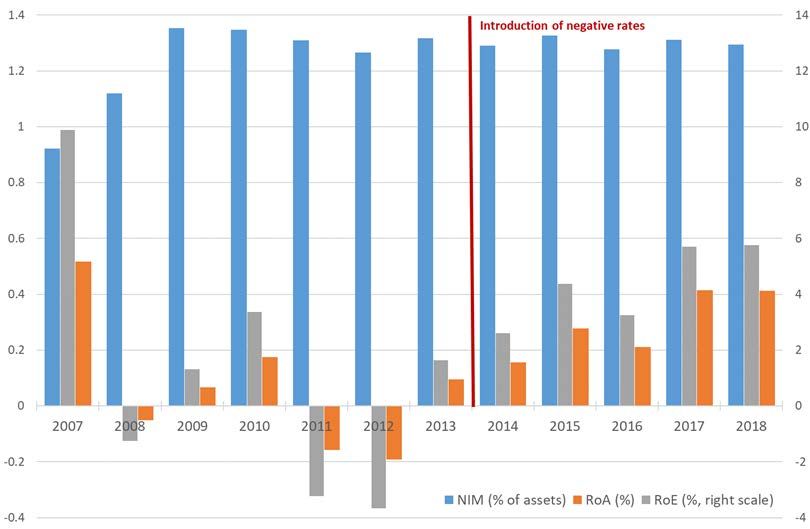
Financial Stability Risks and Policy Options

        INTRODUCTION
The dramatic consequences of the global financial crisis have renewed the interest in the financial cycle
and the financial risk. It is now crucial to monitor financial risks regularly and to account for the multiple
sources of these risks. The subprime crisis has highlighted the role of the housing market and its close
connection to household debt. A few years ago, risk stemmed from equity markets and the burst of the
dotcom bubble had triggered a significant slowdown – but not a recession – of the world economy.
Besides, finance inevitably entails risk and institutions in charge of surveillance – central banks or
financial regulators – must not only be able to evaluate and monitor the global level of risks but also
be able to identify who is bearing the risk. A fine diagnosis of financial risks is also crucial for monetary,
fiscal and financial policy. Financial stability has become a major policy objective and all relevant tools
must be employed in order to reduce risks once they are identified. Regarding preventive actions, the
role of monetary policy remains disputed and it is not clear that central banks should set the policy
instruments – the short term interest rate and assets purchases – in order to account for financial
stability. 1 Besides, the euro area may still be characterised by heterogeneities such that the common
monetary policy may not be the most appropriate tool to deal with financial risks.
Ten years after the crisis, the euro area has not fully recovered and even if the unemployment rate has
now reached its pre-crisis level, it is still high in some countries and estimates of the output gap still
point to a global economic slack in the euro area as a whole. A new financial crisis would inevitably
delay the ongoing recovery and in the worst case scenario trigger a new recession. Consequently,
beyond preventive actions, monetary and fiscal space is needed to stabilise the economy in case of a
negative shock. However, with the policy rate at the zero lower bound and with public debt at a higher
level, it is crucial to assess whether there is still monetary and fiscal space.
In this Monetary Dialogue paper, we document the current financial risks in the euro area by
investigating the equity, the housing and the debt markets (corporate and public debt). Banks’
situation is also analysed not only because they play a crucial role in the issuance and propagation of
risks. The role of the ECB is assessed through its ability to reduce risks and to make monetary policy
more expansionary if the euro area suffers from a downturn. With interest rates at the zero lower
bound, is the ECB able to further resort to unconventional measures?

1   See Smets (2013) for a survey.

                                                     7                                              PE 642.374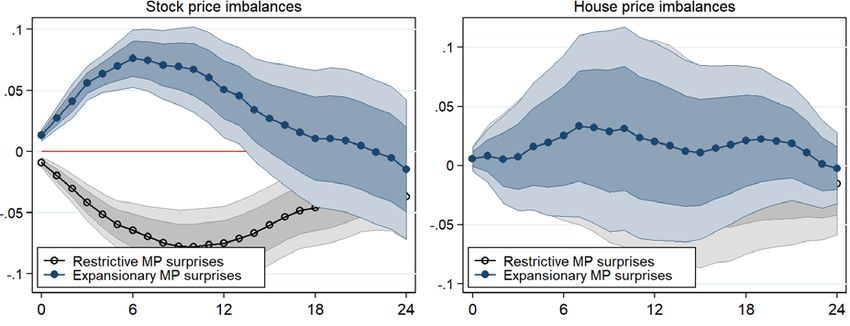
IPOL | Policy Department for Economic, Scientific and Quality of Life Policies

       FINANCIAL STABILITY RISK DIAGNOSIS
In a challenging internal and global environment with downside risks to economic growth, asset
valuation corrections in some euro area countries or in some markets may pose threats to financial
stability. These threats are discussed in the following.

2.1.      Equity market
Stock price developments over the last decade show at least three interesting features (Figure 1). First,
the valuation level achieved before the global financial crisis has been exceeded everywhere except in
Europe. Actually, the Euro Stoxx 50 is still 20 % below its peak in 2007. Second, the US Standard and
Poors’ index is twice its value of 2007, which is substantial in comparison with other advanced
countries. Third, at first sight, the evolutions of the Euro Stoxx 50 and the UK FTSE are pretty much
connected.

Figure 1:         Euro area stock price indices

Source: Eikon Thomson Reuters. 2007 = 100.

Monetary policy stimulus could threaten financial stability by inflating asset price bubbles. Borio and
Zabai (2016), for example, argue that the benefits of unconventional monetary policies diminish while
the risks of financial instability worsen. They echo the criticisms made by Taylor (2009) concerning the
Federal Reserve's low rate policy between 2001 and 2004 which would have fueled the boom in the
real estate market and subsequently triggered the subprime crisis. With negative policy rates and asset
purchases, most sovereign yields are negative in the euro area. Financial investors are looking for
higher returns and are driving up stock and housing prices. However, share and housing prices remain
well below the peak observed in 2007. Drawing on the method by Blot et al. (2018) shows no sign of
strong imbalances in the prices of assets in the euro area (Figure 2). There may well be local imbalances,
e.g. in the German housing market, but it cannot be argued that this feature is under the sole
responsibility of the ECB monetary policy if other markets do not show similar signs of imbalances.

PE 642.374                                             8
Financial Stability Risks and Policy Options
Figure 2: Euro area stock price imbalances
Source: Authors computations, see Blot, et al. (2018). Note: the y-axis corresponds to standard deviations of the difference
between asset prices and their reference value. ‘Stock_r’ means the deflated price of stocks while ‘bubble_stock’ accounts for
the stock price imbalances.
2.2. Corporate bond market
Whereas household debt has decreased after the global financial crisis, international institutions have
now drawn their attention on corporate debt and especially on leveraged loans. According to the
International Monetary Fund (IMF), this segment of the market is characterized by ‘loans, usually
arranged by a syndicate of banks, to companies that are heavily indebted or have weak credit ratings’
and would be the current major source of risk for the financial system. 2 To some extent, leveraged
loans share similarities with the subprime market, which was at the origin of 2008 crisis. First, it entails
loans to lower quality debtors. Second, those loans have also been securitised and integrated in
structured assets such as CLOs (collateralized loan obligations).
In the euro area, debt issued by non-financial corporations is still below the 2007 level (62 % of GDP in
2019 Q2 according to the Banque de France against 65 % in 2009 Q2). But this may hide important
differences across countries since corporate debt has strongly decreased in Spain whereas it has
steadily increased in France (Figure 3). Actually, risks may not stem mainly from European firms but
rather from US corporate debt, which has increased from 40 % of GDP in 2011 to 47 % in 2019, a level
which is less than half of the household debt. 3 More than the aggregate level of debt, it is the
composition of this US corporate debt that has raised some concerns as the outstanding amount of
those leveraged loans was estimated between 1 800 and 2 300 billion dollars. Though it would be much
lower in Europe, the risk should not be minimised as those loans have been securitised and may
therefore be held by European banks. As for the subprime crisis, the outburst of the crisis may be
related to a macroeconomic risk in the US but then be propagated in the whole financial system.
2 See https://blogs.imf.org/2018/11/15/sounding-the-alarm-on-leveraged-lending/.
3 In 2019 Q2, the total debt of US households amounts to 101,5 % of GDP, 21 points below the peak reached in 2009 Q3.
9 PE 642.374IPOL | Policy Department for Economic, Scientific and Quality of Life Policies Figure 3: Total debt of non-financial corporations Source: Banque de France. Note: y-axis in % of GDP. However, though it is important to monitor the source of risks in the financial system and to send warning signals to lead financial regulators to increase protection, there remain important differences compared to the pre-crisis period. According to the Banque de France, there is less securitisation of leveraged loans today : ’one third of leveraged loans are reportedly securitised, compared with 80% of subprime loans in 2007’ representing 5.5 % of the US GDP in 2019 against 8 % of GDP for the subprime loans in 2006. 4 Besides, the nature of the underlying risk is not located on a single market (the housing market) but related to the macroeconomic risk. The rise in the default rate on corporate debt is related to the risk of downturn in the United States. Finally, collateral provided by firms that would be insolvent is also different as firms’ assets are more diversified than households’ assets. 2.3. Housing market The 2007-2008 financial crisis has been notably triggered by imbalances in several housing markets and credit booms that have gone bust as labelled by Schularick and Taylor (2012). Literature on financial instability and financial crises have highlighted that recessions, which are preceded by a housing bubble and a credit boom are longer and deeper. 5 It is therefore of crucial importance to monitor the dynamics of housing prices and of mortgage credits. Since 2014, real house prices have grown by 2.1 % on average in the euro area as a whole (Figure 4), much less than the average yearly growth rate observed from 1999 to 2007. House prices have strongly recovered since the end of 2013, but are still lower than in 2007 Q3, the highest point observed since 1999. 6 4 See https://blocnotesdeleco.banque-france.fr/billet-de-blog/faut-il-avoir-peur-des-leveraged-loans-aux-etats-unis and OFCE (2019). 5 See Claessens et al. (2009) and Jorda et al. (2013). 6 The nominal value of house prices is yet 12 % higher than in 2008Q2. PE 642.374 10
Financial Stability Risks and Policy Options
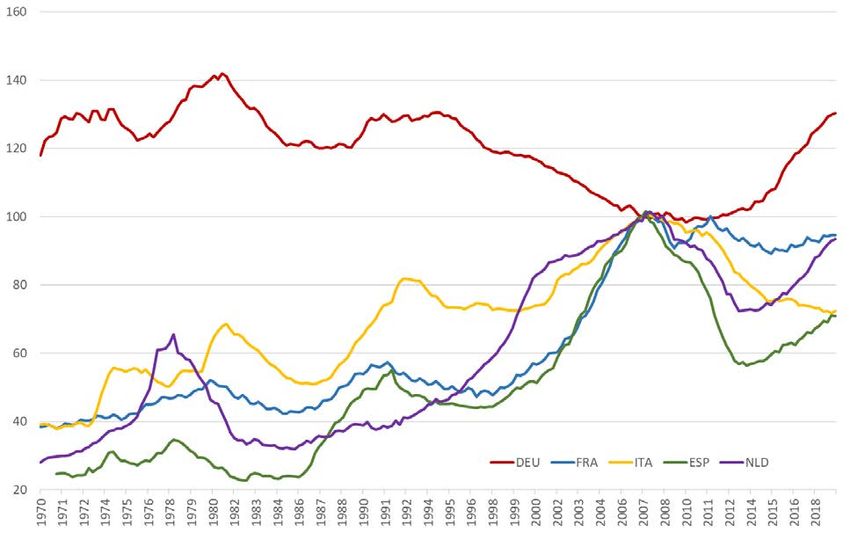
Besides, it seems that house prices in the 5 biggest euro area countries are essentially driven by
idiosyncratic dynamics rather than by a common factor. Whereas prices are increasing rapidly (4.1 %
on average) in Germany, they are still declining in Italy and are stable in France. The German housing
market seems notably strongly disconnected from other housing markets. Prices have decreased for
almost 25 years (Figure A in appendix) and notably during the years 2000 whereas there was a boom
in Italy, France, Spain and in the Netherlands.
Figure 4: House price dynamics (deflated by CPI)
Source: BIS (Property price database). Note: y-axis in %.
A simple statistical analysis highlights the lack of synchronicity of housing markets in the euro area. To
that end, we follow Meller and Metiu (2017) and first estimate the housing price cycle using the
Christiano-Fitzgerald statistical filter and then assess whether expansionary and contractionary phases
coincide between 8 EMU countries for which data are provided by the Bank for International
Settlements (BIS) at least since 1971. 7 We consider an expansionary phase (respectively contractionary)
on the housing market when the price is above (respectively below) the trend. For each date (t), cycles
are synchronized if country (i) and country (j) are in the same phase, whether expansionary or
contractionary. A synchronicity index is calculated as the ratio of the number of periods when cycles
are synchronised over the total number of periods. When the value of the ratio is below 0.5, it indicates
that cycles are not synchronised for more than 50 % of time. Table 1 illustrates the synchronicity of
house price cycles in the euro area and suggests that the German house price cycle is relatively
7 The parameters of the filter are set such as to include medium-term cycles with frequency within the 45 and 120 months.
11 PE 642.374IPOL | Policy Department for Economic, Scientific and Quality of Life Policies
disconnected from other cycles. 8 It coincides with the cycle in the Netherlands for 62 % of periods.
Conversely, the French, Italian and Spanish cycles are more synchronised.
Table 1: Synchronicity of house price cycles
DEU FRA ITA ESP NLD BEL FIN IRL
DEU 1.00
FRA 0.38 1.00
ITA 0.49 0.87 1.00
ESP 0.45 0.84 0.77 1.00
NLD 0.62 0.64 0.69 0.68 1.00
BEL 0.52 0.85 0.97 0.80 0.70 1.00
FIN 0.23 0.56 0.46 0.64 0.45 0.48 1.00
IRL 0.54 0.63 0.66 0.60 0.88 0.65 0.43 1.00
Sources: BIS (Property price database) and authors calculations.
These figures suggest that house prices in the euro area are strongly driven by domestic dynamics,
which may raise more challenges for the common monetary policy, which may consequently not be
the most appropriate tool for dealing with financial risk stemming from the housing markets. The risk
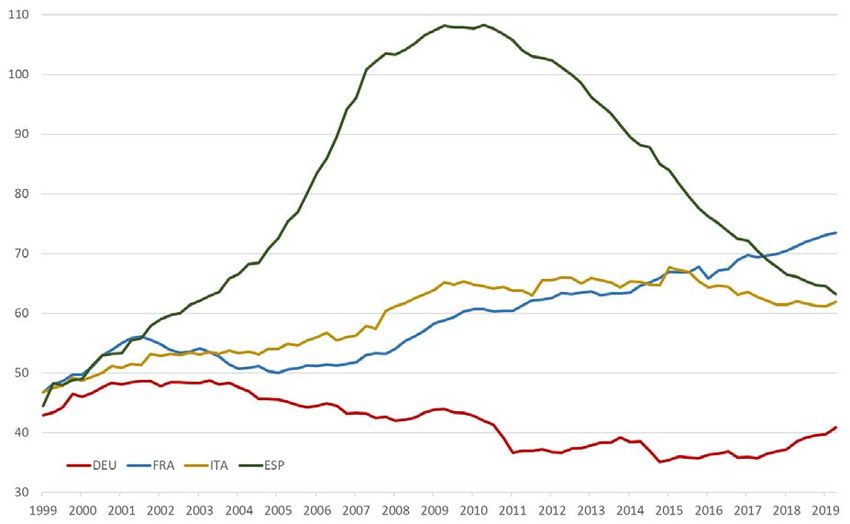
associated with the housing market is also related to credit dynamics. The threat for financial stability
is all the more important when a credit boom is simultaneous with a rise in house prices. For the euro
area as a whole, the ratio of credit for house purchases to GDP has reached a peak of 39 % in 2013 Q1
and has slightly decreased since then to amount to 37.5 %. Here again, it may hide heterogeneity across
countries. For instance, the ratio of credit to GDP has fallen sharply in Spain during the crisis from a
peak at 62.7 % in 2012 Q4 to 41 % in 2019 Q2. Meanwhile, it has increased moderately in Germany and
stands at 37.3 %, only one point higher than in 2011 Q2 and still below the pre-crisis period (Figure 5).
For France, the ratio has increased continuously since 2003.
From the development of credit, it may be noticed that while house prices have increased recently in
Spain, the ratio of credit to GDP is still declining. In Germany, the recent surge in prices is not
accompanied by a rapid rise in credit. For France, prices stabilise but credit to households is still rising.
On average, it seems that credit ratio for the euro area as a whole does not show signs of overheating.
But the house and credit markets are characterised by important heterogeneity that may not be easily
fixed by the common monetary policy.
8 Table A in appendix shows the correlation of cycles.
PE 642.374 12Financial Stability Risks and Policy Options
Figure 5: Outstanding amount of credits for house purchase
Source: ECB. Note: y-axis in % of GDP.
2.4. Bank profitability
Monetary policy has also been criticised by banks because it would limit the benefits of the
intermediation business. Because of their deposit and lending activities, banks' profitability depends in
part on the difference between interest rates on loans -usually long term- and interest rates on deposits
-short term-, the so-called net interest margin. Asset purchases help flatten the yield curve, which
reduce interest margins. The effect can be exacerbated by the negative interest rate policy if the effects
of interest rate cuts on the interest rates on loans are greater compared to the interest rates on deposits.
If the interest paid to households and businesses on their deposits cannot be at its own discretion - the
bank is reluctant to lose customers - or, for legal reasons, the margins of commercial banks would
decrease. However, the argument needs to be qualified because the TLTRO programmes allow banks
to finance themselves at the central bank at negative interest rates. Profitability can also increase as
lower interest rates decrease corporate and household interest expenses and the loan default rate.
The impact of interest rates on bank profitability is ultimately an empirical issue. However, there is no
consensus in the literature. Dell'Ariccia et al. (2017) have found a negative effect, while Madaschi and
Nuevo (2017) have found a positive one. Boungou (2019) specifically analysed the effects of the
negative interest rate policy on a sample of 2 442 banks in the 28 Member States of the European Union.
He notes that negative interest rates weighed on banks' margins, but not profitability, as banks were
able to increase their non-interest income (commissions and fees). These conclusions are supported by
the recent dynamics of earnings and margin indicators in the euro area. Indeed, there are no signs of a
decline in profits and not even a decrease in net interest margins (NIM) since the introduction of
13 PE 642.374IPOL | Policy Department for Economic, Scientific and Quality of Life Policies negative interest rates in the euro area (Figure 6) or in Germany (Figure 7), where criticism of the ECB's policies has been the most severe. The return on equity and assets was negative in 2011 and 2012 and has increased gradually since then. Figure 6: Euro area banks’ profits Source: ECB. Figure 7: German banks’ profits Source: ECB. PE 642.374 14
Financial Stability Risks and Policy Options

The same argument was also used to suggest that insurance companies may incur major costs in terms
of profitability and solvency in a low interest rate environment. This stems from the main feature of the
insurance business model: these companies hold a large number of fixed-term investments in their
balance sheets. The life insurance business in particular is often characterised by financial guarantees
that provide the insured with a minimum return. These guarantees could pose a threat to life insurers
who have sold many of these products in the past. However, the front-end loads and management fees
account for a significant portion of insurance companies' revenue (in addition to revenue that is not
bank interest), which can offset the decline in interest rates. Figure 8 shows the sales and profits of the
13 major insurance companies in the euro area - a highly concentrated market in which the largest
provider, Allianz, generates more than 10 times the turnover of the 13th actor Ageas. Overall, the
impact of low interest rates on insurance companies' profits does not seem to be noticeable, at least
for their future prospects. The operating result of one of the most important players in the industry,
Axa, rose from EUR 4.7 billion in 2013 before the introduction of negative interest rates to EUR 6.2 billion
in 2018. Finally, risks associated with low interest rates for insurance companies and for banks seem to
be overestimated.

Figure 8:         Turnover and profits of major euro area insurance companies

Source: Zonebourse.com. Note: Expectations for 2019, 2020 and 2021 are the average of market analysts’ expectations. The
sample comprises Aegon, Ageas, Allianz, Axa, CNP Assurances, Generali, Hannover Re, Mapfre, Munich Re, NN Group, Scor,
Talanx, and Unipolsai.

2.5.      Public debt sustainability
The latest ECB Financial Stability Review raises doubts on the capacity of euro area high-debt countries
to achieve or maintain debt sustainability if a severe and prolonged economic downturn occurred.
Although low interest rates have spurred longer debt maturities to reduce sensitivity to possible
changes in market sentiment, the ECB analysis shows diverging trends in debt-to-GDP ratios between
medium-debt euro area countries and high-debt ones after output and interest rate shocks and a fiscal

                                                         15                                                 PE 642.374
IPOL | Policy Department for Economic, Scientific and Quality of Life Policies stimulus (Figure 9). The scenario raises two concerns, bearing in mind that it excludes fiscal reactions to the shocks. First, there has been a long tradition since Barro (1986) and Bohn (1998) to assess public debt sustainability via fiscal reaction functions. According to the European Fiscal Board in its latest report (EFB, 2019, pp. 65-67), panel results for 36 developed countries (including the 28 EU Member States) show that higher public debt-to-GDP ratios produce fiscal consolidation. While point estimates are not reported, these results point in the direction of debt sustainability. Following Beetsma and Giuliodori (2010) and Cimadomo (2012), Aldama and Creel (2018) compared fiscal reaction functions for OECD countries obtained with ex post (revised) data and those obtained with real-time data. They report a positive reaction of either the primary surplus or the primary cyclically-adjusted surplus (both expressed in percentage points of GDP) to the debt-to-GDP ratios in the case of euro area and non- euro area countries whatever the data. According to the point estimates in Table 2 (p. 296), debt sustainability is achieved. Figure 9: Public debt dynamics under different shocks Source: ECB Financial Stability Review, November 2019. Second, Blot et al. (2019a) question the ability of euro area Member States to achieve the 60 % debt limit at a 20-year horizon. They use the iAGS model for euro area medium term projections and simulate the path of public debt-to-GDP ratios to 60 % until 2040, which is the horizon of the debt rule in the PE 642.374 16
Financial Stability Risks and Policy Options

Stability and Growth Pact and the Fiscal Compact. 9 The simulations highlight countries that are not
abiding by the rule and the required amount of additional fiscal consolidation while, for countries that
abide by the rule, simulations give an assessment of their fiscal space. Blot et al. (2019a) show that
without fiscal impulses beyond 2021 and under some important assumptions (no risk premia, inflation
expectations anchored at 2 % per year and real interest rate equal to potential growth), some countries
(Belgium, France, Italy and Spain) would exceed the debt limit in 2040. However, after this baseline
scenario, they also compute the required fiscal impulses for all euro area Member States to reach the
debt limit. This would necessitate countries with (resp. without) margins of maneuver to implement a
fiscal stimulus (resp. contraction) of 0.5 % per year over horizons ranging from 2021 to 2023 (Finland,
fiscal stimulus) to 2021 to 2032 (Italy, fiscal contraction). They report that in this second scenario, all
euro area countries would meet the 60 % criterion in 2040. It remains that achieving debt convergence
towards the 60 % limit via additional fiscal consolidation would be economically costly. Countries
implementing additional fiscal consolidation would undergo lower output gaps than in the baseline
scenario, despite the fiscal stimulus from countries with fiscal space. A trade-off between sustained
economic recovery and debt sustainability remains.

9   Properties of the model are available at www.iags-project.org/documents/iags_appendix2013.pdf.

                                                               17                                                 PE 642.374
IPOL | Policy Department for Economic, Scientific and Quality of Life Policies
THE EFFECT OF MONETARY POLICY ON ASSET PRICES
Monetary policy – conventional and unconventional measures – is expected to influence asset prices
as the reaction of financial markets plays a key role in the transmission of monetary policy. Empirical
evidence suggests a positive link between expansionary monetary policy and asset prices, stressing the
effectiveness of monetary policy. 10 However, asset prices may increase beyond the expected effect of
monetary policy and trigger mispricing. It is then crucial not only to assess whether monetary policy
influences asset prices but also if it fuels asset price bubbles.
Blot et al. (2020) deal with this issue. They first provide an indicator of asset price bubbles based on the
estimation of several empirical approaches and assess the effect of monetary policy on those identified
asset price bubbles in the stock and housing market of the euro area.
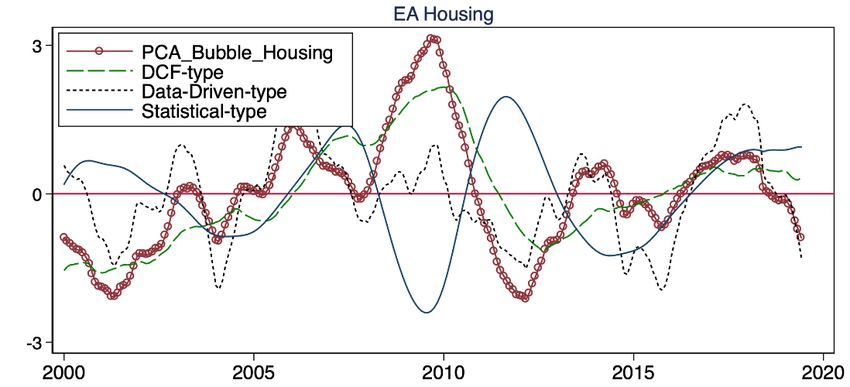
Figure 10: Asset price imbalances
Note: Authors’ estimations described in Blot et al. (2020). The green long dashed line corresponds to price imbalances series
of the discounted cash-flow model (the structural one), the grey dotted line corresponds to the data-rich model (the
econometric model) and the blue line corresponds to the statistical model. The red circled line corresponds to the first
principal component of all 3 other variables. All series are normalised.
The synthetic measure of deviations of the house and stock prices in the euro area stem from three
approaches: a structural model, a data-driven approach and a statistical model. Then Blot et al. (2020)
compute a bubble indicator from the first principal component using a principal component analysis
10 For the euro area, see Angeloni and Ehrmann (2003), Bohl et al. (2008), Andersson and Overby (2009), Filbien and Labondance (2012)
and Altavilla et al. (2019).
PE 642.374 18Financial Stability Risks and Policy Options
(PCA) that summarizes the information provided by the three models. 11 The PCA summarising the
deviations from the benchmark in the stock and housing markets are represented in Figure 10. For
stock prices, imbalances have been significant in the early 2000 and in 2007 consistent with the
dot.com bubble and the financial boom preceding the global financial crisis. Low points are observed
in 2004 and 2012. For the housing market, deviations have become positive after 2005 and reached a
peak in 2009.
Then, Blot et al. (2020) find that both restrictive and expansionary monetary surprises influence stock
price imbalances (Figure 11). Expansionary monetary policy tends to inflate stock price imbalances
while restrictive monetary policy tends to deflate these imbalances. The effects of monetary policy are
now much more symmetric than for actual asset prices. Both responses become non-significant after
around 14 months. The effect is overall small in magnitude. While they find that ECB monetary policy
is transmitted to house prices in the euro area since 2008, they find no evidence of a significant impact
of both restrictive and expansionary monetary on house price imbalances. Hence, this means that the
effect of monetary surprises on house prices should be driven by the response of the benchmark value
of house prices.
Figure 11: Non-linear responses of asset price imbalances to monetary surprises
Note: Non-linear responses correspond to estimates of equation (3). Shaded area represents the 1 and 2 standard errors
confidence interval of the response of the monetary surprises. The dependent variables are the first principal component of
the three asset price imbalances estimated in Blot et al. (2020). ECB monetary surprises are computed as the intraday change
in the 2-year nominal German sovereign bond yield around the ECB monetary event. We have checked that the responses of
house price imbalances to restrictive surprises (the black line with the grey confidence interval) is non-significant.
11 The PCA consists in estimating a unique indicator which maximises the common variance of the individual series standing for asset price
imbalances. More specifically, PCA seeks a linear combination such that the maximum variance is extracted from the variables.
19 PE 642.374IPOL | Policy Department for Economic, Scientific and Quality of Life Policies
POLICY OPTIONS IN CASE OF A RECESSION
4.1. QE for corporates
In a former Monetary Dialogue paper (Blot et al., 2019b), we argued that instead of buying public
securities, the ECB could buy private assets, thereby redirecting QE to corporates. The ECB can draw on
the Bank of Japan (BoJ) experience, which has implemented this strategy since 2010 with purchases of
exchange-traded funds (ETFs). The ECB could thus provide monetary stimulus through a new channel.
In fact, this strategy is already in the ECB toolkit with the CSPP (Corporate Sector Purchase Program).
On 12 September 2019, the ECB reactivated the CSPP. Adding a target for riskier purchases, including
stocks, is an option for further monetary easing. There can be two channels through which QE for
businesses would be effective. First, it would reduce risk premiums and the cost of financing
businesses, stimulating investment. The increase in share values could also increase the collateral value
of the assets held by companies, easing the funding constraint. Second, rising asset prices would
trigger a positive wealth effect for households, stimulating private consumption.
Farmer (2019) has also suggested that central banks should target asset prices. Here, the objective may
be not only to stimulate the economy by easing financing conditions and creating a positive wealth
effect for households, but also to strengthen financial stability. Indeed, the central bank would aim at
mitigating excessive valuations on stock markets.
4.2. QE to households
In the same paper (Blot et al., 2019b), we also argued that the ECB could implement direct measures in
favour of households. There are various reasons why quantitative easing may have had limited effects
on the decisions of household consumers via, e.g. the wealth channel, the collateral channel or the
distribution channel.
One much-discussed option for the ECB to surpass these limits is to provide households with a transfer
from the ECB via so-called helicopter money: ‘print money and distribute it to the public!’. While
nothing in the euro area rules prevents the ECB from taking such independent action, this policy would
directly finance household spending by increasing their disposable income. The implications for the
size of the balance sheet could be permanent or temporary depending on whether the central bank
plans to debit a fraction of this amount in subsequent years or not. Regarding the implications for the
central bank's balance sheet, it is important to add that the central bank could also offset the effect of
this policy on the size of its balance sheet by selling bonds to the private sector for its assets.
An argument against quantitative easing for households refers to moral hazard of two types. First, in
the case of an over-indebted private sector, households would reduce their deleveraging efforts by
expecting that printing money would always go to the rescue, hence increasing future risks. Second,
this policy could undermine incentives to work and amplify the inactivity trap. In the case of an
occasional and unexpected transfer, the argument is rather flimsy. Furthermore, it overlooks that
conventional monetary policy and QE yield asset price increases, which benefit the wealthiest
households. The quantitative easing to households would rebalance monetary expansion towards the
lower end of the distribution of income and wealth.
4.3. Macroprudential policies
Macroprudential policy has attracted attention from policymakers and researchers since the global
financial crisis because of the deep roots of the crisis within the leverage and risk-taking of individual
economic agents and banks. The objective of macroprudential tools is to ensure the stability of the
PE 642.374 20Financial Stability Risks and Policy Options
financial system by reinforcing its resilience and preventing systemic risks. The main focus is on credit
growth and leverage, maturity mismatch and market illiquidity, direct and indirect exposure
concentrations, moral hazard, and the resilience of financial systems. The main instruments include the
countercyclical capital buffer and the loan-to-value ratio.
However, macroprudential policies raise various issues. First, Galati and Moessner (2018) assess
whether these policies are effective at limiting credit growth and housing prices. Second, the question
of how macroprudential policy interacts with monetary policy is open. The two policies can have
adverse effects on the effectiveness or the objectives of the other. Garcia-Revelo et al. (2019) show that
a restrictive monetary policy enhances the impact of macroprudential tightening on credit growth and
that monetary policy helps to reduce the transmission delay of macroprudential policy actions.
However, Cumming and Hubert (2020) show that tighter borrowing limits would reduce the
effectiveness of monetary policy. Although macroprudential regulations seem effective, there seem to
be strong interactions between monetary policy and macroprudential tools.
4.4. Public investment
At the Jackson Hole symposium in 2014, the President of the ECB, Mario Draghi, acknowledged that
monetary policy could not be ‘the only game in town’ in sustaining the euro area recovery. With the
policy rate at the zero lower bound, and the continuing large savings of the private sector, he argued
that fiscal expansion needed to support monetary policy.
More recently, and against the backdrop of the economic slowdown, the European Commission (2019)
and the OECD (2019) have advocated a fiscal stimulus in the euro area. The implementation of a fiscal
stimulus raises two main issues though, one regarding the fiscal space to implement the stimulus and
one related to the ‘best’ instrument to perform a fiscal stimulus. Section 2.5 already discussed fiscal
space and debt sustainability. We may add that recent interest rate developments show that investors’
appetite for European public debts remains high and suggest that an expansionary fiscal policy would
not necessarily translate into higher risk premia. In this respect, Blanchard (2019) has highlighted the
fiscal room for manoeuvre that stems from negative critical gaps (the difference between the nominal
GDP growth rate and the apparent interest rate on debt).
While it is well-established that the macroeconomic impact of fiscal policy may be high, particularly
during an economic crisis (Jordà and Taylor, 2016), the choice of the best instrument remains
disputable. The meta-analyses of Gechert and Will (2012) and Gechert (2015) show that the spending
multipliers are usually larger than tax multipliers, but the multiplier value depends on a number of
factors such as the degree of openness of the economy, the exchange rate regime, the monetary stance
and the output gap. Overall though, multiplier effects of public investment stimuli are generally on top
of the distribution. This feature is confirmed by another meta-analysis (Bom and Ligthart, 2014).
Against the backdrop of the downward trend in public investment since the 1980s, and its acceleration
during economic crises when governments try to curb deficits and debts through cuts in public
investment (European Fiscal Board, 2019), a public investment stimulus in the euro area appears as a
good option. It would not only foster real activity if the economic slowdown continues but it would
also help addressing the issue of climate change. This new impetus may require amending European
fiscal rules so that governments have more incentives to adopt long term strategies.
21 PE 642.374IPOL | Policy Department for Economic, Scientific and Quality of Life Policies
REFERENCES
• Agarwal, S. and W. Qian (2014). “Consumption and Debt Response to Unanticipated Income
Shocks: Evidence from a Natural Experiment in Singapore.” American Economic Review 104.12,
4205–30.
• Aldama, P. and Creel, J. (2018). “Les règles budgétaires: une analyse empirique sur données
révisées et en temps réel”. Revue de l’OFCE, 158, 281-306.
• Altavilla, C., Brugnolini, L., Gürkaynak, R. S., Motto, R., & Ragusa, G. (2019). “Measuring euro area
monetary policy”. Journal of Monetary Economics, 108, 162-179.
• Andersson M. and L. Overby, 2009, “Which News Moves the Euro Area Bond Market?”, German
Economic Review, 10( 1), 1-31.
• Angeloni I. and M. Ehrmann, 2003, “Monetary Transmission in the Euro Area: Early Evidence“,
Economic Policy, 18, 471-488.
• Arellano, M., Blundell, R., and Bonhomme, S. (2017). “Earnings and Consumption Dynamics: A
Nonlinear Panel Data Framework.” Econometrica 85, pp. 693–734.
• Baker, S. and C. Yannelis (2017). “Income Changes and Consumption: Evidence from the 2013
Federal Government Shutdown.” Review of Economic Dynamics 23, pp. 99–124.
• Barbon, A., and V. Gianinazzi (2018), “Quantitative Easing and Equity Prices: Evidence from the ETF
Program of the Bank of Japan”, https://ssrn.com/abstract=2925198.
• Barro, R.J. (1986). “U.S. Deficits Since World War I”. Scandinavian Journal of Economics, 88( 1), 195-
222.
• Beetsma, R. and Giuliodori, M. (2010). “Fiscal Adjustment to Cyclical Developments in the OECD:
An Empirical Analysis Based on Real-time Data”. Oxford Economic Papers, 62(3), 419-441.
• Blanchard, O. (2019). "Public Debt and Low Interest Rates”. American Economic Review, 109(4),
1197-1229.
• Blot, C., Ducoudré, B., Heyer, E. and Sampognaro, R. (2019a). “The euro area at the edge of the
downturn: is there any room for manoeuvre?”. OFCE Policy Brief, 60, 12 December.
• Blot, C., Creel, J. and Hubert, P. (2019b). “Challenges ahead for EMU monetary policy”, Monetary
Dialogue, September 2019.
• Blot, C., P. Hubert and F. Labondance (2018), “Monetary Policy and Asset Price Bubbles”, OFCE
Working Paper, n° 37.
• Blot, C., P. Hubert and F. Labondance (2020), “Monetary policy and asset prices in the euro area
since the Global Financial Crisis”, Revue d’Economie Politique, forthcoming.
• Bohl, M., P. Siklos and D. Sondermann, 2008, “European Stock Markets and the ECB's Monetary
Policy Surprises”, International Finance, 11(2), 117-130.
• Bohn, H. (1998). “The Behavior of U. S. Public Debt and Deficits”. Quarterly Journal of Economics,
113(3), 949–963.
• Bom, P.R., and Ligthart, J.E. (2014). “What have we learned from three decades of research on the
productivity of public capital?”. Journal of Economic Surveys, 28(5), 889-916.
PE 642.374 22Financial Stability Risks and Policy Options
• Boone, L. and N. Girouard (2002). “The Stock Market, the Housing Market and Consumer
Behaviour”, OECD Economic Studies No. 35, 2002/2, 175-200.
• Borio, C., and Zabai, A. (2018). “Unconventional monetary policies: a re-appraisal”. In Research
Handbook on Central Banking. Edward Elgar Publishing.
• Boungou, W. (2019). “Negative Interest Rates, Bank Profitability and Risk-taking”, OFCE Working
Paper, n°10.
• Charoenwong, B., R. Morck, and Y. Wiwattanakantang (2019), “Asset Prices and Corporate
Responses to Bank of Japan ETF Purchases”, NBER Working Paper 25525.
• Chauvin, V. and J. Muellbauer (2013). “Consumption, household portfolios and the housing
market: a flow of funds approach for France”, presented at Banque de France, Dec.
• Cimadomo, J. (2012). “Fiscal Policy in Real Time”. Scandinavian Journal of Economics, 114, 440-465.
• Claessens, S., Kose, M. A., & Terrones, M. E. (2009). “What happens during recessions, crunches and
busts?”. Economic Policy, 24(60), 653-700.
• Commault, J. (2019). “Does Consumption Respond to a Transitory Income Shock?”, mimeo
SciencesPo.
• Cumming, Fergus, and Paul Hubert (2020), "The Role of Households' Borrowing Constraints in the
Transmission of Monetary Policy", Bank of England Working Paper, No. 836.
• Dell’Ariccia G., Laeven L. and Suarez G., (2017). “Bank Leverage and Monetary Policy’s Risk-taking
Channel: Evidence from the United States”. Journal of Finance, 72(2), 613-654.
• European Commission (2019). “Autumn 2019 Economic Forecast: A challenging road ahead”.
Brussels: European Commission.
• European Fiscal Board (2019). “Assessment of EU fiscal rules with a focus on the six and two-pack
legislation”. EFB Report, August.
• Farmer, R. (2019): "Central bank equity purchases: an idea whose time has come", Roger Farmer’s
blog, 2 August.
• Filbien J-Y. and F. Labondance, 2012, “Réactions des marchés d’actions de la zone euro aux
annonces non anticipées de la BCE”, Brussels Economic Review, vol.55 (2), 179-204.
• Garcia Revelo, J.D., Y. Lucotte and F. Pradines-Jobet (2019), “Macroprudential and monetary
policies: The need to dance the tango in harmony” Journal of International Money & Finance,
forthcoming.
• Gechert, S. (2015). “What fiscal policy is most effective? A meta-regression analysis”. Oxford
Economic Papers, 67(3), 553–580.
• Gechert, S. and Will, H. (2012). “Fiscal Multipliers: A Meta Regression Analysis”, IMK Working Paper,
97.
• Geiger, F., J. Muellbauer and M. Rupprecht (2014). “The Housing Market, Household Portfolios and
the German Consumer”, mimeo Bundesbank, DFG and IMF conference, Eltville, June 5-6.
• Johnson, D., Parker, J., and Souleles, N. (2006). “Household Expenditure and the Income Tax
Rebates of 2001.” American Economic Review 96.5, pp. 1589–1610.
23 PE 642.374IPOL | Policy Department for Economic, Scientific and Quality of Life Policies
• Jordà, Ò., Schularick, M., & Taylor, A. M. (2013). “When credit bites back”. Journal of Money, Credit
and Banking, 45(s2), 3-28.
• Jordà, Ò, and Taylor, A.M. (2016). “The Time for Austerity: Estimating the Average Treatment Effect
of Fiscal Policy”. The Economic Journal, 126(590), 219–255.
• Kan, K., Peng, S., and Wang, P. (2017). “Understanding Consumption Behavior: Evidence from
Consumers’ Reaction to Shopping Vouchers.” American Economic Journal: Economic Policy 9.1,
pp. 137–53.
• Madaschi C. and Nuevo I., (2017). “The profitability of banks in a context of negative monetary
policy rates: the cases of Sweden and Denmark”. European Central Bank. Occasional Paper Series,
No. 195.
• Meller, B., & Metiu, N. (2017). “The synchronization of credit cycles”. Journal of Banking & Finance,
82, 98-111.
• Misra, K. and Surico, P. (2014). “Consumption, Income Changes, and Heterogeneity: Evidence from
Two Fiscal Stimulus Programs.” American Economic Journal: Macroeconomics 6.4, pp. 84–106.
• Miyao, R. and T. Okimoto (2017), “The Macroeconomic Effects of Japan’s Unconventional Monetary
Policies”, RIETI Discussion Paper, 17-E-065.
• Muellbauer, J. (2014). “Combatting Eurozone deflation: QE for the people”, in Quantitative Easing,
Evolution of economic thinking as it happened on Vox, CEPR Press, Chapter 20, 163-173.
• OECD (2019b). OECD Economic Outlook, Volume 2019 Issue 1, OECD Publishing.
• OFCE (2019). “Endettement des entreprises: où en sommes-nous ? », in Perspectives 2019-2021
pour l’économie mondiale et la zone euro, Revue de l’OFCE n°163, p.157-169.
• Okimoto, T. (2019a), “Trend Inflation and Monetary Policy Regimes in Japan”, Journal of
International Money and Finance, 92, 137-152.
• Okimoto, T. (2019b), “The Bank of Japan’s exchange-traded fund purchases and implications for
the future”, VoxEu, 13 June.
• Parker, J., Souleles, N., Johnson, D., and McClelland, R. (2013). “Consumer Spending and the
Economic Stimulus Payments of 2008.” American Economic Review 103.6, pp. 2530–53.
• Schularick, M., and Taylor, A. M. (2012). “Credit booms gone bust: Monetary policy, leverage cycles,
and financial crises, 1870-2008”. American Economic Review, 102(2), 1029-61.
• Smets, F. (2014). Financial stability and monetary policy: How closely interlinked?. International
Journal of Central Banking, 10(2), 263-300.
• Souleles, N. (1999). “The Response of Household Consumption to Income Tax Refunds.” American
Economic Review 89.4, pp. 947–958.
• Souleles, N. (2002). “Consumer response to the Reagan tax cuts.” Journal of Public Economics 85.1,
pp. 99–120.
• Taylor, J. (2009), “The financial crisis and the policy responses: An empirical analysis of what went
wrong”. NBER Working Paper, No. 14631.
PE 642.374 24Financial Stability Risks and Policy Options
ANNEX
Figure A: House price dynamics (deflated by CPI)
Source: BIS (Property price database). Note: 2007=100.
Table A: Correlation of house price cycles
DEU FRA ITA ESP NLD BEL FIN IRL
DEU 1.00
FRA -0.42 1.00
ITA -0.03 0.86 1.00
ESP -0.21 0.91 0.77 1.00
NLD 0.29 0.32 0.45 0.53 1.00
BEL 0.23 0.68 0.92 0.64 0.56 1.00
FIN -0.81 0.37 -0.12 0.38 -0.17 -0.32 1.00
IRL -0.17 0.41 0.39 0.62 0.88 -0.37 0.01 1.00
Sources: BIS (Property price database) and authors’ calculations.
25 PE 642.374We pay special attention to the different types of financial risk discussed in the public debate: equity, housing, corporate debt, public debt sustainability, and banks and insurance companies’ profits. Our assessment does not point to significant risks in the euro area even if attention should be drawn on some local or specific market segments. Even if monetary policy may not be the most appropriate tool to dampen these risks, the ECB has still some policy options to respond to an economic slowdown. This document was provided by Policy Department A at the request of the Committee on Economic and Monetary Affairs. PE 642.374 IP/A/ECON/2020-07 PDF ISBN 978-92-846-6149-7 | doi:10.2861/80036 | QA-03-20-044-EN-N
You can also read