Lab on a Chip - RSC Publishing

Page created by Alma Gomez
 
CONTINUE READING
Lab on a Chip - RSC Publishing
Volume 21
                                                                                               Number 9
                                                                                               7 May 2021
                                                                                               Pages 1625–1834

Lab on a Chip
Devices and applications at the micro- and nanoscale
rsc.li/loc

                                ISSN 1473-0197

                                PAPER
                                Nicolas et al.
                                High throughput transepithelial electrical resistance (TEER)
                                measurements on perfused membrane-free epithelia
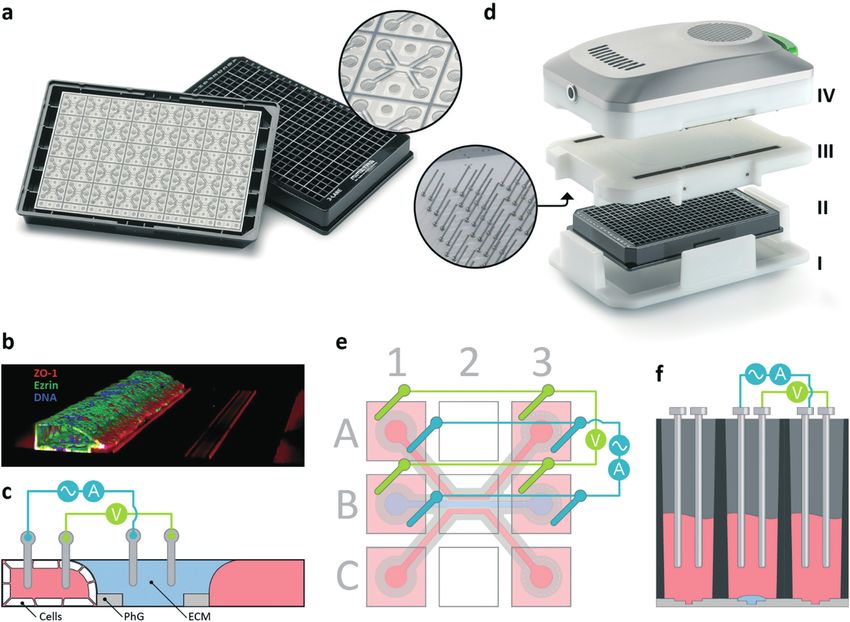
Lab on a Chip - RSC Publishing
Lab on a Chip
                                                                                                                                                                                                                           View Article Online
                                                                                                     PAPER                                                                                                                 View Journal | View Issue

                                                                                                                                          High throughput transepithelial electrical
           This article is licensed under a Creative Commons Attribution 3.0 Unported Licence.

                                                                                                 Cite this: Lab Chip, 2021, 21, 1676
                                                                                                                                          resistance (TEER) measurements on perfused
Open Access Article. Published on 15 April 2021. Downloaded on 10/25/2021 7:11:34 AM.

                                                                                                                                          membrane-free epithelia†
                                                                                                                                          A. Nicolas, ab F. Schavemaker,a K. Kosim,a D. Kurek,a M. Haarmans,a M. Bulst,c
                                                                                                                                          K. Lee,c S. Wegner,c T. Hankemeier, b J. Joore,a K. Domansky,a H. L. Lanz,a
                                                                                                                                          P. Vultoa and S. J. Trietsch *a

                                                                                                                                          Assessment of epithelial barrier function is critically important for studying healthy and diseased biological
                                                                                                                                          models. Here we introduce an instrument that measures transepithelial electrical resistance (TEER) of
                                                                                                                                          perfused epithelial tubes in the microfluidic OrganoPlate platform. The tubules are grown in microfluidic
                                                                                                                                          channels directly against an extracellular matrix, obviating the need for artificial filter membranes. We
                                                                                                                                          present TEER measurements on Caco-2 intestinal and renal proximal tubule epithelium. Forty tubules on
                                                                                                                                          one single plate were interrogated in less than a minute. We show that TEER measurement is significantly
                                                                                                                                          more sensitive than a fluorescent reporter leakage assay in response to staurosporine. We demonstrate a
                                                                                                                                          40-channel time-lapse data acquisition over a 25 hour time period under flow conditions. We furthermore
                                                                                                 Received 29th July 2020,                 observed a 50% reduction in Caco-2 TEER values following exposure to a cocktail of inflammatory
                                                                                                 Accepted 4th March 2021
                                                                                                                                          cytokines. To our best knowledge, this is the first instrument of its kind that allows routine TEER studies in
                                                                                                                                          perfused organ-on-a-chip systems without interference by artificial filter membranes. We believe the
                                                                                                 DOI: 10.1039/d0lc00770f
                                                                                                                                          apparatus will contribute to accelerating routine adoption of perfused organ-on-a-chip systems in
                                                                                                 rsc.li/loc                               academic research and in industrial drug development.

                                                                                                 Introduction                                                                      (TEER) measurement correlates electrical properties of an
                                                                                                                                                                                   epithelial layer with biological aspects such as cell layer
                                                                                                 Barrier function of epithelia is crucial for maintaining                          confluency and thickness, tight junction formation, and
                                                                                                 homeostasis in the human body. Its disruption in organs                           morphology.4
                                                                                                 such as the intestine, kidney, lung, skin, eye, or the blood–                        Current systems for measuring TEER typically employ
                                                                                                 brain-barrier is a hallmark of numerous diseases and toxic                        chopstick-like electrodes inserted into an electrolyte, usually
                                                                                                 effects.1–3 Studying epithelial barrier function is essential for                 a growth medium or a buffer solution, on both sides of a
                                                                                                 understanding disease processes, development of new                               porous membrane insert.4 An epithelial layer grown onto the
                                                                                                 therapeutic treatments, and investigation of compound safety.                     porous insert is probed by an alternating current through the
                                                                                                 Permeability of epithelia grown in vitro is therefore routinely                   monolayer and measuring the associated electrical
                                                                                                 evaluated by fundamental and pharmaceutical researchers                           impedance. This impedance, once corrected for background
                                                                                                 alike. In addition, proper barrier function is an important                       offset and multiplied by the surface area of the insert, yields
                                                                                                 prerequisite when studying transport phenomena across                             the TEER value of the tissue in Ω cm2. Alternative methods
                                                                                                 epithelia in vitro.                                                               include the use of surface-patterned electrodes on which an
                                                                                                    Electrical measurement of the impedance is the gold                            epithelial layer is grown.5,6
                                                                                                 standard for assessing the barrier function of epithelia                             Over the last decade, the use of microfluidics-based cell
                                                                                                 in vitro. This so-called trans epithelial electrical resistance                   culture systems, also called organ-on-a-chip systems, have
                                                                                                                                                                                   rapidly gained popularity. These systems add physiologically
                                                                                                                                                                                   relevant cues such as exposure to flow-induced shear stress,
                                                                                                 a
                                                                                                   Mimetas B. V., J.H. Oortweg 19, 2333CH, Leiden, The Netherlands.                mechanical strain, and precise control of gradients. In
                                                                                                 E-mail: s.trietsch@mimetas.com                                                    addition, these platforms typically incorporate layered cell
                                                                                                 b
                                                                                                   Division of Analytical Biosciences, LACDR, Leiden University, Einsteinweg 55,
                                                                                                                                                                                   types of multiple lineages and include 3D extracellular matrix
                                                                                                 2333 CC Leiden, The Netherlands
                                                                                                 c
                                                                                                   Sciospec GmbH, Leipziger Str. 43b, 04828 Bennewitz, Germany
                                                                                                                                                                                   (ECM) components.7
                                                                                                 † Electronic supplementary information (ESI) available: Supplementary                TEER measurement capabilities have been implemented
                                                                                                 methodology and figures. See DOI: 10.1039/d0lc00770f                              in a range of such microfluidic systems.8 In 2017, Henry

                                                                                                 1676 | Lab Chip, 2021, 21, 1676–1685                                                            This journal is © The Royal Society of Chemistry 2021
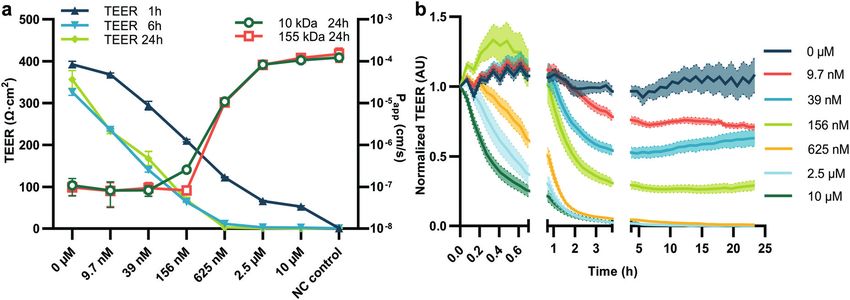
Lab on a Chip - RSC Publishing
View Article Online

                                                                                                 Lab on a Chip                                                                                                                                   Paper

                                                                                                 et al. reported a PDMS based microfluidic system with                        dilution series, technical replicates, and controls.22
                                                                                                 integrated planar electrodes designed for impedance                          Additionally, both on-chip and classical culture approaches
                                                                                                 spectroscopy.9 Odijk et al. developed polydimethylsiloxane                   make use of permeable membranes for culturing cells in
                                                                                                 (PDMS) chips with embedded conductive biocompatible                          barriers studies. While TEER values are usually area-
                                                                                                 wires carrying the current close to the cell compartment.10                  corrected, complex current pathways are sources of non-
                                                                                                 TEER setups have been used to characterize models of tissues                 biological variations, hampering interpretation. This makes
                                                                                                 such as gut and blood–brain barrier.11,12 Other reported                     the membrane a significant undesirable factor in the
                                                                                                 solutions comprise either external porous inserts linked to                  measurement process.23–25
                                                                                                 perfused microfluidic channels13,14 or artificial membranes                     Recently, we and others reported formation of perfused
           This article is licensed under a Creative Commons Attribution 3.0 Unported Licence.

                                                                                                 directly built in the microfluidic devices.15–17 The downside                intestinal,26–28 renal,29–32 and vascular tubular barrier
Open Access Article. Published on 15 April 2021. Downloaded on 10/25/2021 7:11:34 AM.

                                                                                                 of these approaches lies in the limited scalability. Reported                models.33–37 In our studies, tubes were grown in a
                                                                                                 systems are typically based on single chips yielding single                  microfluidic titerplate called the OrganoPlate (Fig. 1a). Each
                                                                                                 datapoints.18–21 This makes it cumbersome to include                         chip comprises up to two tubules, grown directly against an

                                                                                                 Fig. 1 OrganoPlate and OrganoTEER device design and measurement principle. (a) The OrganoPlate consists of a microtiter plate with 384 wells
                                                                                                 connecting to 40 microfluidic chips at the bottom of the plate. The inlay shows a single chip that comprises 3 channels that join in the centre of
                                                                                                 the chip. (b) A 3-dimensional reconstruction of a confocal image of a Caco-2 tubule cultured in the OrganoPlate. (c) Schematic cross-section of
                                                                                                 the centre of the chip, depicting the ECM gel, the phaseguides, the tube that is directly grown against the ECM gel, and a diagram of the electrical
                                                                                                 circuit formed from the apical to basal side of the tube. The two lanes adjacent to the ECM gel are perfused by passive levelling. (d) Exploded view
                                                                                                 of the OrganoTEER system including the plate holder (I), the OrganoPlate (II) in which the electrode board (III) is positioned and connected to the
                                                                                                 measurement module (IV). Further images shown in ESI† Fig. S2a–d. (e) Artist impression of electrode configuration addressing a single chip. Six
                                                                                                 squares represent access wells of the microtiter plate. To perform a four-point measurement in a single chip, eight electrodes are inserted in the
                                                                                                 four access wells. Electrodes on opposing ends of a lane are short circuited to form two electrode pairs: a current carrying pair (blue) and a
                                                                                                 voltage sensing pair (green). Short circuiting the electrode pairs results in lower resistance and more homogeneous current lines across the
                                                                                                 membrane. A controlled voltage source was connected between current carrying electrodes to impose a sinusoidal AC voltage of 100 mV
                                                                                                 amplitude across the microfluidic chip and the resulting current was measured. Voltage was measured between sensing electrodes to compensate
                                                                                                 for potential drop across the current carrying electrodes. Such four-point measurements are essential to remove low frequency effects due to
                                                                                                 electrical bilayers. Further electrical details and schematics are presented in ESI† Fig. S3a–c. (f) Schematic cross-section of three access wells with
                                                                                                 inserted electrodes. Electrodes dip in the medium, which acts as an electrolyte contacting the tube at either the luminal or basal side.

                                                                                                 This journal is © The Royal Society of Chemistry 2021                                                          Lab Chip, 2021, 21, 1676–1685 | 1677
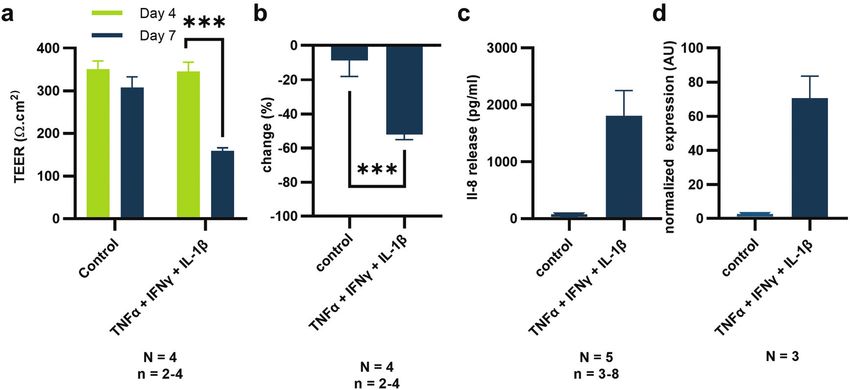
Lab on a Chip - RSC Publishing
View Article Online

                                                                                                 Paper                                                                                                              Lab on a Chip

                                                                                                 ECM, without the use of artificial membranes (Fig. 1b and c).     with a set of parallel, independently working, impedance
                                                                                                 Previously, we investigated barrier integrity by monitoring       analysers. This enables semi-parallel data acquisition,
                                                                                                 the leakage of a fluorescent reporter from the lumen of the       optimizing acquisition speed, and reducing heat generation.
                                                                                                 tubule into the ECM. While this method is sensitive, scalable,    The assembly was connected to the laptop (i7 processor, 8
                                                                                                 and compatible with high content imaging platforms, it also       GB of RAM) via USB. Dedicated software controlled the
                                                                                                 requires several user interventions, including adding a           measurement unit, recorded the data, and performed signal
                                                                                                 fluorescent probe to the tubes in a timely manner. In             processing. The software allowed for optimization of the
                                                                                                 addition, the assay is limited by the molecular size and          measurement parameters to the expected TEER values. The
                                                                                                 weight of the fluorescent reporter and has limited                start and end frequencies could be chosen to match the
           This article is licensed under a Creative Commons Attribution 3.0 Unported Licence.

                                                                                                 compatibility with long-term time-lapse monitoring in             system resistance and TEER. Lower starting frequency
Open Access Article. Published on 15 April 2021. Downloaded on 10/25/2021 7:11:34 AM.

                                                                                                 general and under flow conditions in particular.26                enabled measurement of higher TEER values at the cost of
                                                                                                    Here, we report a methodology for measuring TEER of            longer measurement times. Higher end frequencies, which
                                                                                                 epithelial tubules in the OrganoPlate platform. The               are needed to measure lower TEER and the system resistance,
                                                                                                 apparatus, called OrganoTEER, comprises 480 electrodes that       had little impact on acquisition time. However, the useful
                                                                                                 dip into the wells of the microtiter plate, thereby contacting    range was limited by the parasitic capacitance. The precision
                                                                                                 the cell culture medium that addresses either the luminal or      setting of the internal analog-to-digital converter within the
                                                                                                 basal side of the epithelium. We investigated TEER properties     measurement module could be changed to adjust the
                                                                                                 of the intestinal carcinoma cell line Caco-2 as well as the       integration time of points distributed across the frequency
                                                                                                 quasi-immortalized renal proximal tubule cell line RPTEC.         sweep. Higher values resulted in a higher signal-to-noise ratio
                                                                                                 Our measurements confirmed increasing TEER values with            (SNR) at the cost of slower acquisitions. Typical set values
                                                                                                 tubular growth over time and decreasing values in response        ranged between 0 and 1. The Averaging setting determined
                                                                                                 to toxic compounds. We showed TEER to be more sensitive           the number of sweeps across the spectrum. More sweeps
                                                                                                 than a fluorescent reporter leakage assay and capable of          could be averaged to increase the SNR at the cost of
                                                                                                 time-lapse monitoring under flow conditions. Lastly, we           increased acquisition times. The most common setting
                                                                                                 demonstrated measurement of induced inflammation of               was 1.
                                                                                                 Caco-2 tubules. The instrument is revolutionary in terms of          To accommodate long-term monitoring of TEER in an
                                                                                                 its throughput, ease-of-use, and capability to interrogate        OrganoPlate, the OrganoTEER allowed for programming of
                                                                                                 epithelia under flow and without interference of porous           time-lapse measurement series. Such series could include
                                                                                                 membranes. We anticipate its routine use in both academic         simple repeats, but also include more complex programs with
                                                                                                 research and pharmaceutical development.                          the interval or frequency settings changing throughout the
                                                                                                                                                                   series. Carefully designed internal electronics with extremely
                                                                                                 Materials & method                                                low thermal output and component insulation enabled long-
                                                                                                                                                                   term use of the instrument inside a tissue culture incubator
                                                                                                 TEER device use and settings                                      without negatively affecting the cells cultured in the plate or
                                                                                                 The proposed TEER instrument consisted of four parts              the functioning of the incubator. For single-point
                                                                                                 including a plate holder (i), electrode board (iii),              measurements outside an incubator, the OrganoPlate was
                                                                                                 measurement unit (iv) (Fig. 1d) and a laptop running drivers      taken out of the incubator, refreshed with 50 μL of cell
                                                                                                 and analysis software (ESI† Fig. S1a and b). The electrode        culture medium and left to equilibrate at room temperature
                                                                                                 board, which was used to provide electrical connections to all    for 30 minutes prior to starting measurements. In contrast,
                                                                                                 chips in an OrganoPlate, featured 480 stainless steel             all time-lapse TEER measurements were performed inside
                                                                                                 electrodes integrated on a printed circuit board (see ESI† info   the incubator on a rocker.
                                                                                                 S1.1). The stainless-steel electrodes were arranged in pairs to
                                                                                                 facilitate 4 terminal sensing. One electrode of each pair was
                                                                                                 current carrying while the other was voltage sensing. A           Electrode board cleaning protocol
                                                                                                 controlled voltage source was connected between current           Before and after use, the electrodes were cleaned by spraying
                                                                                                 carrying electrodes to impose a sinusoidal AC voltage of 100      70% ethanol onto the board using a spray bottle. The
                                                                                                 mV amplitude across the investigated section of each              electrode board was left to dry for at least 30 minutes in a
                                                                                                 microfluidic chip. Using the plate holder to ensure               laminar flow cabinet. To minimize compound carryover
                                                                                                 appropriate alignment, all electrode pairs were inserted          following an exposure to a toxicant, we sequentially
                                                                                                 directly into the inlet and outlet wells of the microfluidic      immersed the electrode board in 3 separate single well plates
                                                                                                 channels of the OrganoPlate, forming individual electrically      filled with Milli-Q water. After repeated use or long-term
                                                                                                 conductive paths across each chip through the respective          incubation with exposure of the electrodes to growth
                                                                                                 ECM interfaces (Fig. 1c–f). The electrode board was               medium, fouling could be observed. To remove visible
                                                                                                 connected to the measurement unit, which used a built-in          fouling of the electrodes, the electrode board was immersed
                                                                                                 impedance analyser capable of acquiring impedance spectra         in a single well plate filled with 50 mL of a 1 : 20 solution of
                                                                                                 from 0.1 Hz to 1 MHz. A set of multiplexers was combined          RBS T342 (Chemical Products R. Borghgraef N.V, BE) in HBSS

                                                                                                 1678 | Lab Chip, 2021, 21, 1676–1685                                            This journal is © The Royal Society of Chemistry 2021
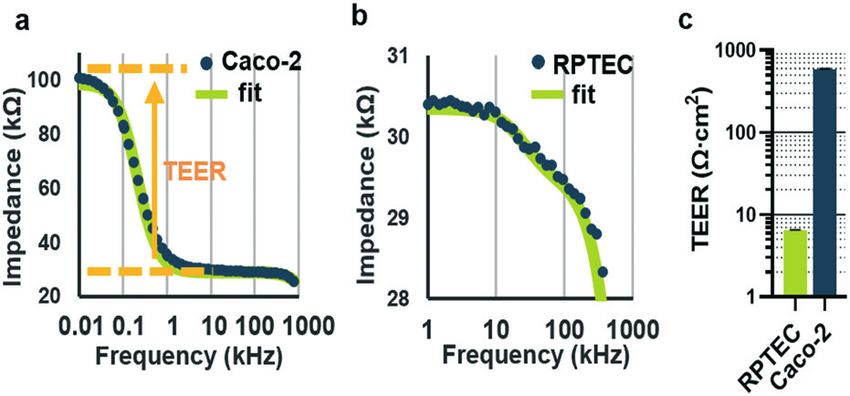
Lab on a Chip - RSC Publishing
View Article Online

                                                                                                 Lab on a Chip                                                                                                                      Paper

                                                                                                 (Sigma, DE, H6648). The electrode board was left in the          Barrier integrity assay (BI assay) and apparent permeability
                                                                                                 solution for 15–20 minutes, after which the electrodes were      (Papp) determination
                                                                                                 rinsed with demi-water and left to dry ambiently.                Previously, we reported a method for assessing the barrier
                                                                                                                                                                  integrity of an OrganoPlate-grown tubule based on perfusing
                                                                                                 Cell culture                                                     a tube with a fluorescent dye and observing its radial
                                                                                                                                                                  diffusion across the tubule into the ECM.26 In short,
                                                                                                 Caco-2 cells (Sigma, DE, 86010202) were cultured in complete
                                                                                                                                                                  complete cell medium was supplemented with 10 kDa FITC
                                                                                                 EMEM medium (ATCC, US, 30-2003) with 10% FBS (foetal
                                                                                                                                                                  dextran (0.16 mg mL−1, Sigma, DE, FD10S-100MG) and 155
                                                                                                 bovine serum, ThermoFischer Scientific, US, 16140-071), 1%
                                                                                                                                                                  kDa TRITC dextran (0.16 mg mL−1, Sigma, DE, T1287-100MG)
           This article is licensed under a Creative Commons Attribution 3.0 Unported Licence.

                                                                                                 NEAA (non-essential amino acids, ThermoFischer Scientific,
                                                                                                                                                                  and added to the lumen of the Caco-2 tubules. The efflux of
                                                                                                 US, 11140050), and 1% penicillin (Sigma, DE, P4333), and
Open Access Article. Published on 15 April 2021. Downloaded on 10/25/2021 7:11:34 AM.

                                                                                                                                                                  dextran into the adjacent ECM channel was monitored using
                                                                                                 harvested for experiments between passages 47 and 70. Renal
                                                                                                                                                                  a high content fluorescent microscope (ImageXpress XLS,
                                                                                                 proximal tubule epithelial cells (RPTEC, Kidney PTEC Control
                                                                                                                                                                  Molecular Devices, US) in the FITC and TRITC channels
                                                                                                 Cells, SA7K Clone, Sigma, DE, 44 MTOX1030) were cultured
                                                                                                                                                                  using a 4× objective. The observation window with area of
                                                                                                 in MEME complete medium (Sigma, DE, M4526) with RPTEC
                                                                                                                                                                  interest of each chip (Fig. 1e, well B2) was imaged every
                                                                                                 complete supplement (Sigma, DE, MTOXRCSUP), L-glutamine
                                                                                                                                                                  minute for 12 minutes. The images were processed by
                                                                                                 at 1.87 mM (Sigma, DE, G7513), and amphotericin B at 14 ng
                                                                                                                                                                  extracting the average fluorescence values of the top
                                                                                                 ml−1 (Sigma, DE, A2942), and harvested for experiments at
                                                                                                                                                                  perfusion channel divided by the average fluorescence value
                                                                                                 passage 3. All cells were cultured at 37 °C, 5% CO2, 85%
                                                                                                                                                                  of the gel channel for each chip and timepoint using the Fiji
                                                                                                 relative humidity (RH) while medium was refreshed every 2–3
                                                                                                                                                                  software.38 This resulted in a curve of the normalized ratio of
                                                                                                 days and cells were passaged or harvested at 80–90%
                                                                                                                                                                  dextran in the gel channel over time (see ESI† Fig. S4c and
                                                                                                 confluency. Cells were resuspended at 10 000 cells per μL
                                                                                                                                                                  d). We determined the apparent permeability (Papp) value
                                                                                                 prior to seeding. 3-Lane 40 OrganoPlates (Mimetas, NL, 4003-
                                                                                                                                                                  using the following formula:
                                                                                                 400-B) were used to culture the organ-on-a-chip models
                                                                                                 presented in this work.                                                                   ΔCreceiver × V receiver cm
                                                                                                                                                                                 P app ¼
                                                                                                                                                                                           Δt × Abarrier × Cdonor s
                                                                                                 OrganoPlate 3-lane seeding
                                                                                                                                                                  ΔCreceiver is the difference of the fluorescence intensity
                                                                                                 Tubules were cultured in a 3-lane OrganoPlate based on
                                                                                                 protocols previously described.26 Briefly, ECM was prepared      measured in the ECM channel between t = 0 and t = 10
                                                                                                 by mixing in 8 : 1 : 1 ratio collagen-I (5 mg mL−1, AMSbio,      minutes, Vreceiver is the volume of the measured region in the
                                                                                                 GB, Cultrex 3D collagen I rat tail, #3447-020-01), HEPES         ECM channel (h*w*l = 220 μm × 2304 μm × 204 μm = 1.03 ×
                                                                                                 (1M, ThermoFischer Scientific, US, 15630-122, pH 7.2–7.5)        10−4 cm3), Δt is the time between start and finish (10
                                                                                                 and NaHCO3 (37 g L−1 Sigma, DE, H6648) on ice. The ECM           minutes), Abarrier (0.0057 cm2) is the surface of the ECM
                                                                                                 mixture was kept on ice and used within 10 min. 3-Lane           interface with the medium channel, and Cdonor is the
                                                                                                 OrganoPlates were filled by dispensing 1.75 μL of the ECM        fluorescence intensity measured in the top perfusion
                                                                                                 gel into the gel inlet of each chip (Fig. 1e, well B1). The      channel. This formula assumes linearity of the curve which is
                                                                                                 plates were incubated at 37 °C, 5% CO2, and 85% RH for           generally maintained when Creciever is below 10% of Cdonor, as
                                                                                                 15 minutes to let the ECM polymerize. After polymerization,      this means the concentration gradient and resulting flux is
                                                                                                 50 μL of HBSS (Sigma, DE, H6648) was pipetted in the gel         not significantly influenced by the increasing concentration
                                                                                                 inlet wells. The plates were placed in the incubator for         in the receiver channel. The fluorescence intensity is
                                                                                                 further polymerization overnight. For tubule seeding, 2 μL       assumed to be proportional to the concentration of the
                                                                                                 of a cell suspension (10 000 cells per μL) was dispensed         dextran dye, which is valid when the perfusion channel
                                                                                                 into the top perfusion inlet well (Fig. 1e, well A1), followed   intensity does not oversaturate the image.
                                                                                                 by 50 μL of medium. Tubes were seeded in 35 chips per
                                                                                                 plate, while cells were omitted in 5 control chips. The          Toxicant exposure
                                                                                                 plates were incubated at a 75° angle to let the cells            For toxicant exposure experiments, Caco-2 tubules were
                                                                                                 sediment against the ECM (see Fig. S4a and b†). After 2          seeded in a 3-lane OrganoPlate and grown to confluency over
                                                                                                 hours, we verified that the cells were attached to the ECM       4 days. Staurosporine (Sigma, DE, S440) was dissolved at
                                                                                                 by phase contrast microscopy and dispensed 50 μL of              decreasing concentrations (10 μM, 2.5 μM, 625 nM, 156 nM,
                                                                                                 medium on the remaining perfusion inlets and outlets             39 nM, 9.7 nM and 0 μM) in complete Caco-2 medium
                                                                                                 (Fig. 1e, well A3, C1 and C2). Perfusion was subsequently        adjusted to 0.01% DMSO (Sigma, D8418-100ML). Prior to
                                                                                                 started by placing the plates on an interval rocker              exposure, TEER measurements and a BI assay were
                                                                                                 (OrganoFlow, Mimetas, NL) set at a 7° inclination and 8          performed on all chips. After the measurements, medium
                                                                                                 minute interval inside an incubator. Medium was refreshed        was substituted with medium containing the staurosporine
                                                                                                 every 2–3 days.                                                  concentration range, using 0.01% DMSO for control chips

                                                                                                 This journal is © The Royal Society of Chemistry 2021                                            Lab Chip, 2021, 21, 1676–1685 | 1679
View Article Online

                                                                                                 Paper                                                                                                             Lab on a Chip

                                                                                                 without cells. Subsequently, the plate was placed in an          entire conduit, it divides the conduit into three lanes: a
                                                                                                 OrganoTEER instrument, on an interval rocker, in an              central ECM lane and two flanking perfusion lanes. This
                                                                                                 incubator (37 °C, 5% CO2, 85% RH). A TEER time-lapse             patterning and subsequent gelation of the gel obviates the
                                                                                                 measurement was started immediately (t = 0) with                 need for an artificial membrane barrier. Caco-2 cells seeded
                                                                                                 measurements every 5 minutes for the first 40 minutes, and       into one of the channels are let to form a tubule with a
                                                                                                 every 16 minutes afterwards until t = 155 min. A second BI       perfusable lumen (Fig. 1b). Gravity driven flow through the
                                                                                                 assay was performed after 20 hours.                              channels was achieved by placing the OrganoPlate on an
                                                                                                                                                                  interval rocker platform that tilted the plate at a given angle,
                                                                                                 Inflammatory cytokine exposure                                   which was reversed at determined intervals. The inlay in
           This article is licensed under a Creative Commons Attribution 3.0 Unported Licence.

                                                                                                                                                                  Fig. 1c shows an artist impression of a cross section
                                                                                                 Caco-2 tubules were grown in an OrganoPlate as described
Open Access Article. Published on 15 April 2021. Downloaded on 10/25/2021 7:11:34 AM.

                                                                                                                                                                  depicting the phaseguides, the luminal side of the tube and
                                                                                                 above. On day 4 of culture in the OrganoPlate, cells were
                                                                                                                                                                  the gel. A third lane was also perfused and provided fluid
                                                                                                 triggered for 72 h with medium containing TNFα
                                                                                                                                                                  access to the basal side of the tube. Protocols for inducing
                                                                                                 (ImmunoTools, DE, cat. 11343015), INFγ (ImmunoTools, DE,
                                                                                                                                                                  Caco-2 cells to form tubular structures in the OrganoPlate
                                                                                                 cat. 11343536) and IL-1β (ImmunoTools, DE, cat. 11340013)
                                                                                                                                                                  3-lane were reported by Trietsch et al.26 and are summarized
                                                                                                 at 100 ng ml−1 each for 72 h medium with compounds was
                                                                                                                                                                  in Fig. S1a and b.†
                                                                                                 added to all inlets and outlets.
                                                                                                                                                                     Fig. 1d shows the OrganoTEER setup. The system
                                                                                                                                                                  consisted of four layers: a plate holder (i) to align the
                                                                                                 Expression analysis
                                                                                                                                                                  OrganoPlate (ii), an electrode board (iii) and a measurement
                                                                                                 Total RNA of cytokine exposed Caco-2 tubules was extracted       unit comprising the electronics (vi). The electrode board
                                                                                                 with the RNeasy Mini kit (Qiagen, DE, 74104) following the       comprised 480 electrodes dipping into 240 wells of the
                                                                                                 manufacturer's protocol, followed by reverse transcription       OrganoPlate (see Fig. 1c–f). Each electrode pair inserted into
                                                                                                 using SuperScript™ IV First-Strand Synthesis System (Thermo      a single well comprises an actuation and a measurement
                                                                                                 Fisher, US, 18091050) or M-MLV reverse transcriptase (Thermo     electrode. The plate was placed in the plate holder and the
                                                                                                 Fisher, US, 28025013) and random primers (Invitrogen, US,        electrode board was inserted on top with electrodes dipping
                                                                                                 48190011) according to manufacturer's protocols. Quantitative    into the medium in the wells of the OrganoPlate (see Fig. 1f).
                                                                                                 PCR was carried out on a Roche Lightcycler 96 using FastStart    Subsequently, an electronic measurement module was
                                                                                                 Essential DNA Green Master (Roche, CH, 06402712001). The         attached to the electrode board through high density
                                                                                                 following primers were used for amplification: IL-8 F: CAAGAG    mezzanine connectors. The electronics comprise 12
                                                                                                 CCAGGAAGAAACCA, IL-8 R: ACTCCTTGGCAAAACTGCAC,                    independent impedance analysis units, connected to 80 tubes
                                                                                                 ACTB F: CTCTTCCAGCCTTCCTTCCT, ACTB R: AGCACTGTGTT                across 40 chips via a set of multiplexers, enabling rapid
                                                                                                 GGCGTACAG. Accompanying software (LightCycler® 96,               measurement of the impedance spectrum of all tubes on a
                                                                                                 Roche, CH) was used for the data analysis. Relative              plate.
                                                                                                 quantification was performed in all the analyses.                   Electrode pairs were inserted into the cell culture
                                                                                                                                                                  medium, which acted as an electrolyte addressing either the
                                                                                                 ELISA                                                            apical or the basal side of the tubules. Fig. 1c shows a cross
                                                                                                 After 72 hour inflammatory cytokine exposure, Caco-2             section of the microfluidics well B2 with a conceptual
                                                                                                 medium was collected and stored at −80 °C until the time of      drawing of how impedance was measured over the
                                                                                                 the assay. The concentration of IL-8 in the culture medium       membrane. Fig. 1e shows a top view of electrodes addressing
                                                                                                 was measured using the Human IL-8/CXCL8 DuoSet (R&D              the luminal and the gel channel, respectively. Fig. 1f shows a
                                                                                                 Systems, US, DY208-05) according to the manufacturer's           cross-section of the entire plate along wells A1 B1 and C1 in.
                                                                                                 protocol.                                                        The electrodes inserted into the in- and outlets of the same
                                                                                                                                                                  tube were short circuited to leverage the symmetry of the
                                                                                                 Results                                                          setup, lowering the electrical resistance along the
                                                                                                                                                                  microfluidic channels. This increases the frequency range
                                                                                                 OrganoTEER setup                                                 unaffected by parasitics. A video describing the setup and its
                                                                                                 The OrganoTEER was designed to electrically interrogate cells    handling is added as Video S1.†
                                                                                                 cultured in the OrganoPlate. In this work, we report on             The measurement unit was controlled via dedicated
                                                                                                 measuring TEER in the OrganoPlate 3-lane. This OrganoPlate       software as shown in ESI† Fig. S1a and b. The software
                                                                                                 comprises 40 fluidically isolated and individually addressable   allowed for simple selection of ranges of tubes or chips, as
                                                                                                 chips integrated at the bottom of a 384 well plate (Fig. 1a).    well as settings for time-lapse and measurement precision.
                                                                                                 Each chip features three parallel lanes delineated by two        The integrated impedance analyser was capable of measuring
                                                                                                 phaseguides39 on the bottom surface of the channel network       frequencies between 0.1 Hz and 1 MHz. The system,
                                                                                                 (Fig. 1c, insert). The phaseguides constrain the ECM pre-        including software setup, could be assembled in less than a
                                                                                                 cursor introduced into the chip to a defined lane by surface     minute. Preconfigured protocols could probe 40 tubules,
                                                                                                 tension. Because the phaseguide-patterned ECM spans the          including data processing, in 45 seconds.

                                                                                                 1680 | Lab Chip, 2021, 21, 1676–1685                                           This journal is © The Royal Society of Chemistry 2021
View Article Online

                                                                                                 Lab on a Chip                                                                                                                          Paper

                                                                                                    Depending on the required precision, parameters could be              technical repeats lies at 2% or lower depending on the
                                                                                                 adjusted to balance speed and precision as required. The                 absolute TEER value, showing robustness of both the
                                                                                                 software allowed averaging of multiple datapoints as well as             biological model as well as the measurement system.
                                                                                                 visualization of time-lapse measurement series.
                                                                                                    To prevent undesirable heating of cultured cells, electronic          Real-time drug response testing
                                                                                                 components with minimal power consumption were selected
                                                                                                                                                                          In a subsequent experiment, we assessed the barrier function of
                                                                                                 and linked to an aluminium heatsink. To facilitate assembly
                                                                                                                                                                          Caco-2 tubules in response to exposure to staurosporine.
                                                                                                 of the OrganoPlate, the instrument features visual and
                                                                                                                                                                          Staurosporine is a pan-kinase inhibitor known to disrupt the
                                                                                                 physical guiding cues.
           This article is licensed under a Creative Commons Attribution 3.0 Unported Licence.

                                                                                                                                                                          epithelial barrier. Previously, we reported increased leakage of a
                                                                                                    The OrganoTEER was designed to operate in the highly
                                                                                                                                                                          fluorescence marker upon exposure to staurosporine.26 In this
                                                                                                 humidified environment of CO2 incubators at 37 °C and
Open Access Article. Published on 15 April 2021. Downloaded on 10/25/2021 7:11:34 AM.

                                                                                                                                                                          work, the fluorescent-based observations acquired after 24 h of
                                                                                                 minimally thermally load the incubator. For time-lapse
                                                                                                                                                                          exposure were compared with the TEER measurements (Fig. 3a)
                                                                                                 measurements with cells under perfusion, the OrganoTEER
                                                                                                                                                                          after 1, 6 and 24 hours of exposure, respectively. In addition, Papp
                                                                                                 could be secured on a tray of an OrganoFlow using an
                                                                                                                                                                          values were calculated based on leakage of fluorescently labelled
                                                                                                 adapter.
                                                                                                                                                                          10 kDa and 155 kDa dextran as illustrated in ESI† Fig. S4c and
                                                                                                                                                                          d. TEER values after 6 and 24 hours of exposure underwent a
                                                                                                 Caco-2 and RPTEC TEER measurements                                       steep decline from 357 ± 21 Ω cm2 at 0 mM and 6 hours to 0.1 ±
                                                                                                                                                                          0.1 Ω cm2 at 625 mM and 6 hours of staurosporine exposure.
                                                                                                 Impedance spectra of the gut Caco-2 and kidney RPTEC
                                                                                                                                                                          For 1 hour of exposure the decline in TEER was less pronounced,
                                                                                                 tubules were acquired at day 4 and 5 respectively after
                                                                                                                                                                          reaching a low plateau value of 52.6 ± 7.8 Ω cm2 at 10 mM. In
                                                                                                 seeding (Fig. 2a and b). TEER values were determined by
                                                                                                                                                                          contrast, the Papp measurement following a 24 hour exposure
                                                                                                 curve fitting through the measurement points in the 0.1 Hz
                                                                                                                                                                          showed measurable effects only for concentrations of 156 nM
                                                                                                 to 1 MHz spectral range based on an equivalent circuit model
                                                                                                                                                                          and above. Below this concentration, no significant difference in
                                                                                                 described in Fig. S3b,† with the fitting methodology
                                                                                                                                                                          Papp was observed. This demonstrates that TEER is a
                                                                                                 described in ESI† S1. TEER values were normalized to Ω cm2
                                                                                                                                                                          significantly more sensitive measure of permeability modulation
                                                                                                 by multiplying the estimated resistance in Ω with the area of
                                                                                                                                                                          than assays based on fluorescent-reporters.
                                                                                                 the ECM meniscus (Abarrier, 0.0057 cm2). As depicted in
                                                                                                                                                                              Next, we assessed real-time barrier disruption of tubules in
                                                                                                 Fig. 2c, Caco-2 tubules were found to have an average TEER
                                                                                                                                                                          a complete plate (35 tubules) over a period of 25 hours
                                                                                                 value of 588 Ω cm2, with a measured coefficient of variation
                                                                                                                                                                          (Fig. 3b). Measurements were performed every 4 minutes for
                                                                                                 (CV) of 1.36% (7.8 Ω cm2). In contrast, the more permeable
                                                                                                                                                                          the first 45 minutes, followed by one measurement every 16
                                                                                                 kidney proximal model RPTEC exhibited an average 6.4 ±
                                                                                                                                                                          minutes for the subsequent 160 minutes and finally one
                                                                                                 0.13 Ω cm2 with a CV of 2.03% (0.13 Ω cm2). These results
                                                                                                                                                                          measurement per 56 minutes until the end of the time-lapse.
                                                                                                 show that the device can assess the integrity of tubules with
                                                                                                                                                                          In the first 45 minutes, a steep decrease in TEER value for the
                                                                                                 a wide range of electrical properties. For both cell types, the
                                                                                                                                                                          three highest concentrations of staurosporine was observed,
                                                                                                 coefficient of variation was quantified between 3 independent
                                                                                                                                                                          whereas the lower concentration remained stable, or even
                                                                                                 experiments, with a minimum of 10 technical replicates per
                                                                                                                                                                          showed a small increase in TEER. For 1 to 3 hours a clear dose
                                                                                                 cell type per experiment. The coefficient of variation for
                                                                                                                                                                          response could be observed, whereas for exposures longer than
                                                                                                                                                                          5 hours all concentrations reached a plateau value. The time-
                                                                                                                                                                          lapse measurement showed a sawtooth pattern in high TEER
                                                                                                                                                                          values when the acquisition time is synchronized to the
                                                                                                                                                                          rocking motion of the plate (T = 0–0.75 and 2.7–24 h). It can be
                                                                                                                                                                          speculated the reversal of flow direction and peak of flow rate
                                                                                                                                                                          results in a short-term reduction of TEER, but non-biological
                                                                                                                                                                          effects such as changes in field line homogeneity due to
                                                                                                                                                                          changing liquid levels could also be a factor.

                                                                                                                                                                          Measuring inflammation with TEER

                                                                                                 Fig. 2 TEER measured on Caco-2 and RPTEC (a) impedance spectrum
                                                                                                                                                                          To further evaluate the sensitivity of our TEER setup, Caco-2
                                                                                                 of a Caco-2 tube on day 4. The orange arrow illustrates the              tubules were exposed to a cocktail of pro-inflammatory
                                                                                                 contribution of the TEER to the spectrum. The fitted curve is based on   cytokines. Increased permeability of the epithelial barrier and
                                                                                                 an equivalent electrical model depicted as a simplified version in the   release of chemoattractant IL-8 from intestinal epithelium
                                                                                                 ESI† S3b. The full methodology is presented in ESI† data S1.2 (b).
                                                                                                                                                                          are common manifestations of inflammatory states found in
                                                                                                 Impedance spectrum and associated fitted curve of RPTEC tubule. (c)
                                                                                                 TEER values for Caco-2 and RPTEC tubes plotted with the coefficient
                                                                                                                                                                          disorders such as inflammatory bowel disease (IBD).40–44
                                                                                                 of variation estimated across 3 independent plate measurements           Here, a cocktail of cytokines comprising TNFα, IFN and IL-1β
                                                                                                 comprising at least 10 technical replicate each (N = 3, n > 10).         was used to induce inflammation. Upon 72 hour exposure,

                                                                                                 This journal is © The Royal Society of Chemistry 2021                                                    Lab Chip, 2021, 21, 1676–1685 | 1681
View Article Online

                                                                                                 Paper                                                                                                                                Lab on a Chip
           This article is licensed under a Creative Commons Attribution 3.0 Unported Licence.
Open Access Article. Published on 15 April 2021. Downloaded on 10/25/2021 7:11:34 AM.

                                                                                                 Fig. 3 TEER response to staurosporine. (a) TEER values at 1 h, 6 h and 24 h. For various doses of staurosporine, superimposed with bar graph of
                                                                                                 permeability to 155 kDa and 10 kDa dextran at 24 h. TEER data immediately pick up changes in permeability after lowest dose exposure of
                                                                                                 staurosporine, while fluorescent marker leakage picks up changes in permeability only for concentrations down to 156 nM. (b) Timelapse of TEER
                                                                                                 measurements on Caco-2 tubules upon staurosporine exposure. Measurements were taken in an incubator, while under rocker-based perfusion.
                                                                                                 Immediate response to high concentrations (625 nM, 2.5 μM and 10 μM) are visible within 40 minutes, whereas response to lower concentrations
                                                                                                 becomes visible upon 1–3 hours of exposure. Longer exposure results in plateau levels for all values. Curves are plotted with standard deviation of
                                                                                                 the mean as shaded area with the mean value as central line. Axis breaks indicate a change in sampling rate within the continuous acquisition. N =
                                                                                                 2 and n = 3–5 for the TEER data as well as the Papp data.

                                                                                                 TEER values of 4-day-old Caco-2 tubes were reduced by                         Discussion and conclusion
                                                                                                 approximately 50% (Fig. 4a and b). Interestingly, in
                                                                                                 experiments reported previously, fluorescent reporter-based                   We presented a technique for rapid TEER measurement of
                                                                                                 barrier integrity assays failed to pick up a reduction in barrier             epithelial tubules in OrganoPlates using dip-in electrodes
                                                                                                 integrity in similar conditions.45 To further investigate the                 and impedance spectroscopy. The data acquisition
                                                                                                 inflammatory state of the epithelium, we assessed the release                 parameters can be programmed to satisfy requirements of
                                                                                                 of IL-8 with ELISA and confirmed expression by qPCR                           measurement speed and precision, as well as to
                                                                                                 (Fig. 4c and d). Both qPCR and ELISA showed a strongly                        accommodate long-term live cell monitoring in an incubator
                                                                                                 increased production of IL-8 by the inflamed epithelial                       environment. Data acquisition and extraction was automated
                                                                                                 tubules that correlated with reduction in TEER values. The                    to increase consistency and throughput of measurements.
                                                                                                 assays demonstrated high sensitivity and capacity of TEER                     We demonstrated the use of the device for assessing barrier
                                                                                                 for studying inflammation in the OrganoPlate.                                 function of Caco-2 and RPTEC tubes. We showed its

                                                                                                 Fig. 4 Reduction of TEER values due to inflammation: TEER values of Caco-2 tubules before and after exposure to a cocktail of cytokines (TNFα, IFN
                                                                                                 and IL-1β) for 72 hours show significant reduction in TEER values both in absolute value (a) as well as percentage change (b). ELISA (c) and qPCR (d)
                                                                                                 analysis showed release and expression of IL-8 in response to cytokine treatment, confirming that tubes are in an inflamed state. All graphs are plotted
                                                                                                 using standard deviation of the mean. N = 4 and n = 2–4 for the TEER data, N = 5 and n = 3–8 for the ELISA. N = 3 for the qPCR data.

                                                                                                 1682 | Lab Chip, 2021, 21, 1676–1685                                                           This journal is © The Royal Society of Chemistry 2021
View Article Online

                                                                                                 Lab on a Chip                                                                                                                     Paper

                                                                                                 usefulness      by    presenting     drug-induced     time-lapse   while reducing variation commonly introduced through
                                                                                                 permeability measurements and demonstrated increased               multiplication of reagent preparation, handling, cell source
                                                                                                 sensitivity in comparison to fluorescence-based leakage            and passaging.
                                                                                                 studies. Finally, we succeeded in electrically measuring              Here we performed measurements on a single tubule per
                                                                                                 induced inflammation effects in intestinal tubules.                chip. However, we envision more complex models going
                                                                                                    The combination of 3D tube cultures without artificial          forward. For instance, an endothelial and an epithelial
                                                                                                 membranes with TEER measurements, on 40 chips in                   barrier could be modelled and interrogated in a single chip.
                                                                                                 parallel, is a unique feature of this platform. Using the          In such a setup, the first perfusion channel would comprise
                                                                                                 OrganoPlate, cells are cultured directly against an ECM,           an epithelial tubule, whereas the second perfusion channel
           This article is licensed under a Creative Commons Attribution 3.0 Unported Licence.

                                                                                                 which acts as an electrolyte. By not using a porous                comprises a blood vessel. Such a setup allows to interrogate
Open Access Article. Published on 15 April 2021. Downloaded on 10/25/2021 7:11:34 AM.

                                                                                                 membrane, our setup allows to directly measure the TEER of         the two barriers separately, while still permitting cross talk
                                                                                                 the cell layer only, avoiding skewing the results by membrane      between the tissues. We also anticipate the use of the
                                                                                                 characteristics such as pore size and density, as well as          measurement setup to assess slight variations in culture
                                                                                                 compensation for ECM coating and/or deposition. By                 conditions induced by proliferation of cells as well as (trans)
                                                                                                 removing the need to account for pore size in relation to          migration of cells over epithelial or endothelial membranes.
                                                                                                 cellular dimensions and ECM properties, we reduce the bias            Live monitoring of cellular barriers is valuable in quality
                                                                                                 due to current line distribution in and around the cells, as       control of growing healthy tubules, as well as in investigation
                                                                                                 well as potential bias induced by different methods for area       of toxicological, inflammatory, and pathological processes.
                                                                                                 correction of porous membranes.                                    The ability to monitor dozens of tissues in parallel, combined
                                                                                                    The most common method for reporting TEER values is to          with the small footprint of the device makes it ideal as a
                                                                                                 generate area-corrected values in Ω cm2 (as typically done for     primary readout in compound dilution series and large drug
                                                                                                 TEER measurements on membrane inserts). Here, we                   screens. We also envision future development including an
                                                                                                 reported both area-corrected values as well as relative changes    automated setup, with either the OrganoPlate or the TEER
                                                                                                 in TEER. The advantage of area-corrected values is that it         device robotically manipulated to allow repeated
                                                                                                 allows for comparing values between different platforms.           measurements of multiple OrganoPlates. The measurement
                                                                                                 However, care should still be taken when interpreting these        speed from a couple of seconds down to less than 0.1 second
                                                                                                 values as current density gradients could affect the measured      for a single chip offers unique ways of measuring fast kinetic
                                                                                                 values. As reported by Yeste, especially low TEER values could     effects. Potentially, resistance and capacitive measurements
                                                                                                 be overestimated, when the geometrical correction is not           could open the door for active ion flow measurements.
                                                                                                 corrected for current density gradients.46                            In summary, we have developed a fast, easy to use tool for
                                                                                                    We observed much higher TEER values in the Caco-2 gut           parallel TEER measurements in perfused epithelial tubules
                                                                                                 model than in the renal proximal tubules, a difference which       that are devoid of artificial membranes. The machine adds a
                                                                                                 is reflected in the physiological function of these organs.        tool to the organ-on-a-chip toolbox, allowing for routine
                                                                                                 Kidney proximal tubules have TEER values ranging from 6 to         adoption of the technology by any end-user in both academic
                                                                                                 10 Ω cm2 in vivo,47 while TEER values of Caco-2 monolayers         as well as industrial settings. TEER measurements can be
                                                                                                 are typically around 400 Ω cm2.4 These known cell models           combined with other commonly used assays to complement
                                                                                                 serve as a good reference for our system's dynamic range and       physiologically relevant organ chip models with quantitative
                                                                                                 precision. The theoretical limit of detection of the               analysis for the development of better drugs and therapies.
                                                                                                 OrganoTEER can be approximated based on the
                                                                                                 characteristic frequency fc of a cell barrier. With an estimated
                                                                                                 parasitic cut-off frequency fp of 100 kHz and cell capacitance     Author contributions
                                                                                                 estimated above 1 μF cm−2, the theoretical limit of detection
                                                                                                                                                                    A. N., P. V., and S. T. invented the OrganoTEER concept. A.
                                                                                                 of our method would be approximately 1.6 Ω cm2.
                                                                                                                                                                    N., F. S., P. V., M. B., K. L., S. W., K. D., and S. T. contributed
                                                                                                    In this paper we have shown that the machine can
                                                                                                                                                                    to the design and engineering of the instrument and
                                                                                                 measure 40 tubules in parallel. However, the apparatus is
                                                                                                                                                                    software. A. N., F. S., K. K., D. K., and M. H. planned,
                                                                                                 equipped to measure many more datapoints. For instance,
                                                                                                                                                                    performed, and analysed experiments. K. D., T. H., H. L., J. J.,
                                                                                                 the setup could measure two tubules per chip, measuring up
                                                                                                                                                                    P. V., and S. T. supervised the work and edited the
                                                                                                 to 80 tubules in parallel. Changing of the electrode board
                                                                                                                                                                    manuscript.
                                                                                                 and OrganoPlate layout would even enable measurement of
                                                                                                 up to 128 tubules. These high numbers of tubules measured
                                                                                                 in parallel are important not only for industrial scale studies,   Conflicts of interest
                                                                                                 but also for academic research. Availability of adequate
                                                                                                 number of datapoints to acquire proper controls and relevant       A. N., F. S., K. K., D. K., M. H., J. J., K. D., H. L., P. V., and S.
                                                                                                 numbers of technical replicates allows for performing TEER-        T. are employees of Mimetas B. V., which markets the
                                                                                                 based experimental studies with sufficient statistical power.      OrganoPlate and OrganoTEER. T. H., J. J., P. V. and S. T. are
                                                                                                 As a result, a single experiment can yield significant results,    shareholders of Mimetas B. V.

                                                                                                 This journal is © The Royal Society of Chemistry 2021                                              Lab Chip, 2021, 21, 1676–1685 | 1683
View Article Online

                                                                                                 Paper                                                                                                                  Lab on a Chip

                                                                                                 Acknowledgements                                                     21 P. Shah, J. V. Fritz, E. Glaab, M. S. Desai, K. Greenhalgh, A.
                                                                                                                                                                         Frachet, M. Niegowska, M. Estes, C. Jäger, C. Seguin-Devaux,
                                                                                                 This project has received funding from the European Union's             F. Zenhausern and P. Wilmes, Nat. Commun., 2016, 7, 1–15.
                                                                                                 Horizon 2020 research and innovation programme under the             22 C. Probst, S. Schneider and P. Loskill, Curr. Opin. Biomed.
                                                                                                 Marie Sklodowska-Curie grant agreements No. 641639 and                  Eng., 2018, 6, 33–41.
                                                                                                 674983 and SME instrument action No. 848429.                         23 T. S. Khire, B. J. Nehilla, J. Getpreecharsawas, M. E.
                                                                                                                                                                         Gracheva, R. E. Waugh and J. L. McGrath, Biomed.
                                                                                                 References                                                              Microdevices, 2018, 20(1), 11.
                                                                                                                                                                      24 C. M. Lo, C. R. Keese and I. Giaever, Exp. Cell Res.,
           This article is licensed under a Creative Commons Attribution 3.0 Unported Licence.

                                                                                                  1 R. Cecchelli, V. Berezowski, S. Lundquist, M. Culot, M.              1999, 250, 576–580.
Open Access Article. Published on 15 April 2021. Downloaded on 10/25/2021 7:11:34 AM.

                                                                                                    Renftel, M. Dehouck and L. Fenart, Nat. Rev. Drug Discovery,      25 O. Y. F. Henry, R. Villenave, M. J. Cronce, W. D.
                                                                                                    2007, 6, 650–661.                                                    Leineweber, M. A. Benz and D. E. Ingber, Lab Chip,
                                                                                                  2 M. Odenwald and J. Turner, Nat. Rev. Gastroenterol. Hepatol.,        2017, 17, 2264–2271.
                                                                                                    2016, 14, 9–21.                                                   26 S. J. Trietsch, E. Naumovska, D. Kurek, M. C. Setyawati,
                                                                                                  3 M. Wilmer, C. Ng, H. Lanz, P. Vulto, L. Suter-Dick and R.            M. K. Vormann, K. J. Wilschut, H. L. Lanz, A. Nicolas, C. P.
                                                                                                    Masereeuw, Trends Biotechnol., 2016, 34, 156–170.                    Ng, J. Joore, S. Kustermann, A. Roth, T. Hankemeier, A.
                                                                                                  4 B. Srinivasan, A. Kolli, M. Esch, H. Abaci, M. Shuler and J.         Moisan and P. Vulto, Nat. Commun., 2017, 8, 262.
                                                                                                    Hickman, J. Lab. Autom., 2015, 20, 107–126.                       27 E. Naumovska, G. Aalderink, C. Wong Valencia, K. Kosim, A.
                                                                                                  5 F. Asphahani and M. Zhang, Analyst, 2007, 132, 835.                  Nicolas, S. Brown, P. Vulto, K. S. Erdmann and D. Kurek, Int.
                                                                                                  6 P. Secker, N. Schlichenmaier, M. Beilmann, U. Deschl and D.          J. Mol. Sci., 2020, 21, 4964.
                                                                                                    Dietrich, Arch. Toxicol., 2019, 93, 1965–1978.                    28 L. Gijzen, D. Marescotti, E. Raineri, A. Nicolas, H. L. Lanz, D.
                                                                                                  7 V. van Duinen, S. Trietsch, J. Joore, P. Vulto and T.                Guerrera, R. van Vught, J. Joore, P. Vulto, M. C. Peitsch, J.
                                                                                                    Hankemeier, Curr. Opin. Biotechnol., 2015, 35, 118–126.              Hoeng, G. Lo Sasso and D. Kurek, SLAS Technol., 2020, 25,
                                                                                                  8 B. Srinivasan, A. Kolli, M. Esch, H. Abaci, M. Shuler and J.         585–597.
                                                                                                    Hickman, J. Lab. Autom., 2015, 20, 107–126.                       29 M. K. Vormann, L. Gijzen, S. Hutter, L. Boot, A. Nicolas, A.
                                                                                                  9 O. Henry, R. Villenave, M. Cronce, W. Leineweber, M. Benz            van den Heuvel, J. Vriend, C. P. Ng, T. T. G. Nieskens, V. van
                                                                                                    and D. Ingber, Lab Chip, 2017, 17, 2264–2271.                        Duinen, B. de Wagenaar, R. Masereeuw, L. Suter-Dick, S. J.
                                                                                                 10 M. Odijk, A. van der Meer, D. Levner, H. Kim, M. van der             Trietsch, M. Wilmer, J. Joore, P. Vulto and H. L. Lanz, AAPS
                                                                                                    Helm, L. Segerink, J. Frimat, G. Hamilton, D. Ingber and A.          J., 2018, 20(5), 90.
                                                                                                    van den Berg, Lab Chip, 2015, 15, 745–752.                        30 J. Vriend, T. T. G. Nieskens, M. K. Vormann, B. T. van den
                                                                                                 11 M. W. van der Helm, M. Odijk, J. P. Frimat, A. D. van der            Berge, A. van den Heuvel, F. G. M. Russel, L. Suter-Dick,
                                                                                                    Meer, J. C. T. Eijkel, A. van den Berg and L. I. Segerink,           H. L. Lanz, P. Vulto, R. Masereeuw and M. J. Wilmer, AAPS
                                                                                                    Biosens. Bioelectron., 2016, 85, 924–929.                            J., 2018, 20, 1–13.
                                                                                                 12 M. W. van der Helm, O. Y. F. Henry, A. Bein, T. Hamkins-Indik,    31 F. Schutgens, M. B. Rookmaaker, T. Margaritis, A. Rios, C.
                                                                                                    M. J. Cronce, W. D. Leineweber, M. Odijk, A. D. van der Meer,        Ammerlaan, J. Jansen, L. Gijzen, M. Vormann, A. Vonk, M.
                                                                                                    L. I. Segerink and D. E. Ingber, Lab Chip, 2019, 19, 452–463.        Viveen, F. Y. Yengej, S. Derakhshan, K. M. de Winter-de
                                                                                                 13 O. Henry, R. Villenave, M. Cronce, W. Leineweber, M. Benz            Groot, B. Artegiani, R. van Boxtel, E. Cuppen, A. P. A.
                                                                                                    and D. Ingber, Lab Chip, 2017, 17, 2264–2271.                        Hendrickx, M. M. van den Heuvel-Eibrink, E. Heitzer, H.
                                                                                                 14 I. Maschmeyer, T. Hasenberg, A. Jaenicke, M. Lindner, A. K.          Lanz, J. Beekman, J. L. Murk, R. Masereeuw, F. Holstege, J.
                                                                                                    Lorenz, J. Zech, L. A. Garbe, F. Sonntag, P. Hayden, S.              Drost, M. C. Verhaar and H. Clevers, Nat. Biotechnol.,
                                                                                                    Ayehunie, R. Lauster, U. Marx and E. M. Materne, Eur. J.             2019, 37, 303–313.
                                                                                                    Pharm. Biopharm., 2015, 95, 77–87.                                32 A. Petrosyan, P. Cravedi, V. Villani, A. Angeletti, J. Manrique,
                                                                                                 15 P. Zeller, A. Legendre, S. Jacques, M. J. Fleury, F. Gilard, G.      A. Renieri, R. E. De Filippo, L. Perin and S. Da Sacco, Nat.
                                                                                                    Tcherkez and E. Leclerc, J. Appl. Toxicol., 2017, 37, 287–295.       Commun., 2019, 10, 1–17.
                                                                                                 16 P. Shah, J. V. Fritz, E. Glaab, M. S. Desai, K. Greenhalgh, A.    33 V. van Duinen, D. Zhu, C. Ramakers, A. J. van Zonneveld,
                                                                                                    Frachet, M. Niegowska, M. Estes, C. Jäger, C. Seguin-Devaux,         P. Vulto and T. Hankemeier, Angiogenesis, 2019, 22,
                                                                                                    F. Zenhausern and P. Wilmes, Nat. Commun., 2016, 7, 1–15.            157–165.
                                                                                                 17 Y. I. Wang, H. E. Abaci and M. L. Shuler, Biotechnol. Bioeng.,    34 V. Van Duinen, A. Van Den Heuvel, S. J. Trietsch, H. L. Lanz,
                                                                                                    2017, 114, 184–194.                                                  J. M. Van Gils, A. J. Van Zonneveld, P. Vulto and T.
                                                                                                 18 R. Booth and H. Kim, Lab Chip, 2012, 12, 1784–1792.                  Hankemeier, Sci. Rep., 2017, 7, 1–11.
                                                                                                 19 L. M. Griep, F. Wolbers, B. De Wagenaar, P. M. Ter Braak,         35 N. R. Wevers, D. G. Kasi, T. Gray, K. J. Wilschut, B. Smith, R.
                                                                                                    B. B. Weksler, I. A. Romero, P. O. Couraud, I. Vermes, A. D.         Vught, F. Shimizu, Y. Sano, T. Kanda, G. Marsh, S. J.
                                                                                                    Van Der Meer and A. Van Den Berg, Biomed. Microdevices,              Trietsch, P. Vulto, H. L. Lanz and B. Obermeier, Fluids
                                                                                                    2013, 15, 145–150.                                                   Barriers CNS, 2018, 15, 23.
                                                                                                 20 O. Y. F. Henry, R. Villenave, M. J. Cronce, W. D. Leineweber,     36 A. Moisan, F. Michielin, W. Jacob, S. Kronenberg, S. Wilson,
                                                                                                    M. A. Benz and D. E. Ingber, Lab Chip, 2017, 17, 2264–2271.          B. Avignon, R. Gerard, F. Benmansour, C. McIntyre, G.

                                                                                                 1684 | Lab Chip, 2021, 21, 1676–1685                                                This journal is © The Royal Society of Chemistry 2021
View Article Online

                                                                                                 Lab on a Chip                                                                                                                           Paper

                                                                                                      Meneses-Lorente, M. Hasmann, A. Schneeweiss, M. Weisser                  Hoeng, G. Lo Sasso and D. Kurek, SLAS Technol., 2020, 25,
                                                                                                      and C. Adessi, Mol. Cancer Ther., 2018, 17, 1464–1474.                   585–597.
                                                                                                 37   Y. Koo, B. T. Hawkins and Y. Yun, Sci. Rep., 2018, 8, 1.            42   G. Muzes, B. Molnár, Z. Tulassay and F. Sipos, World J.
                                                                                                 38   J. Schindelin, I. Arganda-Carreras, E. Frise, V. Kaynig, M.              Gastroenterol., 2012, 18, 5848–5861.
                                                                                                      Longair, T. Pietzsch, S. Preibisch, C. Rueden, S. Saalfeld, B.      43   S. H. Murch, C. P. Braegger, J. A. Walker-Smith and T. T.
                                                                                                      Schmid, J. Y. Tinevez, D. J. White, V. Hartenstein, K. Eliceiri,         MacDonald, Gut, 1993, 34, 1705–1709.
                                                                                                      P. Tomancak and A. Cardona, Nat. Methods, 2012, 9,                  44   R. Daig, T. Andus, E. Aschenbrenner, W. Falk, J. Schölmerich
                                                                                                      676–682.                                                                 and V. Gross, Gut, 1996, 38, 216–222.
                                                                                                 39   P. Vulto, S. Podszun, P. Meyer, C. Hermann, A. Manz and             45   L. Gijzen, D. Marescotti, E. Raineri, A. Nicolas, H. L. Lanz, D.
           This article is licensed under a Creative Commons Attribution 3.0 Unported Licence.

                                                                                                      G. A. Urban, Lab Chip, 2011, 11, 1596–1602.                              Guerrera, R. van Vught, J. Joore, P. Vulto, M. C. Peitsch, J.
Open Access Article. Published on 15 April 2021. Downloaded on 10/25/2021 7:11:34 AM.

                                                                                                 40   C. Beaurivage, E. Naumovska, Y. X. Chang, E. D. Elstak, A.               Hoeng, G. Lo Sasso and D. Kurek, SLAS Technol., 2020, 25,
                                                                                                      Nicolas, H. Wouters, G. van Moolenbroek, H. L. Lanz, S. J.               585–597.
                                                                                                      Trietsch, J. Joore, P. Vulto, R. A. J. Janssen, K. S. Erdmann, J.   46   J. Yeste, X. Illa, C. Gutiérrez, M. Solé, A. Guimerà and R.
                                                                                                      Stallen and D. Kurek, Int. J. Mol. Sci., 2019, 20, 5661.                 Villa, J. Phys. D: Appl. Phys., 2016, 49, 375401.
                                                                                                 41   L. Gijzen, D. Marescotti, E. Raineri, A. Nicolas, H. L. Lanz, D.    47   B. M. Denker and E. Sabath, J. Am. Soc. Nephrol., 2011, 22,
                                                                                                      Guerrera, R. van Vught, J. Joore, P. Vulto, M. C. Peitsch, J.            622–625.

                                                                                                 This journal is © The Royal Society of Chemistry 2021                                                    Lab Chip, 2021, 21, 1676–1685 | 1685
You can also read