The neural bases of tactile vitality forms and their modulation by social context - Nature
←
→
Page content transcription
If your browser does not render page correctly, please read the page content below
www.nature.com/scientificreports
OPEN The neural bases of tactile vitality
forms and their modulation
by social context
G. Rizzolatti1,2*, A. D’Alessio2, M. Marchi3 & G. Di Cesare1,4
People communicate using speech, gestures, and, less frequently, touches. An example of tactile
communication is represented by handshake. Customs surrounding handshake vary in different
cultures. In Western societies is mostly used when meeting, parting, as a sign of congratulations or at
the end of a successful business. Despite its importance in social life, the neural mechanism underlying
the affective components conveyed by handshake (“tactile vitality forms”) is unknown. Here we
combined functional magnetic resonance imaging (fMRI) and electromyography (EMG), to investigate
the neural affective activations during handshakes. We demonstrated that handshake conveying
gentle or aggressive tactile vitality forms produces a stronger activation of the dorso-central insula.
The simultaneous presence of emotional facial expressions modulates the activation of this insular
sector. Finally, we provide evidence that the cingulate cortex is involved in the processing of facial
expressions conveying different vitality forms.
Social interaction is defined as an exchange between two or more individuals. At its basis is the capacity to
evaluate the communicative, affective meaning of others’ actions and gestures. Daniel Stern called these com-
municative aspects of gestures and actions vitality a ffects1 and subsequently vitality f orms2,3. According to S tern2,
five properties characterize vitality forms: time, space, force, trajectory and direction. Thanks to this movement
gestalt, vitality forms play a double role in interpersonal interactions: the expression of vitality forms allows the
agent to communicate his attitude, while the perception of vitality forms allows the receiver to understand the
attitude of others.
It is important to stress from the outset that vitality forms are a concept completely different from emotions.
Vitality forms represent the way (“the form”) with which an action is performed, regardless of whether the action
is devoid of emotional content, so called “cold actions” like reaching, grasping, taking, giving, or it is emotion-
ally laden. An example of the latter action type could be anger. Indeed, anger might be overtly expressed or be
internalized; it might be cold or aggressive. In all these cases, the emotion is the same but its vitality forms, i.e.
the form with which is expressed, is radically different.
In a series of previous studies, we investigated the neural bases of visual and auditory vitality forms4–13. We
found that the observation of vitality forms of gentle or rude actions determines the selective activation of the
dorso-central insula4,5,12,13. In these studies we also demonstrated that the dorso-central insula is activated during
imagining as well as during the execution of actions conveying gentle or rude vitality f orms5.
Besides observation of actions and gestures of others, individuals also interact using touch. A typical exam-
ple is handshaking. Handshaking is a common greeting behavior in Western cultures. The handshake conveys
information about the affective state and the personality of an individual14,15. A “good” handshake may reveal
friendliness, sociability and dominance, whereas a “poor” handshake may reveal shyness, introversion, and
neuroticism14. A gentle or aggressive handshake may also allow the receiver to understand whether the agent
is a kind or a rude person, thus stressing the powerful role of handshaking in social i nteractions16. Considering
that the definition of vitality form by Stern concerned specifically the visual aspects of actions, we will use here
the term tactile vitality forms to describe the affective and communicative aspects of the handshake.
It is surprising that, notwithstanding the importance of the handshake in social interactions, there is no study
describing the neural basis underlying the tactile vitality forms. The main aim of the present study is to fill this
gap and to describe the brain structures involved in encoding handshake tactile vitality forms. The second aim
is to investigate whether and how interpersonal context, conveyed by facial expression, can modulate these brain
1
Neuroscience Unit, Department of Medicine and Surgery, University of Parma, Parma, Italy. 2Istituto di
Neuroscienze, Consiglio Nazionale Delle Ricerche, Parma, Italy. 3Department of Computer Science, University
of Milan, Milan, Italy. 4Cognitive Architecture for Collaborative Technologies Unit, Italian Institute of Technology,
Genova, Italy. *email: giacomo.rizzolatti@unipr.it
Scientific Reports | (2021) 11:9095 | https://doi.org/10.1038/s41598-021-87919-z 1
Vol.:(0123456789)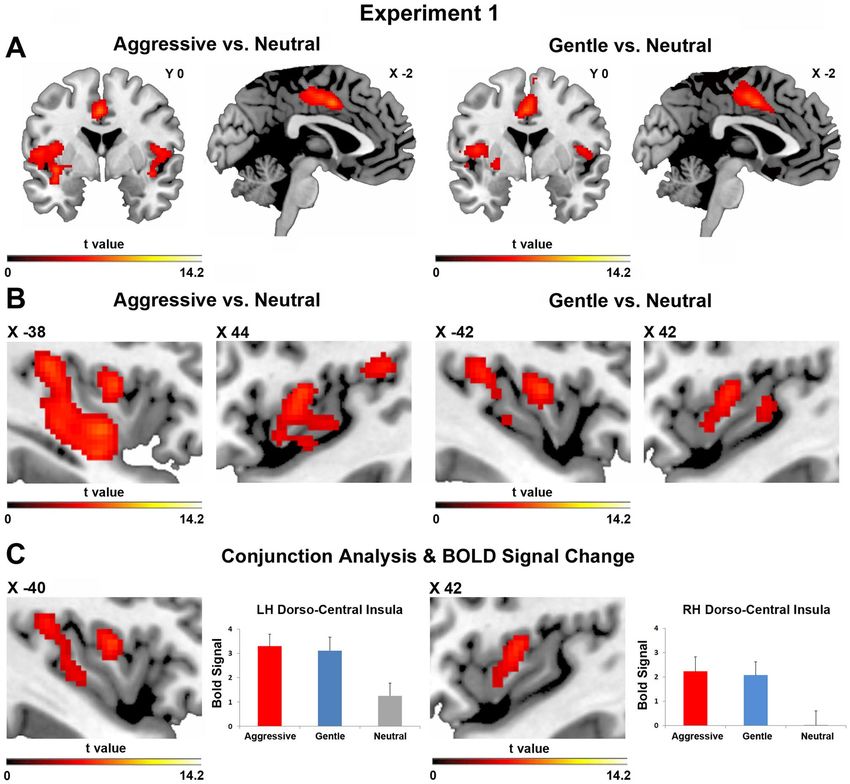
www.nature.com/scientificreports/
Figure 1. Graph shows the participants’ score indicating the type of handshake that they expected in
association with the observation of happy, neutral and angry facial expressions. Under the graph is shown the
observed facial expressions used to collect the participants’ responses. Facial expressions were freely shared by
https://apprecs.com/ios/415011116/volafriends. Asterisks indicate statistical significance (p < 0.05).
structures and, more specifically, whether the observation of a happy or angry facial expression could modify the
activity of brain areas involved in the processing of tactile vitality forms, rendering the perception of a handshake
more positive or more negative.
To investigate these issues, two fMRI experiments were carried out. Experiment 1 (Exp. 1) consisted of three
situations. In the first, the experimenter with his right hand shook the right hand of participant, while the partici-
pant observed video clips showing dynamically facial expression (angry, neutral and happy). The handshake was
performed in an aggressive, neutral, or gentle way and was congruent with the expression conveyed by the facial
expression (e.g. gentle handshake and happy face, aggressive handshake and angry face). In the second situation,
participants were presented with the same facial expressions, but did not receive a handshake. Finally, in the
third situation, participants received only a handshake (aggressive, gentle or neutral), without the presentation
of facial stimuli. In Experiment 2, participants were tested in the same three situations as in Exp. 1, except that
the handshake was always performed in a neutral way.
The results showed that handshake conveying tactile vitality forms produced, relative to control, a strong
activation of the dorso-central insula and of the middle cingulate cortex. The interpersonal social context, con-
veyed by facial expressions, modulated the activation of these two areas.
Materials and methods
Preliminary behavioral study. A preliminary behavioral study, conducted before the two fMRI experi-
ments, was carried out in order to ascertain what type of handshake participants expected in association with the
observation of angry, happy and neutral facial expressions. Thirty healthy right-handed participants (20 females
and 10 males, mean age = 24.8 years, SD = 2.5 years) took part in this behavioral study. Participants were pre-
sented with visual stimuli, consisting of three different facial expressions (angry, happy and neutral) performed
by five actors (3 females and 2 males). In total 15 facial expressions were presented. Participants were required
to observe the facial expression and indicate the type of handshake expected from that person on a bar show-
ing four possible choices: “gentle”, “neutral”, “aggressive”, “don’t know”. Subsequently, we verified the presence of
differences among category response frequencies using a one-way chi square test. This analysis indicated that
participants observing happy, neutral and angry facial expressions, expected to receive a congruent handshake
and namely a gentle (70.8%; one-sample chi-square test: χ2 (3) = 134,8, p = 0.001), neutral (73.3%; χ2 (3) = 150,
p = 0.001) and aggressive (84.6%; χ2 (3) = 231,6, p = 0.001) handshake respectively (Fig. 1). Comparing males and
females responses, no differences were found (see Supplementary Material, Fig. S1).
fMRI study. Participants. Two fMRI experiments were carried out. The same participants (N = 15, six fe-
males and nine males, mean age = 24.6, SD = 2.6) took part in both experiments. The choice to use of the same
participants in the two experiments was done to avoid that possible differences in neural activation patterns
were due to individual participant differences. The Exp. 2 was carried out two months after the beginning of
the Exp. 1. The choice to collect 15 subject in the current study is based on results provided by a power analysis
carried out on previous fMRI data concerning the vitality forms5,12. Results of power analysis indicated that,
in order to obtain a medium effect in the dorso-central insula due to the perception and expression of vitality
forms, it is essential to collect a sample consisting of at least 15 participants [(partial eta square = 0.21, α = 0.05,
β = 0.95 and non sphericity correction 0.7 (ε)]. All participants gave their written informed consent to participate
in the Exp. 1 and Exp. 2. Both experiments were approved by the ethics committee of the University of Parma
(UNIPRMR750v1) in accordance with the Declaration of Helsinki. All participants had normal or corrected-
to-normal vision.
Scientific Reports | (2021) 11:9095 | https://doi.org/10.1038/s41598-021-87919-z 2
Vol:.(1234567890)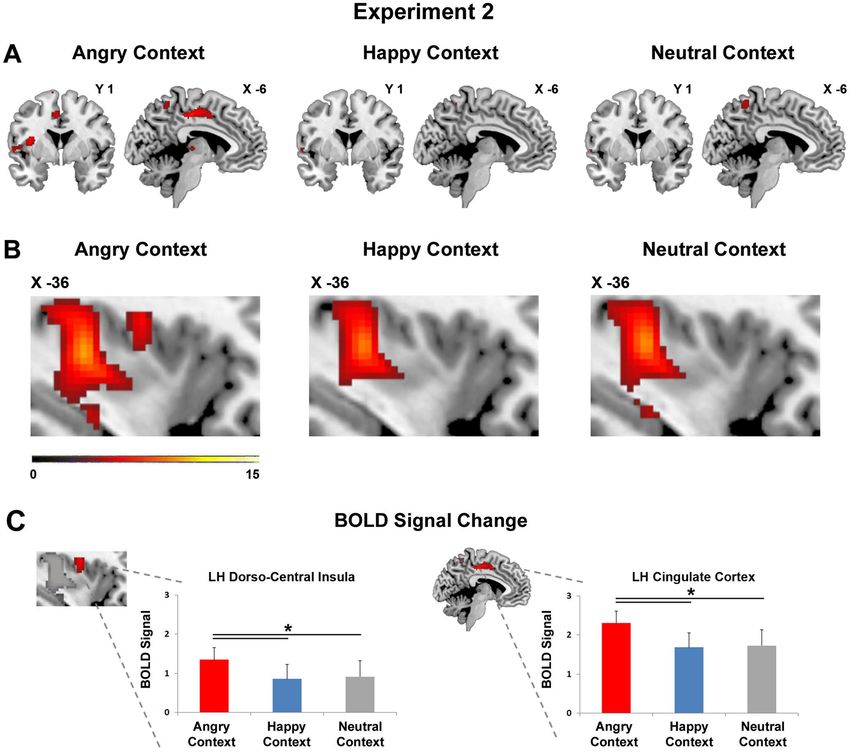
www.nature.com/scientificreports/
Figure 2. Experimental paradigm adopted in the experiment 1. Three different situations were presented
[handshake and facial expression, HS + FE (1); facial expression, FE (2); handshake, HS (3)]. Each video
stimulus was presented as a single event lasting 2 s in miniblocks composed of five stimuli intermixed with an
inter stimulus interval lasting 6 s. During handshake and facial expression (HS + FE) and facial expressions
(FE) situations, a total of 15 facial expressions were presented: 10 for the vitality condition (5 actors × 2 facial
expressions) and 5 for the control condition (5 neutral expressions). Facial expressions were freely shared by
https://apprecs.com/ios/415011116/volafriends. During the observation of happy, angry and neutral facial
expressions, participants received a congruent handshake (gentle, blue color; aggressive, red color; neutral, gray
color). During the handshake situation (3), participants received a gentle (blue color), aggressive (red color)
and neutral (gray color) handshake. The same paradigm was also adopted in experiment 2 but during the
observation of happy, angry, neutral facial expressions, participants received always a neutral handshake (for
details see Figure S3).
Paradigm and task: fMRI study. Both fMRI experiments consisted of three different situations (handshake
and facial expressions, HS + FE; facial expression, FE; handshake, HS). The facial expressions presented in the
fMRI study were the same as those used in the preliminary study. In the first situation (HS + FE), participants
were presented with video clips showing actors producing two dynamic facial expressions (happy and angry)
and other video clips showing the same actors tilting the head to the left or right side while maintaining a
neutral facial expression (control stimuli). It is important to note that, during the presentation of video clips,
participants received a handshake given by the experimenter with his right hand (see Fig. 2). In the Exp. 1, the
handshake strength was congruent with the presented facial expression and was performed in an aggressive or
gentle manner (tactile vitality forms condition). Additionally, during the observation of the neutral facial expres-
sion, the handshake was performed in a neutral way (control condition). In contrast, in Exp. 2, during the first
situation (HS + FE) participants received a handshake always performed in a neutral way (see Fig. S3). In both
experiments, in the second situation (FE) participants were presented with video clips showing dynamic facial
expressions (happy, angry, neutral) and did not receive a handshake (Fig. 2).
Finally, in both experiments, in the third situation (HS) participants received only a handshake without a
facial expression. More specifically, in Exp. 1 participants received different types of handshakes (gentle, aggres-
sive, neutral; Fig. 2), whereas in Exp. 2 they received only one type of handshake (neutral; see Fig. S3). It is
important to note that, the dorso-central insula is endowed with motor properties and it is active during the
execution of actions. Therefore, aiming to assess the insula activity when receiving tactile vitality forms, in order
to exclude that the activation of this insular sector were merely due to the execution of handshake, we required
participants to be completely passive and relaxed and not to return the handshake.
Each situation consisted of independent miniblocks. Each miniblock was composed by five stimuli and
each stimulus lasted 2 s. Stimuli were intermixed by a rest period lasting 6 s (see Fig. 2). In Exp.1 and Exp. 2
Scientific Reports | (2021) 11:9095 | https://doi.org/10.1038/s41598-021-87919-z 3
Vol.:(0123456789)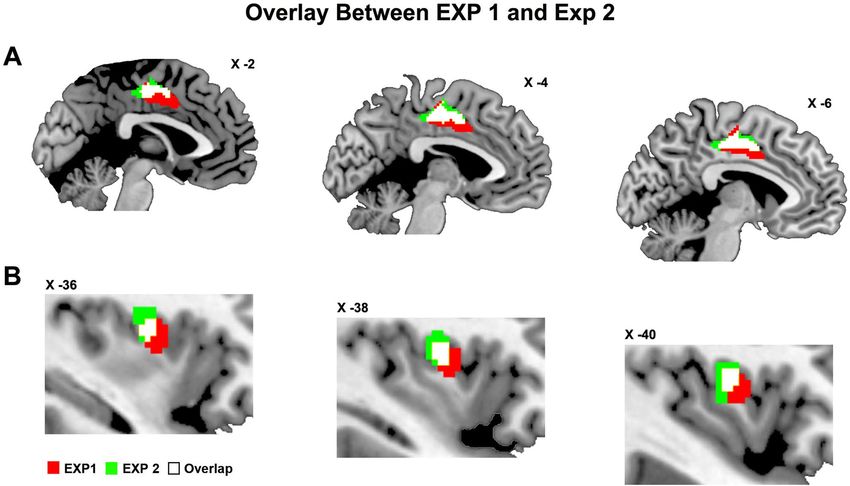
www.nature.com/scientificreports/
five experimental conditions were presented (Exp. 1: Handshake (HS), Facial Expressions (FE), Aggressive HS
and Angry FE, Gentle HS and Happy FE, Neutral HS and Neutral FE; Exp. 2: Handshake, Facial Expressions,
Neutral HS and Angry FE, Neutral HS and Happy FE, Neutral HS and Neutral FE). For each condition six mini-
blocks were presented in a randomized order (30 single trials per condition). In both experiments, before each
mini block, an instruction panel indicated to participants the type of situation that would be presented (Fig. 2).
Randomly, in the 40% of cases, at the end of the experimental miniblock containing facial expressions (HS + FE,
FE), participants had to indicate with the left hand the last presented facial expression (happy, angry, neutral)
on a response box placed inside the scanner. The analysis of the catch trials showed that the participants’ mean
response accuracy was 85% in Exp. 1 and 88.3% in Exp. 2.
fMRI data acquisition. Imaging data were collected on a 3 T Discovery MR750 GE scanner equipped with an
eight-channel receiver head coil. Functional images were acquired using a gradient EPI sequence with a TR of
2000 ms, TE of 30 ms, flip angle of 90°, parallel imaging acceleration factor of 2, 205 × 205 mm2 field of view, and
voxel size of 2.5 × 2.5 × 3 mm3. The scanning comprised three sequences composed by 266 ascending sequential
volumes each. Then, each volume was composed by 40 axially slices. Additionally, a high resolution T1-weighted
structural image (1 × 1 × 1 mm3) was acquired with a TR of 8100 ms, TE of 3.2 ms, and flip angle of 12° for each
participant.
Statistical analysis. The data analysis for Exp. 1 and Exp. 2 was performed using SPM12 (Wellcome Trust
Center for Neuroimaging, London, UK). The first three volumes of each run were discarded to allow T1 equi-
libration effects. For each participant functional data were anonymized. Then, functional volumes were first
slice-timing corrected, realigned to the mean volume and unwarped for between-scan motion correction. Subse-
quently, the T1-weighted image was resampled into functional image space before segmentation into gray, white
and cerebrospinal fluid and normalization to the Montreal Neurological Institute (MNI) space, according to the
SPM12 preprocessing pipeline. Finally, spatial transformations derived from the segmentation step were then
applied to the realigned EPIs for normalization to MNI space with a voxel size of 2 mm × 2 mm × 2 mm. At the
end of preprocessing, all functional normalized volumes were then spatially smoothed with a 6-mm full-width
half maximum isotropic Gaussian kernel. For all subjects, head motion was carefully checked and no partici-
pant met the exclusion criteria of 3 mm mean displacement. For both experiments, data were analyzed using a
random-effects model17, implemented in a two-level procedure. At the first level (single-subject analysis), the
BOLD signal was modeled using a general linear model (GLM) comprising the onset of each event, duration,
and six motion parameters related to head motion for each functional run.
In Exp. 1, the GLM model consisted of seven regressors: faces, handshakes, gentle handshake and happy face,
aggressive handshake and angry face, neutral handshake and neutral face, instruction and response. The stimuli
were modeled as a single event lasting 2 s. The catch trial intermixed with experimental blocks was modeled as
a single event lasting 6 s. In order to highlight the insular sector selective to vitality forms without the influence
of the insular activation merely due to visual information, we subtracted at first level the general information of
facial expressions (happy, neutral, angry). In this way, we obtained the following contrasts: aggressive handshake
and angry face vs. faces (Aggressive Tactile Vitality Form), gentle handshake and happy face vs. faces (Gentle
Tactile Vitality Form), neutral handshake and neutral face vs. faces (Neutral Tactile Vitality Form).
In the second-level analysis (group analysis), for each participant, the contrast images of the first level were
entered into two flexible factorial models. The first model consisted of five regressors (faces, handshakes, gentle
handshake and happy face, aggressive handshake and angry face, neutral handshake and neutral face) and con-
sidered the activation patterns vs. baseline. The second model consisted of three regressors (Aggressive Tactile
Vitality Form, Gentle Tactile Vitality Form, Neutral Tactile Vitality Form) and considered the activation pat-
terns resulting from the contrast among conditions (Aggressive Tactile Vitality Form vs. Neutral Tactile Vitality
Form, Gentle Tactile Vitality Form vs. Neutral Tactile Vitality Form, Aggressive Tactile Vitality Form vs. Gentle
Tactile Vitality Form).
In Exp. 2, the GLM model consisted of seven regressors: faces, handshakes, neutral handshake and happy face,
neutral handshake and angry face, neutral handshake and neutral face, instruction and response. The stimuli
were modeled as a single event lasting 2 s. The catch trial intermixed with experimental blocks was modeled as
a single event lasting 6 s. As in Exp. 1, the general visual information of facial expressions was subtracted by the
following contrasts: neutral handshake and angry face vs. faces (Tactile Vitality Form in Angry Context), neutral
handshake and happy face vs. faces (Tactile Vitality Form in Happy Context), neutral handshake and neutral
face vs. faces (Tactile Vitality Form in Neutral Context).
In the second-level analysis (group analysis), for each participant, the contrast images of the first level were
entered into two flexible factorial models. The first model consisted of five regressors (faces, handshakes, neu-
tral handshake and happy face, neutral handshake and angry face, neutral handshake and neutral face) and
considered the activation patterns vs. baseline. The second model consisted of three regressors (Tactile Vitality
Form in Happy Context, Tactile Vitality Form in Angry Context, Tactile Vitality Form in Neutral Context) and
considered the activation patterns of the three conditions.
The location of the activation foci was determined in the stereotaxic space of the MNI coordinates system.
All the activations revealed in the group analysis were identified using a statistical threshold of p < 0.001, FWE
corrected at cluster level.
Testing for the vitality effect: region‑of‑interest analysis. On the basis of the functional maps obtained in Exp.
1, we carried out a conjunction analysis between the brain activations resulting from the contrasts Aggressive
Tactile Vitality Form vs. Neutral Tactile Vitality Form and Gentle Tactile Vitality Form vs. Neutral Tactile Vital-
Scientific Reports | (2021) 11:9095 | https://doi.org/10.1038/s41598-021-87919-z 4
Vol:.(1234567890)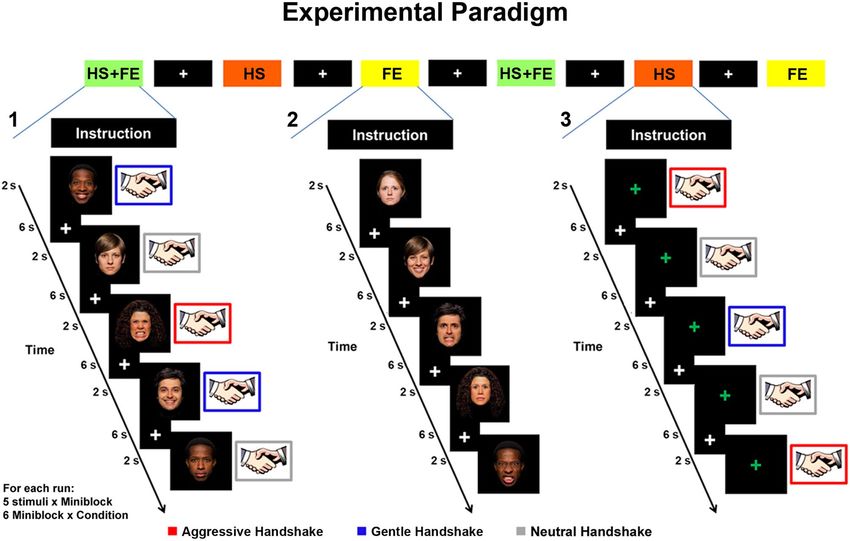
www.nature.com/scientificreports/
ity Form to highlight the insular voxels selective for both aggressive and gentle tactile vitality forms (Fig. 4C).
Then, in order to identify possible differences between aggressive and gentle tactile vitality forms, in the clusters
resulting from the conjunction analysis in the left hemisphere (local maxima: X = − 40 Y = 2 Z = 10) and in the
right hemispheres (local maxima: X = 42, Y = 4, Z = 8), using the SPM Rex Toolbox (http://web.mit.edu/swg/rex),
the BOLD signal change relative to three regressors (Aggressive Tactile Vitality Form, Gentle Tactile Vitality
Form, Neutral Tactile Vitality Form) was extracted for each participant. In these ROIs, to avoid the problem of
circularity in the analysis a comparison was made only between aggressive and gentle conditions.
In the Exp. 2, the functional maps obtained from the regressor Tactile Vitality Form in Angry Context high-
lighted the activation of the dorso-central insula and the cingulate cortex in the left hemisphere (local maxima:
insula, X = − 36, Y = 0, Z = 16; cingulum, X = − 6, Y = 0, Z = 44). In these two regions, using the SPM Rex Toolbox,
the BOLD signal change relative to the neutral handshake received during the observation of different facial
expressions (happy, neutral, angry) was extracted for each participant from the following regressors: Tactile Vital-
ity Form in Happy Context, Tactile Vitality Form in Angry Context, and Tactile Vitality Form in Neutral Context.
Then, for each region, the BOLD signal was modeled using a GLM comprising the participants’ BOLD activity
relative to the neutral handshake received during the observation of happy, neutral and angry faces (contexts).
Electromyography data acquisition and processing. EMG was used to monitor the handshake
intensities during Exp. 1 and Exp. 2. Ag/AgCl EMG-electrodes (Falk Minow Services) were used in combination
with the BrainAmp MR system (Brain Products GmbH, Munich, Germany) for the EMG signal recordings. Two
electrodes were placed on the flexor muscle of the fingers of the right arm, 2 cm from each other, and arranged
parallel to the direction of the muscle fibers. A reference electrode (ground) was placed on the elbow of the same
arm. The skin under the electrodes was cleaned with alcohol solution and scrubbed to reduce electrical imped-
ance. An electrolytic gel was placed between the electrode surface and the skin to facilitate the conduction of the
electrical signal. All electrodes were attached to the BrainAmp amplifier (placed as far away from the scanner
as possible), which converted the neurophysiological signals to digital signals. Signals were sampled by Brain
Vision Recorder software with a sampling rate of 2500 Hz/channel and a resolution of 0.1 μV. The MRI scanner
sent a trigger signal to the Brain Vision Recorder when a scan session started. Before the beginning of each trial,
the experimenter received via digital audio system the instruction about the type of the handshake to perform
(e.g. prepare to perform a gentle handshake). Then, after 2 s, again via digital audio system, the experimenter
received information allowing him to start (go signal) and terminate (stop signal) the handshake in the estab-
lished time (2 s). At the same time, participants were presented with video-clips showing the facial expression (2
s).
EMG signals were processed by using a homemade GUI of MATLAB R2018a (Mathworks, Natick, USA)
and EEGLAB v14.1.2 toolbox (Swartz Center for Computational Neuroscience, CA, USA, https://sccn.ucsd.
edu/eeglab/index.php)18.
The data were first corrected for scanner artifacts using the FMRIB tool of EEGLAB according to the method
described by A llen18. Then, data were filtered using a 20–500 Hz pass-band filter and 50 Hz notch filter to
minimize possible movements and power supply artifacts in the s ignal19,20. Thereafter, signals were rectified and
epochs of 3000 ms corresponding to aggressive, gentle and neutral stimuli were extracted. A root mean square
envelope over 200-sample intervals (80 ms) was performed to determine the mean amplitude of the EMG signal
in each epoch. Finally, signals corresponding to the same stimuli were aligned and averaged. The intensities
(mV/s) of aggressive, gentle and neutral handshakes were obtained by integrating the averaged signal in a time
window of ± 750 ms around the peak of the signal. Finally, the mean EMG curves and intensities of each subject
were averaged (for details of EMG data processing see Fig. S5).
Results
Experiment 1. Cortical activations vs. baseline in all three situations (HS, FE, HS + FE). Figure 3A illus-
trates the brain activity resulting from aggressive and gentle handshakes vs. baseline during the observation of
an angry or happy context. On the cortical surface, activations were present in the areas encoding somatosensory
modality (SI and SII), in particular on the left hemisphere; the dorsal and ventral premotor areas; the posterior
part of the temporo-parietal region and visual areas extending to the posterior part of the fusiform gyrus (for
coordinates see Table 1). Additionally, activations were present, in the insula, the posterior part of the middle
cingulate cortex, and the amygdala, bilaterally (see aldo Fig. S2). A similar, but weaker, cortical activation pattern
was found during the control condition vs. baseline (neutral facial expression and neutral handshake; Fig. 3B,
for coordinates see Table 1).
The observation of facial expressions (happy, angry, neutral) vs. baseline produced a strong activation of visual
areas, particularly of the posterior part of the fusiform gyrus in the left and right hemispheres (Fig. 3C). There
was also an activation of the dorsal and ventral premotor cortices, the anterior part of the insula, the posterior
part of the middle cingulate cortex, and the amygdala bilaterally (for coordinates see Table 1).
Finally, the handshake per se (without context) performed in an aggressive, gentle and neutral manner,
produced the activation of areas SI and SII on the left hemisphere; the dorsal and ventral premotor areas; the
posterior part of the temporo-parietal region. There was a bilateral activation of the insula (anterior and middle
sectors), the posterior part of the middle cingulate cortex extending to the anterior sector, and the amygdala
(Fig. 3D; for coordinates see Table 1).
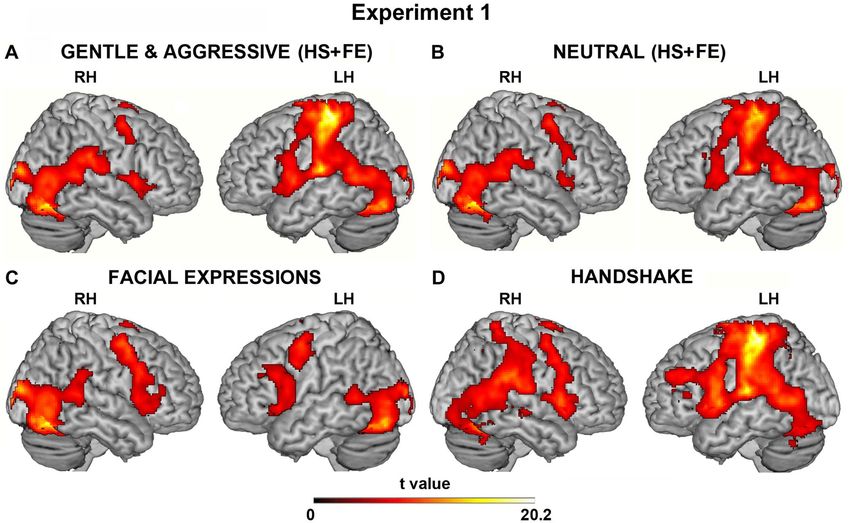
Contrast between aggressive and gentle tactile vitality forms vs. control (HS + FE). The contrast Aggressive Tac-
tile Vitality Form vs. Neutral Tactile Vitality Form showed the activation of the middle cingulate cortex (Fig. 4A,
left side), the dorso-central insula bilaterally (Fig. 4B), and areas SI and SII. The contrast Gentle Tactile Vitality
Scientific Reports | (2021) 11:9095 | https://doi.org/10.1038/s41598-021-87919-z 5
Vol.:(0123456789)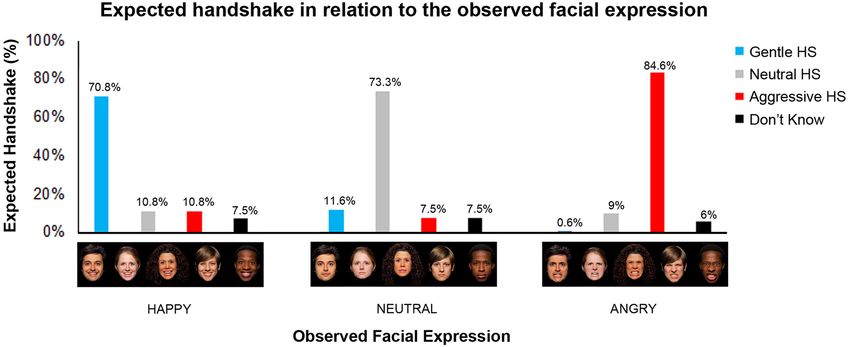
www.nature.com/scientificreports/
Figure 3. Brain activations resulting from the three different situations (handshake and facial expression,
HS + FE; facial expression, FE; handshake, HS). Activations obtained in the first situation (HS + FE) during the
vitality forms (aggressive and gentle) (A) and neutral (B) (control) conditions vs. baseline. Activations obtained
in the second (FE) (C) and third situations (HS) (D) vs. baseline. These activations are rendered using a
standard Montreal Neurological Institute brain template (PFWE < 0.05 voxel level). LH, left hemisphere; RH, right
hemisphere.
Form vs. Neutral Tactile Vitality Form produced the activation of the same areas (Fig. 4A,B, right side; for coor-
dinates see Table 1).
The conjunction analysis (Aggressive Tactile Vitality Form vs. Neutral and Gentle Tactile Vitality Form vs.
Neutral) showed that the same insular sector was activated in both aggressive and gentle conditions relative to
controls (Fig. 4C). On the basis of the functional maps obtained in the conjunction analysis, we extracted the
BOLD signal change relative to the gentle, aggressive, and neutral conditions for each participant to identify
possible differences in intensity between aggressive and gentle handshakes. The t-test revealed no significant
difference between gentle and aggressive tactile vitality forms in the left and right hemispheres (Fig. 4C; p > 0.05).
EMG analysis. During the experiment, the strength of each handshake given by the experimenter to the par-
ticipants was recorded using the EMG. The EMG analysis revealed that the intensity of the handshake changed
as a function of the tactile vitality form. More specifically, during the execution of an aggressive handshake, the
experimenter performed the action with a higher intensity than when performing the same action in a gentle
or neutral way (Fig. 5A1). Differences between the intensities of aggressive, gentle and neutral handshakes are
reported in Fig. 5A1,A2. The results showed significant difference (p ≤ 0.05) between aggressive and gentle hand-
shakes and between aggressive and neutral handshakes (Fig. 5A2). No statistically difference in the EMG activity
was observed between gentle and neutral handshakes (p = 0.7). Note that while the strength intensity was the
same between gentle and neutral conditions, the shape of the two curves was different.
Experiment 2. In Exp. 2, as in Exp. 1, participants were tested in three situations (HS + FE, FE, HS). In the
first situation, they were presented with video clips showing dynamic facial expressions (happy, angry, neutral)
while the experimenter simultaneously shook the participants’ right hand. In contrast to Exp. 1, the strength of
the handshake was always performed in a neutral manner (Figure S3). The main aim of Exp. 2 was to evaluate
the role of the facial expressions in the modulation of tactile vitality forms conveyed by the handshake. Concern-
ing the cortical and subcortical activations obtained during the three situations vs. baseline, the results of Exp.
2 were very similar to those of Exp. 1. The main effects are shown in the Supplementary Material (Fig. S4; for
coordinates see Table 2).
Scientific Reports | (2021) 11:9095 | https://doi.org/10.1038/s41598-021-87919-z 6
Vol:.(1234567890)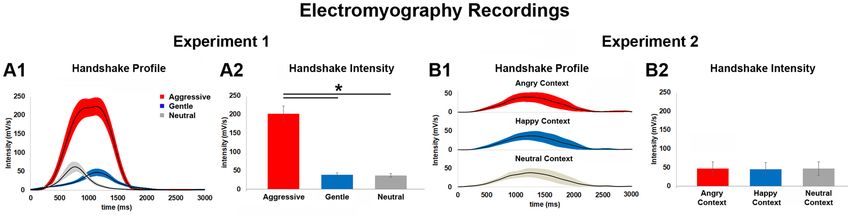
www.nature.com/scientificreports/
Left hemisphere Right hemisphere
Contrast of interest x y z Z-score x y z Z-score
(A) Gentle and aggressive handshake vs. baseline (HS+FE)
Precentral gyrus − 36 − 28 64 Inf Fusiform gyrus 34 − 66 − 18 Inf
Postcentral gyrus − 44 − 32 60 Inf Rolandic operculum 50 4 8 7.24
Fusiform gyrus − 38 − 54 − 20 Inf Inferior frontal gyrus 52 12 2 7.23
Rolandic operculum − 52 − 22 44 Inf Amygdala 20 −4 − 16 7.21
Insula (posterior short gyrus) − 40 2 8 Inf Middle frontal gyrus 48 0 54 7.20
Cerebellum − 28 − 78 − 20 Inf Insula 38 6 4 7.11
Hippocampus − 22 − 28 −6 Inf Cerebellum 24 − 56 − 50 6.03
Postcentral Gyrus 60 − 12 42 5.71
Superior Parietal Lobule 24 − 46 72 5.41
Putamen 24 6 6 5.01
Pallidum 16 2 −4 4.83
(B) Neutral handshake vs. baseline (HS+FE)
Precentral gyrus − 38 − 28 64 Inf Fusiform gyrus 34 − 66 − 18 Inf
Postcentral gyrus − 44 − 32 60 Inf Middle frontal gyrus 50 0 54 7.33
Fusiform gyrus − 36 − 56 − 20 Inf Inferior frontal gyrus 50 14 2 6.07
Calcarine gyrus −2 − 82 −6 Inf Amygdala 20 −4 − 16 7.28
Lyngual gyrus −2 − 78 −4 Inf Hippocampus 18 − 12 − 16 5.44
Cerebellum − 28 − 78 − 20 Inf Cerebellum 14 − 62 − 48 5.66
Inferior parietal lobule − 30 − 50 40 5.39 Postcentral gyrus 62 − 12 40 5.63
Putamen 24 6 6 5.50
Superior parietal lobule 24 − 46 72 4.78
(C) Facial expressions vs. baseline
Hippocampus − 22 − 28 −6 Inf Fusiform gyrus 34 − 66 − 18 Inf
Precentral gyrus − 50 −2 52 7.58 Calcarine gyrus 14 − 96 2 Inf
Posterior medial frontal −2 8 48 7.05 Thalamus 20 − 30 2 Inf
Inferior frontal gyrus − 48 18 24 6.79 Middle frontal gyrus 48 0 54 Inf
Inferior parietal lobule − 30 − 54 48 5.98 Precentral gyrus 50 6 48 Inf
Thalamus −8 − 16 −2 5.41 Middle cingulate cortex 8 14 38 6.85
Superior occipital gyrus − 22 − 66 36 4.82
Anterior cingulate cortex −6 8 28 4.76
(D) Handshake vs. baseline
Precentral gyrus − 36 − 28 64 Inf Cerebellum 34 − 58 − 22 Inf
Postcentral gyrus − 44 − 32 60 Inf Rolandic operculum 48 − 28 20 Inf
Rolandic operculum − 40 − 22 − 18 Inf Thalamus 14 − 28 2 7.34
Inferior parietal lobule − 46 − 24 38 Inf Pallidum 16 2 −4 6.09
Insula (posterior short gyrus) − 40 2 6 Inf Middle cingulate cortex 12 − 24 36 5.59
Inferior frontal gyrus − 52 8 12 Inf Middle frontal gyrus 32 50 26 5.48
Cerebellum − 10 − 74 − 46 5.51 Superior temporal gyrus 28 −4 70 5.01
(E) Aggressive tactile VF vs. neutral tactile VF
Precentral gyrus − 36 − 28 64 Inf Rolandic operculum 50 4 8 5.30
Middle cingulate cortex −2 0 42 6.09 Insula (posterior short gyrus) 44 6 4 5.24
Rolandic operculum − 52 − 22 14 5.89 Inferior temporal gyrus 48 − 68 −6 5.13
Insula (posterior short gyrus) − 38 4 10 5.47
Middel occipital gyrus − 26 − 88 0 4.70
(F) Gentle tactile VF vs. neutral tactile VF
Precentral gyrus − 36 − 28 64 Inf Cerebellum 16 − 50 − 20 6.30
Postcentral gyrus − 46 − 28 58 Inf Insula (posterior short gyrus) 42 4 8 5.14
Middle cingulate cortex −4 −8 48 5.75 Rolandic operculum 52 − 14 12 5.01
Insula (posterior short gyrus) − 42 2 8 5.47
Table 1. Brain activations obtained in Exp. 1 from the three different situations (handshake and facial
expression; facial expression; handshake). Activations obtained in the first situation (HS + FE) during the
vitality forms (aggressive and gentle) (A) and neutral (B) (control) conditions vs. baseline. Activations obtained
in the second (facial expression) (C) and third situations (handshake) (D) vs. baseline. Activation resulting
from aggressive vs. neutral (E) and gentle vs. neutral (F) contrasts. Local maxima, as shown in Figs. 2 and 3,
are given in MNI standard brain coordinates, significant threshold was set at PFWE < 0.05.
Scientific Reports | (2021) 11:9095 | https://doi.org/10.1038/s41598-021-87919-z 7
Vol.:(0123456789)www.nature.com/scientificreports/
Figure 4. Parasagittal sections showing the activations of the insular and cingulate cortices obtained
in situation 1 (handshake and facial expression) for the contrasts aggressive tactile vitality form vs. neutral tactile
vitality form (aggressive vs. neutral) and gentle tactile vitality form vs. neutral tactile vitality form (gentle vs.
neutral) (A,B). The conjunction analysis between the contrasts aggressive tactile vitality form vs. neutral and
gentle tactile vitality form vs. neutral revealed a common activation of the dorso-central sector of insula (C). The
bars presented on the right side indicate the BOLD signal change extracted from the left and right dorso-central
insula. These brain activations are rendered using a standard Montreal Neurological Institute brain template
(PFWE < 0.05 at cluster level).
Comparison among angry, happy and neutral facial expressions during neutral handshaking. In order to assess
the effect of the social context (facial expressions) on the tactile vitality forms conveyed by a neutral handshake,
we analysed and compared the brain activations of the handshake obtained during the observation of happy,
angry and neutral facial expressions (Tactile Vitality Form in Happy Context vs. baseline, Tactile Vitality Form in
Angry Context vs. baseline, Tactile Vitality Form in Neutral Context vs. baseline). The results showed a modula-
tion of the brain activation due to the facial expression. In particular, the handshake, received during the obser-
vation of an angry facial expression, determined the activity of the posterior part of the middle cingulate cortex
(Fig. 6A) and of the left dorso-central insula (Fig. 6B; for coordinates see Table 2). In contrast, these activations
were absent when the handshake was received during the observation of a happy and neutral facial expression
(Fig. 6A,B). Furthermore, in all three facial contexts, there was an activation of the posterior part of the insula
and namely of the long gyri. Additionally, the analysis of the BOLD signal of the dorso-central insula and the
cingulate cortex (versus baseline) showed different modulations during angry, happy, or neutral facial context
Scientific Reports | (2021) 11:9095 | https://doi.org/10.1038/s41598-021-87919-z 8
Vol:.(1234567890)www.nature.com/scientificreports/
Figure 5. The graphs show the mean handshake profile (A1) and the mean intensity (A2) of the aggressive,
gentle, and neutral handshakes detected by EMG in Exp. 1. The horizontal lines above the bars indicate the
comparisons among aggressive, gentle, and neutral handshakes (A2). Asterisk indicates significant differences
set at p ≤ 0.05 (*). The graphs show the mean handshake profile (B1) and the mean intensity (B2) of the neutral
handshake detected by EMG in Exp. 2 during the observation of angry, happy and neutral facial expressions
(context).
(Fig. 6C). Notably, these insular and cingulate sectors partially overlaps with those found in Exp. 1 involved in
the processing of tactile vitality forms (Fig. 7).
Region‑of‑interest analysis. The results of the GLM analysis carried out in Exp. 2 on the BOLD signal change
extracted in the insular and cingulate cortices, indicated in both areas a significant difference of the BOLD signal
among the happy, neutral and angry interpersonal contexts (insula: F = 4.2, p = 0.02; cingulum: F = 5.8, p = 0.01).
Post hoc analysis revealed in both regions a significant difference between the angry and happy contexts and
between the angry and neutral contexts (insula: angry > neutral, p = 0.03; angry > happy, p = 0.03; cingulum:
angry > neutral, p = 0.02; angry > happy, p = 0.01; Newman–Keuls correction; Fig. 6C).
EMG analysis. As in Exp. 1, in Exp. 2 the strength of each handshake performed by the experimenter was
recorded using EMG. The EMG analysis revealed no statistical differences (p-value ≤ 0.05) between the intensi-
ties of the neutral handshake performed in the happy, neutral and angry context (Fig. 5B).
Discussion
In all actions, one can recognize two complementary aspects: the goal of the action (e.g., grasping an object, holding it,
giving it to another person) and the form with which the action is executed (e.g., gentle, rude, violent). The importance
of the forms of actions in social behavior has been extensively studied by Stern, who called them “vitality forms”2.
In pathological conditions, the two aspects of actions can become dissociated. For example, children
with autistic spectrum disorder (ASD) often fail to understand the vitality forms with which the action is
performed21,22, while they do not have difficulties in recognizing the goal of an observed a ction20. Recent analy-
sis of action kinematics of ASD children showed that, although ASD children perform goal-directed actions
pretty well, the way with which they perform them (vitality forms) are different from those of typically develop-
ing children23. As consequence, normotypical adults have problems in recognizing the vitality forms of ASD
actions 24.
It is plausible to hypothesize that the behavioral deficit observed in children with ASD during vitality forms
processing could be ascribed to an incorrect functioning of brain structures such as the insula in particular. In
line with this hypothesis, various studies reported structural and functional alterations in the insula in individuals
with ASD. In particular, alterations of gray matter volume in the insula have been reported in individuals with
ASD25–27. Furthermore, a meta-analysis by Di Martino et al.28, reported a hypo-activation of the anterior insula
in individuals with ASD relative to individuals with TD during the execution of different social tasks. However,
one cannot exclude the involvement or cortical/subcortical areas functionally connected with i t29.
Which are the neural structures underlying vitality forms? In a series of fMRI studies Di Cesare and col-
leagues investigated the cortical activations during the observation of transitive (goal-directed) and intransitive
actions (gestures) expressed with evident vitality forms (e.g. gentle or rude)4–7, and during listening to action
verbs also expressed with clear vitality forms8,10,11. In these studies, the authors found, as expected, an activa-
tion of the cortical areas encoding vitality forms conveyed by two sensory modalities. Most importantly, there
was a selective activation of the dorsal-central insula in the contrast of actions/words conveying vitality forms
vs. controls devoid of evident vitality forms. Subsequently, the same group showed that this insular sector is
endowed with mirror properties and became active not only during the perception but also during the expres-
sion of vitality forms5,11.
In the present study, we assessed the neural basis of vitality forms conveyed by handshaking. The results
showed that the handshakes performed in an aggressive or gentle way produced, relative to a neutral control, a
stronger activation of the dorso-central insula in both hemispheres (see Fig. 4).
We studied handshaking not only in order to establish whether also tactile vitality forms (e.g., gentle or aggressive),
modulated the activity of the dorso-central insula, but also to assess whether interpersonal context modified the insular
activity during the handshake. Handshaking is a fundamental social gesture conveying the attitude of one individual
Scientific Reports | (2021) 11:9095 | https://doi.org/10.1038/s41598-021-87919-z 9
Vol.:(0123456789)www.nature.com/scientificreports/
Left hemisphere Right hemisphere
Contrast of interest x y z Z − score x y z Z-score
(A) Gentle and aggressive handshake vs. baseline (HS+FE)
Precentral gyrus − 38 − 28 64 Inf Fusiform gyrus 32 − 74 − 16 Inf
Postcentral gyrus − 44 − 32 50 Inf Cerebellum 14 − 66 − 48 7.39
Fusiform gyrus − 28 − 78 − 18 Inf Middle frontal gyrus 50 4 54 7.29
Supramarginal gyrus − 52 − 22 16 Inf Precentral gyrus 48 10 10 5.54
Lyngual gyrus −6 − 84 −8 Inf Amygdala 20 −4 − 16 6.52
Cerebellum − 22 − 74 − 18 Inf Inferior frontal gyrus 54 10 6 5.27
Thalamus − 14 − 26 2 7.82
(B) Neutral handshake vs. baseline (HS+FE)
Precentral gyrus − 38 − 28 64 Inf Fusiform gyrus 32 − 72 − 18 Inf
Lyngual gyrus −6 − 84 −8 Inf Middle frontal gyrus 50 4 54 7.50
Middle occipital gyrus − 26 − 64 38 Inf Amygdala 20 −4 − 16 7.01
Inferior parietal lobule − 28 − 50 40 5.38 Insula 46 6 32 6.26
Middle frontal gyrus − 28 − 44 20 5.28 Thalamus 8 − 20 −2 5.74
Inferior frontal gyrus 52 10 6 5.24
(C) Facial Expressions vs. baseline
Lyngual gyrus −6 − 84 −8 Inf Fusyform gyrus 32 − 74 − 16 Inf
Precentral gyrus − 50 0 52 7.78 Calcarine gyrus 14 − 94 2 Inf
Posterior medial frontal −2 12 48 6.90 Middle frontal gyrus 50 4 54 Inf
Hippocampus − 22 − 28 −6 7.07 Posterior medial frontal 2 6 62 7.67
Thalamus −6 − 22 −2 5.09 Insula 34 28 6 6.83
Insula − 32 18 6 5.88 Inferior frontal gyrus 40 14 26 6.44
Temporal pole − 52 8 −2 5.70 Thalamus 8 − 22 −2 5.42
Amygdala − 20 −6 − 16 5.62
Inferior parietal lobule − 32 − 56 52 5.34
(D) Handshake vs. baseline
Precentral gyrus − 38 − 28 64 Inf Lyngual gyrus 22 − 52 − 22 Inf
Postcentral gyrus − 44 − 32 50 Inf Fusiform gyrus 34 − 58 − 20 Inf
Supramarginal gyrus − 52 − 22 − 16 Inf Rolandic operculum 48 − 28 − 20 Inf
Thalamus − 14 − 24 4 Inf Insula 38 − 12 −6 5.83
Amygdala − 22 − 10 − 10 5.91 Middle frontal gyrus 50 4 54 5.74
Inferior frontal gyrus 52 10 6 5.64
Thalamus 8 − 16 −2 5.62
(E) Aggressive tactile VF in angry context
Postcentral gyrus − 40 − 28 62 Inf Cerebellum 22 − 50 − 22 7.52
Precentral gyrus − 42 − 16 62 7.82 Rolandic operculum 48 − 26 20 5.38
Thalamus − 14 − 26 4 5.48
Middle cingulate cortex −8 − 28 46 5.20
Insula (posterior short gyrus) − 36 0 16 4.78
(F) Gentle tactile VF in happy context
Postcentral gyrus − 40 − 28 62 Inf Cerebellum 20 − 50 − 22 7.34
Precentral gyrus − 30 − 20 72 7.11 Rolandic operculum 48 − 28 20 4.86
Rolandic operculum − 50 − 22 16 7.07
Insula (posterior long gyrus) − 34 − 18 10 6.45
Inferior parietal lobule − 56 − 22 40 6.18
(G) Neutral tactile VF in neutral context
Postcentral gyrus − 40 − 28 62 Inf Cerebellum 22 − 50 − 22 7.63
Precentral gyrus − 44 − 30 52 Inf Rolandic operculum 46 − 28 20 5.38
Rolandic operculum − 50 − 22 16 7.43
Insula (posterior long gyrus) − 34 − 18 10 6.84
Inferior parietal lobule − 44 − 26 40 6.34
Table 2. Brain activations obtained in Exp. 2 from the three different situations (handshake and facial
expression; facial expression; handshake). Activations obtained in the first situation (HS + FE) during the
vitality forms (aggressive and gentle) (A) and neutral (B) (control) conditions vs. baseline. Activations obtained
in the second (facial expression) (C) and third situations (handshake) (D) vs. baseline. Activation resulting
from the following direct contrasts: aggressive vs. facial expressions (E), gentle vs. facial expressions (F),
neutral vs. facial expressions (G). Local maxima, as shown in Fig. 4 and Fig. S4, are given in MNI standard
brain coordinates, significant threshold was set at PFWE < 0.05.
Scientific Reports | (2021) 11:9095 | https://doi.org/10.1038/s41598-021-87919-z 10
Vol:.(1234567890)www.nature.com/scientificreports/
Figure 6. Parasagittal sections showing the activations of the insular and cingulate cortices modulated by
the dynamic facial expressions. These brain activations are relative to the perception of handshakes obtained
in situation 1 (handshake and facial expression) during the angry (Tactile Vitality Form in Angry Context),
happy (Tactile Vitality Form in Happy Context), and neutral (Tactile Vitality Form in Neutral Context) contexts
(A,B). The bar graph indicates the BOLD signal change extracted from the cluster of the left dorso-central insula
and the cingulate cortex highlighted from the contrast Tactile Vitality Form in Angry Context vs. baseline (C).
The horizontal line above the bars indicates the comparisons of the insula and cingulum activity during the
handshake perception during the angry, happy, and neutral contexts. Asterisks indicate significant differences
set at p ≤ 0.05 (*). The vertical lines indicate the standard error of the means (SEM). These brain activations are
rendered using a standard Montreal Neurological Institute brain template (PFWE < 0.05).
towards another. When people offer their hand, they also search for certain social cues conveyed by the recipient such as
the facial expression in order to better understand the attitude of others towards them. To clarify this point, we carried
out a further fMRI experiment, in which a group of participants received a neutral handshake and were presented with
video clips showing different facial expressions (happy, neutral and angry).
The results showed that the angry facial expression, significantly modulated the insula activity, which over-
lapped whit the one found in Exp. 1 and selectively involved in the processing of tactile vitality forms (Fig. 7B).
These findings indicate that the dorso-central insula is the center encoding tactile vitality forms conveyed by a
handshake (Exp. 1) and that its activity is modulated by the interpersonal context (Exp. 2). Our data are in line
with the results of Ravaja et al.31 who showed that the observation of different facial expressions (angry, happy, sad
and fear) performed by an avatar modulates the perception of the tactile stimulus intensity. Similarly, Ellingsen
et al.31, found that the pleasantness of touch increased or decreased according to the concomitant observation
of happy or angry facial expressions.
Scientific Reports | (2021) 11:9095 | https://doi.org/10.1038/s41598-021-87919-z 11
Vol.:(0123456789)www.nature.com/scientificreports/
Figure 7. Parasagittal sections showing the activations of the insular and cingulate cortices selective for
tactile vitality forms. The picture shows the brain activations involved in the processing of tactile vitality forms
obtained in situation 1 (handshake and facial expression), and namely, the sector of the left cingulate cortex (A)
and the left dorso-central insula (B). Red color indicates areas resulting from the conjunction analysis carried
out in Exp. 1 between the contrasts aggressive vs. neutral and gentle vs. neutral while green color indicates
areas found activated in Exp. 2 during the angry context. White color indicates the overlap area. These brain
activations are rendered using a standard Montreal Neurological Institute brain template ( PFWE < 0.05).
It is interesting to note that, differently from our previous fMRI experiments on vitality forms, in both Exp.
1 and Exp. 2 we also observed a strong activation of the posterior insula (long gyri). This is in agreement with
experiments on pleasurable touch in humans, which showed that the stimulation of hand skin with a brush
moving with a specific velocity activated the posterior insula32,33. This insular sector is in fact the target of affer-
ent tactile C fibers (CT fibers)34–37. The CT fibers are a type of unmyelinated afferent nerve that carry signals
from the receptive fields in the epidermis of mammalian hairy skin38–42. These fibers are sensitive to a caress-like
range of stroking speeds associated with hedonically positive subjective r esponses41,43. Note that in the present
study, the actor started the handshake gesture slowly, almost caressing the recipient’s right hand. This was true
for the gentle, aggressive, and neutral conditions. It is likely that this “caressing” procedure was responsible for
the activation of the posterior insula.
While the posterior insula is the target of CT fibers carrying out signals of affective touch, the primary
somatosensory cortex (SI) is the target of myelinated fibers encoding tactile discriminative information. These
findings indicate that affective and discriminative touch represent two distinct features of the tactile modality,
processed in different cortical areas via two different pathways: lemniscal and extralemniscal. This issue was
addressed by Morrison in a meta-analysis based on 17 fMRI studies carried out on the affective touch44. This
meta-analysis revealed three important results: discriminative touch activates the primary somatosensory cor-
tex (SI); both affective and discriminative touch produce the activation of the secondary somatosensory cortex
(SII); the posterior part of the insula including the dorsal-central insula is a fundamental core involved in the
processing of the affective touch44.
Another finding of the present study was the activation of the posterior part of the middle cingulate cortex
during the administration of aggressive and gentle handshakes relative to control (Exp 1). Gothard and col-
leagues suggested that, in the monkey, the execution of facial expression is controlled via two motor sectors of
the middle cingulate cortex and in particular via motor area M 445. Our data, in humans, are in line with these
findings showing that a region of the middle cingulate cortex, corresponding to the border between the anterior
and posterior middle cingulate cortex, is active during the observation of facial expression conveying emotions
and in particular the negative ones (angry face) (see Fig. 6). According to Gothard and colleagues, area M4 is
involved in the emotional control of facial expression. Note that, as mentioned in “Introduction” section, also
the emotions can be expressed with different vitality forms. Indeed, anger might be expressed by the face with
different vitality forms showing a cold wrath or an aggressive anger. In all these cases the emotion is the same, but
the form with which it is expressed is different. We propose that the cingulate sector corresponding to area M4 is
involved not so much in emotion but in expressing facial vitality forms. In agreement with Gothard, emotions are
Scientific Reports | (2021) 11:9095 | https://doi.org/10.1038/s41598-021-87919-z 12
Vol:.(1234567890)www.nature.com/scientificreports/
mostly encoded in the amygdala, which receives intereroceptive and other subcortical information concerning
positive and negative social context. Then, it projects to the cingulate cortex that transforms this affective input
into an appropriate facial expression selecting the set of muscle necessary for this expression.
An interesting question is to understand how the emotional facial expression may modulate the tactile vitality
forms conveyed by handshake. Anatomical studies carried out in m onkeys46–49, showing that the middle cin-
gulate cortex is anatomically richly connected with the insula suggesting that, in humans, these two areas may
be involved in a functional interaction during the expression and recognition of vitality forms. In humans, the
anatomical connections between the cingulate and insula cortices are being investigated by our group.
In conclusion, our study provides three main findings. First, we demonstrated that a handshake conveying
gentle or aggressive tactile vitality forms produces a stronger activation relative to control (neutral) of the dorso-
central insula. Second, the simultaneous presence of emotional facial expressions modulates the activation of
this insular sector during the handshake. Finally, we provide first evidence that the cingulate cortex is involved
in the processing of vitality forms conveyed by facial expression.
Received: 13 January 2021; Accepted: 22 March 2021
References
1. Stern, D. N. The Interpersonal World of the Infant (Basic Books, 1985).
2. Stern, D. N. Forms of Vitality Exploring Dynamic Experience in Psychology, Arts, Psychotherapy, and Development (Oxford University
Press, 2010).
3. Køppe, S., Harder, S. & Væver, M. S. Vitality affects. Int. Forum Psychoanal. 17(3), 169–179 (2008).
4. Di Cesare, G. et al. The neural correlates of “vitality form” recognition: An fMRI study. Soc. Cognit. Affect. Neurosci. 9, 951–960
(2013).
5. Di Cesare, G., Di Dio, C., Marchi, M. & Rizzolatti, G. Expressing and understanding our internal states and those of others. Proc.
Natl. Acad. Sci. U.S.A. 112(33), 10331–10335 (2015).
6. Di Cesare, G., Marchi, M., Errante, A., Fasano, F. & Rizzolatti, G. Mirroring the social aspects of speech and actions: The role of
the insula. Cereb. Cortex 1, 1–10 (2017).
7. Di Cesare, G., Vannucci, F., Rea, F., Sciutti, A. & Sandini, G. How attitudes generated by humanoid robots shape human brain
activity. Sci. Rep. 10(1), 16928 (2020).
8. Di Cesare, G., Marchi, M., Pinardi, C. & Rizzolatti, R. Understanding the attitude of others by hearing action sounds: The role of
the insula. Sci. Rep. 9(1), 14430 (2019).
9. Di Cesare, G., Fasano, F., Errante, A., Marchi, M. & Rizzolatti, G. Understanding the internal states of others by listening to action
verbs. Neuropsychologia 89, 172–179 (2016).
10. Di Cesare, G., Errante, A., Marchi, M. & Cuccio, V. Language for action: Motor resonance during the processing of human and
robotic voices. Brain Cogn. 118(2017), 118–127 (2017).
11. Di Cesare, G., Gerbella, M. & Rizzolatti, G. The neural bases of vitality forms. Natl. Sci. Rev. 7, 202 (2020).
12. Di Cesare, G., Marchi, M., Errante, A., Fasano, F. & Rizzolatti, G. Mirroring the social aspects of speech and actions: The role of
the insula. Cereb. Cortex 28, 1–10 (2017).
13. Di Cesare, G. et al. Vitality form processing in the insula during action observation: A multivoxel pattern analysis. Front. Hum.
Neurosci. 10, 267 (2016).
14. Chaplin, W. F., Phillips, J. B., Brown, J. D., Clanton, N. R. & Stein, J. L. Handshaking, gender, personality and first impressions. J.
Pers. Soc. Psychol. 79, 110–117 (2000).
15. Vanderbilt, A. Amy Vanderbilt’s Complete Book of Etiquette (Doubleday, 1957).
16. Dolcos, S., Sung, K., Argo, J. J., Flor-Henry, S. & Dolcos, F. The power of a handshake: neural correlates of evaluative judgments
in observed social interactions. J. Cogn. Neurosci. 24(12), 2292–2305 (2012).
17. Friston, K. J., Holmes, A. P. & Worsley, K. J. How many subjects constitute a study?. Neuroimage 10, 1–5 (1999).
18. Delorme, A. & Makeig, S. EEGLAB: An open source toolbox for analysis of single-trial EEG dynamics including independent
component analysis. J. Neurosci. Methods 134(1), 9–21 (2004).
19. Allen, P. J., Josephs, O. & Turner, R. A method for removing imaging artifact from continuous EEG recorded during functional
MRI. Neuroimage 12(2), 230–239 (2000).
20. Van Duinen, H., Zijdewind, I., Hoogduin, H. & Maurits, N. Surface EMG measurements during fMRI at 3T: Accurate EMG
recordings after artifact correction. Neuroimage 27(1), 240–246 (2005).
21. Rochat, M. J. et al. Impaired vitality form recognition in autism. Neuropsychologia 51(10), 1918–1924 (2013).
22. Di Cesare, G. et al. Differences in action style recognition in children with autism spectrum disorders. Front. Psychol. 8, 1456
(2017).
23. Casartelli, L. et al. Vitality form expression in autism. Sci. Rep. 10, 17182. https://doi.org/10.1038/s41598-020-73364-x (2020).
24. Casartelli, L. et al. Neurotypical individuals fail to understand action vitality form in children with autism spectrum disorder. Proc.
Natl. Acad. Sci. 117(44), 27712–27718. https://doi.org/10.1073/pnas.2011311117 (2020).
25. Kosaka, H. et al. Smaller insula and inferior frontal volumes in young adults with pervasive developmental disorders. Neuroimage
50(4), 1357–1363 (2010).
26. Cauda, F. et al. Grey matter abnormality in autism spectrum disorder: An activation likelihood estimation meta-analysis study. J.
Neurol. Neurosurg. Psychiatry 82(12), 1304–1313 (2011).
27. Ecker, C. et al. Brain anatomy and its relationship to behavior in adults with autism spectrum disorder: A multicenter magnetic
resonance imaging study. Arch. Gen. Psychiatry 69(2), 195–209 (2012).
28. Di Martino, A. et al. Functional brain correlates of social and nonsocial processes in autism spectrum disorders: An activation
likelihood estimation meta-analysis. Biol. Psychiatry 65, 63–74. https://doi.org/10.1016/j.biopsych.2008.09.022 (2009).
29. Trevarthen, C. & Delafield-Butt, J. T. Autism as a developmental disorder in intentional movement and affective engagement.
Front. Integr. Neurosci. 7, 49 (2013).
30. Ravaja, N., Harjunen, V., Ahmed, I., Jacucci, G. & Spapé, M. M. Feeling touched: Emotional modulation of somatosensory potentials
to interpersonal touch. Sci. Rep. 12(7), 40504 (2017).
31. Ellingsen, D. M. et al. In touch with your emotions: Oxytocin and touch change social impressions while others’ facial expressions
can alter touch. Psychoneuroendocrinology 39, 11–20 (2014).
32. Morrison, I., Björnsdotter, M. & Olausson, H. Vicarious responses to social touch in posterior insular cortex are tuned to pleasant
caressing speeds. J. Neurosci. 24(12), 9544 (2011).
Scientific Reports | (2021) 11:9095 | https://doi.org/10.1038/s41598-021-87919-z 13
Vol.:(0123456789)You can also read