Thorium/uranium mixed oxide nanocrystals: Synthesis, structural characterization and magnetic properties
←
→
Page content transcription
If your browser does not render page correctly, please read the page content below
Nano Research Nano Res 1 DOI 10.1007/s12274‐013‐0379‐6 Thorium/uranium mixed oxide nanocrystals: Synthesis, structural characterization and magnetic properties D. Hudry (), J.-C. Griveau (), C. Apostolidis, O. Walter, E. Colineau, G. Rasmussen, D. Wang, V. S. K. Chakravadhaluna, E. Courtois, C. Kübel, D. Meyer Nano Res., Just Accepted Manuscript • DOI: 10.1007/s12274-013-0379-6 http://www.thenanoresearch.com on October 22, 2013 © Tsinghua University Press 2013 Just Accepted This is a “Just Accepted” manuscript, which has been examined by the peer‐review process and has been accepted for publication. A “Just Accepted” manuscript is published online shortly after its acceptance, which is prior to technical editing and formatting and author proofing. Tsinghua University Press (TUP) provides “Just Accepted” as an optional and free service which allows authors to make their results available to the research community as soon as possible after acceptance. After a manuscript has been technically edited and formatted, it will be removed from the “Just Accepted” Web site and published as an ASAP article. Please note that technical editing may introduce minor changes to the manuscript text and/or graphics which may affect the content, and all legal disclaimers that apply to the journal pertain. In no event shall TUP be held responsible for errors or consequences arising from the use of any information contained in these “Just Accepted” manuscripts. To cite this manuscript please use its Digital Object Identifier (DOI®), which is identical for all formats of publication.
TABLE OF CONTENTS (TOC)

 Thorium / Uranium Mixed Oxide Nanocrystals:
 Synthesis, Structural Characterization and Magnetic
 properties.

 D. Hudry*(1), J.- C. Griveau*(1), C. Apostolidis(1), O.
 Walter(1,6), E. Colineau(1), G. Rasmussen(1), D. Wang(2,3),
 V. S. K. Chakravadhaluna(2,4), E. Courtois(2), C.
 Kübel(2,3), D. Meyer(5)

 (1) European Commission: Joint Research Centre,
 Institute for Transuranium Elements, P. O. Box 2340,
 76125 Karlsruhe, Germany.
 (2) Karlsruhe Institute of Technology, Institute of
 Nanotechnology,      Hermann-von-Helmholtz-Platz           1,
 76344 Eggenstein-Leopoldshafen, Germany.                        We report on the non-aqueous synthesis of Th1-xUxO2 nanocrystals by the
 (3) Karlsruhe Institute of Technology, Karlsruhe Nano           controlled hot co-injection of Th(acac)4 and UO2(OAc)2.2H2O in a highly
 Micro Facility, Hermann-von-Helmholtz-Platz 1, 76344            coordinating organic medium. The synthesis, structure and magnetic
 Eggenstein-Leopoldshafen, Germany.                              properties of the as-prepared nanocrystals are investigated.
 (4) Helmholtz Institute Ulm for Electrochemical Energy
 Storage,    Albert-Einstein-Allee    11,        89069   Ulm,
 Germany.
 (5) Institut de Chimie Séparative de Marcoule, UMR
 5257, BP 17171, 30207 Bagnols sur Cèze Cedex,
 France.
 (6) Karlsruhe Institute of Technology, Institute for
 Catalysis        Research           and           technology,
 Hermann-von-Helmholtz-Platz                1,           76344
 Eggenstein-Leopoldshafen, Germany.

D. Hudry, www.hudry.weebly.com

                                                                                                                                      1
Nano Res
DOI (automatically inserted by the publisher)
Review Article/Research Article Research Article
Thorium / Uranium mixed oxide nanocrystals: synthesis,
structural characterization and magnetic properties.
D. Hudry1 (), J.- C. Griveau1 (), C. Apostolidis1, O. Walter1, 6, E. Colineau1, G. Rasmussen1, D. Wang2,3,
V. S. K. Chakravadhaluna2,4, E. Courtois2, C. Kübel2,3, D. Meyer5
1
European Commission: Joint Research Centre, Institute for Transuranium Elements, P. O. Box 2340, 76125 Karlsruhe, Germany.
2
KIT, Institute of Nanotechnology, Hermann-von-Helmholtz-Platz 1, 76344 Eggenstein-Leopoldshafen, Germany.
3
Karlsruhe Institute of Technology, Karlsruhe Nano Micro Facility, Hermann-von-Helmholtz-Platz 1, 76344
Eggenstein-Leopoldshafen, Germany.
4
Helmholtz Institute Ulm for Electrochemical Energy Storage, Albert-Einstein-Allee 11, 89069 Ulm, Germany.
5
Institut de Chimie Séparative de Marcoule, UMR 5257, BP 17171, 30207 Bagnols sur Cèze Cedex, France.
6
Karlsruhe Institute of Technology, Institute for Catalysis Research and technology, Hermann-von-Helmholtz-Platz 1, 76344
Eggenstein-Leopoldshafen, Germany.
Received: day month year / Revised: day month year / Accepted: day month year (automatically inserted by the publisher)
© Tsinghua University Press and Springer-Verlag Berlin Heidelberg 2011
ABSTRACT
One of the primary aims of the actinide community within nanoscience is to develop a good understanding
similar to what is currently done with stable elements. As a consequence, efficient, reliable and versatile
synthesis techniques dedicated to the formation of new actinide‐based nano‐objects (e.g. nanocrystals) are
necessary. Hence, a ʺlibraryʺ dedicated to the preparation of various actinide‐based nanoscale building blocks is
currently developed. Nanoscale building blocks with tunable sizes, shapes and compositions are of prime
importance. So far, the non‐aqueous synthesis method in highly coordinating organic media is the only
approach which has demonstrated the capability to provide size and shape control of actinide‐based
nanocrystals (both for thorium, uranium and recently extended to neptunium and plutonium). In this paper,
we demonstrated that the non‐aqueous approach is also well adapted to control the chemical composition of
the nanocrystals when mixing two different actinides. Indeed, the controlled hot co‐injection of thorium
acetylacetonate and uranyl acetate (together with additional capping agents) into benzyl ether can be used to
synthesize thorium / uranium mixed oxide nanocrystals covering the full compositional spectrum. Additionally,
we found that both size and shape are modified as a function of the thorium – uranium ratio. Finally, the
magnetic properties of the different thorium / uranium mixed oxide nanocrystals were investigated. Contrary
to several reports, we did not observe any ferromagnetic behavior. As a consequence, ferromagnetism cannot
be described as a universal feature of nanocrystals of non‐magnetic oxides as recently claimed in the literature.
KEYWORDS
thorium, uranium, mixed oxide, non‐aqueous synthesis, nanoparticle, nanocrystal, magnetism
21 Introduction synthesis of actinide‐based NCs. Various methods,
Nanocrystals (NCs) represent fundamental mainly dedicated to uranium oxide NCs, have been
building blocks in nanoscience and nanotechnology. reported without any further development [32‐35].
The small size of NCs modifies their physical and The first controlled synthesis of uranium oxide
chemical properties and size and shape effects are NCs has been proposed by Cao in 2006 according
generally observed at the nanoscale [1‐3]. Another to a non‐aqueous technique in highly coordinating
important feature characterizing NCs is related to organic media [36]. The latter constitutes one of the
their high surface‐to‐volume ratio. Consequently best methods towards the controlled synthesis of
and compared to bulk materials, surface effects are NCs with tunable sizes, shapes and compositions.
not negligible anymore [4]. Hence, NCs in the This non‐aqueous technique has been developed
range of few to tens of nanometers exhibit unusual and applied to the synthesis of thorium oxide
properties which are different to the ones of their nanocrystals [37]. The technique was further
bulk counterparts [5]. Investigating the successfully extended to the first
fundamental chemical and physical properties of transuranium‐based NCs (NpO2) [Hudry et al. RSC
these nanoscale building blocks opens up the way Advances, 2013, accepted manuscript].
to the design of functional nanomaterials with Actinide‐based NCs could fill the gap between
innovative properties and high expectations in molecular clusters, colloids and bulk materials and
fields as diverse as electronic and optoelectronic [6], constitute innovative building blocks both for
energy conversion [7, 8], magnetic storage [9], or applied and fundamental research.
nanomedicine [8, 10‐12]. For example, the migration of radionuclides (and
Investigations and developments related to NCs particularly actinides) in the environment is of
have reached a high level of understanding and major concern for the safety assessment of nuclear
complexity with stable elements. For example, the waste disposal and legacy contamination sites
synthesis of NCs with tunable sizes, shapes and (nuclear accidents – e.g. Chernobyl, Fukushima,
compositions is easily achievable for a wide variety atmospheric nuclear weapon testing). It has been
of compounds (chalcogenides, transition metal reported that plutonium transport through the
oxides, noble metals and lanthanide‐based geosphere is much faster than predicted and
compounds) [13‐17]. The self‐assembly of NCs into colloidal facilitated transport (with the potential
superlattices is also under investigation in order to formation of nanoparticles) has been incriminated
take advantage of both individual and collective [38, 39]. Hence, engineered (i.e. chemical
properties of NCs due to their periodic composition, surface chemistry, size and shape)
arrangement [18‐20]. Finally, over the last decade, actinide‐based NCs could be used as model
doped NCs have received a growing interest due to systems. Actinide‐based NCs and particularly
the possibility to see the emergence of new actinide oxides have recently been proposed as
properties [21‐24]. All these fields are under active potential ʺprecursorsʺ to synthesize innovative
investigations all around the world and stimulate nanostructured nuclear fuels at low temperature
interactions between disciplines as diverse as [40] with enhanced properties in terms of safety.
physics, chemistry, biology and engineering. Finally, it has recently been demonstrated that
Comparatively, much less efforts have been done in core‐shell nanoparticles doped with short half‐life
nanoscience within the actinide community [25, 26]. alpha emitters (e.g. actinium‐225) are of interest for
On one side, this is understandable when taking targeted alpha therapy (TAT) [41]. Additionally,
into consideration difficulties in handling thorium‐227 and uranium‐230 have been proposed
radioactive elements and in particular as potential alpha emitters in TAT [42]. Hence,
transuranium elements which requires the use of understanding the formation of NCs with thorium
dedicated facilities. Nevertheless, whereas some and uranium could be of major interests in
efforts have been done in the fields of nanomedicine (e.g. short half‐life alpha emitters
actinide‐based colloids and molecular clusters doped NCs).
[27‐31], very little is known on the controlled
3Table 1. Starting and final compositions of various mixed oxide (MOX) nanocrystals prepared in this study.
Starting Composition Final Composition
U Th U Th
Sample
(mol. %) (mol. %) (mol. %) (mol. %)
MOX‐1 0 100 0 100
MOX‐2 4.5 95.5 7 93
MOX‐3 9.5 90.5 12 88
MOX‐4 19 81 28 72
MOX‐5 50 50 58 42
MOX‐6 72 28 70.5 29.5
MOX‐7 100 0 100 0
In terms of fundamental research, it would be in highly coordinating organic media, it has been
interesting to know whether size and shape effects shown that the reactivity of thorium and uranium
can give rise to modified or new properties of precursors is significantly different and hence
actinide‐based NCs compared to their bulk influences the final characteristics (i.e. size and
counterparts. It might bring new insights shape) of the as‐prepared NCs [37, 49]. Such a
concerning the solid state physics and the behavior feature can be a major drawback when considering
of 5f electrons whose nature (i.e. localized vs. the formation of mixed oxide NCs. In order to
delocalized) varies throughout the actinide series reach a homogeneous distribution of thorium and
[43, 44]. uranium in the NCs, kinetics of reaction must be
In this article, we report on the synthesis of similar. Indeed, in case the generation of active
thorium / uranium mixed oxide NCs, Th1‐xUxO2 thorium and uranium monomers (i.e. chemical
(with 0 x 1). A hybrid method between species involved to build up the oxide network)
heating‐up and hot injection [45, 46] was used in would be characterized by kinetic constants which
order to achieve a good homogeneity in terms of are too different, various nucleation steps might be
composition as well as size and shape distributions. involved. Consequently, such an effect would lead
The formation of mixed oxide NCs was studied by to a phase segregation. To minimize such a kinetic
powder x‐ray diffraction (PXRD), transmission effect, we modified the controlled hot injection
electron microscopy (TEM) techniques as well as technique which is usually applied to the growth of
by global and local chemical analyses at the core‐shell NCs [50]. Nevertheless, contrary to the
nanometer scale. The obtained data confirmed the synthesis of core‐shell NCs, the main idea is to
formation of mixed oxide NCs over the entire trigger a homogeneous nucleation step by slowly
range of compositions. Additionally, the magnetic increasing the concentration of active thorium‐ and
properties of the as‐prepared NCs have been uranium‐based monomers. Because thorium and
characterized by superconducting quantum uranium oxides crystallize within the same
interference device (SQUID) magnetometry. crystallographic structure (fluorite‐type) and only
Contrary to several reports, we did not observe any exhibit a small cell parameter difference (< 5%),
ferromagnetic behavior. As a consequence, enough material of both thorium and uranium
ferromagnetism cannot be described as a universal should be available to induce the formation of NCs
feature of NCs of non‐magnetic oxides as recently with a homogeneous chemical composition. In our
claimed in the literature [47, 48]. experiments, we apply the controlled hot
co‐injection of a mixture of thorium and uranium
2 Results and discussion precursors in a hot solvent.
In previous articles dedicated to the non‐aqueous
synthesis of pure thorium and uranium oxide NCs
4a b
c d
I / a.u.
40 45 50 55 60
2 /
g e f
f
e
d
c
b
a g h
(111)
20 40 60 80 100 120 (200)
2 / (220)
(311)
Figure 1. Powder x-ray diffraction (PXRD) patterns (left panel) and selected area electron diffraction (SAED) patterns (right panel) of
various thorium / uranium mixed oxide (MOX) nanocrystals synthesized by the controlled hot co-injection technique a) MOX-1, b)
MOX-2, c) MOX-3, d) MOX-4, e) MOX-5, f) MOX-6, g) MOX-7. The inset (left panel) shows an enlargement of the 2 theta area
between 40° - 60°: MOX-1 (blue), MOX-2 (cyan), MOX-3 (black), MOX-4 (violet), MOX-5 (orange), MOX-6 (red), MOX-7 (green).
Tick-marks indicate bulk thorium dioxide (green) and bulk uranium dioxide (magenta) Bragg peaks positions. The scheme (h) shows the
indexation of the SAED patterns.
Therefore, thorium acetylacetonate (Th(acac)4) and simplicity the samples will be referred to in the
uranyl acetate (UO2(OAc)2.2H2O) are dissolved in a manuscript as MOX‐X (with X = 1, 2, 3, 4, 5, 6 or 7).
mixture composed of oleic acid (OA),
tri‐n‐octylamine (N(Oct)3), tri‐n‐octyplhosphine 2.1 Structural characterization
oxide (OP(Oct)3) and benzyl ether (BnOBn). The The PXRD patterns of the different MOX samples are
resulting mixture (kept at room temperature) is then given in Fig. 1 (left panel) as well as the Bragg peak
slowly injected in BnOBn maintained at 260°C. After positions (tick‐marks in Fig. 1) of bulk thorium and
injection, the resulting solution is kept at 260°C for uranium dioxides. Although the peaks are very
additional aging. During that time, the hot solution broad (due to the small size of the crystallites), all
gradually turns from colorless (i.e. pure BnOBn) to MOX samples are very well crystallized. Indeed,
light yellow and finally to black‐brown (depending Bragg reflections are visible in a wide 2 range (up to
on the starting uranium concentration). When the 120°). All PXRD patterns have been fitted using the
thorium precursor is injected without uranium, the Rietveld method with the bulk structure of thorium
solution only turns from colorless to deep yellow. dioxide. The detailed results of the Rietveld
Different mixed oxide (MOX) samples were refinements are given in the supporting information
prepared with various starting thorium / uranium (Figures S1 to S7 and Table S2 in the ESM). Bulk
ratios reported in Table 1. Additionally, Table S1 in thorium and uranium dioxides crystallize in the
the Electronic Supplementary Material (ESM) fluorite structure (space group Fm‐3m) with a
provides an overview of the global chemical slightly different cell parameter namely 5.61 Ǻ and
composition (i.e. molar quantities of the actinide 5.43 Ǻ respectively. In the elementary cell,
precursors and organics) for each MOX sample. For thorium/uranium and oxygen atoms are placed on
5the 4a or 8c special positions (0/0/0; 0.25/0.25/0.25), According to Vegard’s law, the average parameter
respectively. As a consequence, only few parameters should vary linearly with dopant concentration in
can be refined. In our case, additionally to the the crystal and deviations from linearity are
classical parameters (i.e. polynomial terms for the indications of phase transitions or segregation (i.e.
background and scale factor), only parameters with a distinct phases). Because the Bragg peaks in XRD are
physical meaning have been refined: the cell very broad, electron diffraction (ED) was used as an
parameter (a), the crystallite size (according to the additional proof to exclude significant amounts of
fundamental approach [51]) and the isotropic atomic homo metal oxides. Because of the short wavelength
displacement parameters (Uiso). The site occupancy of the electrons, the electron diffraction pattern is
of the 4a position (i.e. Th/U position) cannot be sharper and a superposition of different
refined because the atomic diffusion factors of nanocrystalline phases will be easier to detect by ED
thorium and uranium are too close. In other words, than by PXRD. The selected area electron diffraction
x‐rays are not suitable to distinguish thorium from (SAED) patterns of the MOX samples are given in
uranium. As a consequence, the site occupancy of the Fig. 1 (right panel). All SAED patterns were indexed
4a position cannot be used to validate the formation with the FCC structure in good agreement with the
of a solid solution. The final composition of the bulk structure of AnO2 (An = Th, U). The (220)
different MOX samples and particularly the Th:U reflection is particularly interesting because it is the
ratio was determined by inductively coupled plasma main non‐overlapped reflection with a high intensity.
mass spectrometry (ICP‐MS) and the results are For all MOX samples, the intensity of the (220)
given in Table 1. The final composition slightly reflection is homogenous and no splitting can be
differs from the nominal one revealing slight seen, thus supporting the conclusion of the
differences between thorium and uranium reactivity. formation of thorium / uranium mixed oxide NCs
Nevertheless, these results give an accurate idea without any significant phase segregation. Another
about the total thorium and uranium contents for interesting feature from both the PXRD and SAED
each MOX sample and were used to plot the patterns is related to the width of the Bragg peaks
evolution of the cell parameter (i.e. a) as a function of (x‐rays) or electron diffraction rings (electrons). For
the uranium content (Fig. 2). The cell parameter example in the case of PXRD, the full width at half
follows a linear evolution over the total range of maximum of the (220) reflection is plotted in Fig. 2
composition (i.e. from 0 mol.% of uranium up to 100 (inset) and clearly indicates that the higher the
mol.%). uranium content the sharper the peaks. A similar
feature is observed with the (220) electron diffraction
100
5.62 3.0
ring. As a consequence, when adding uranium to the
80
5.60 reactive mixture which contains thorium, bigger NCs
U content / mol. %
2.5
60
5.58 are obtained.
FWHM /
2.0 40
5.56 20 To determine the size and shape distributions, all
1.5
cell parameter /
5.54 0 MOX NCs were characterized by transmission
1.0
MOX-1 MOX-2 MOX-3 MOX-4 MOX-5 MOX-6 MOX-7
5.52 electron microscopy (TEM). Panels in Fig. 3 show the
5.50 scanning transmission electron microscopy (STEM)
5.48 images (Fig. 3a) along with the transmission electron
5.46 microscopy (TEM) images (Fig. 3b) and high
5.44 resolution TEM (HRTEM) images (Fig. 3c) as well as
5.42
0 20 40 60 80 100 the energy‐dispersive x‐ray spectroscopy (EDX)
U content / mol. % spectra (Fig. 3d) of the as‐prepared MOX samples.
Figure 2. Evolution of the cell parameter of the fluorite structure The HRTEM pictures (Fig. 3c1 to 3c7) indicate that the
as a function of the uranium content determined by ICP-MS
NCs are highly crystalline. Concerning MOX‐X (X = 4,
analysis of the as prepared thorium / uranium mixed oxide
(MOX) nanocrystals. The inset shows the evolution of the full 5, 6 and 7) samples, all prepared NCs are single
width at the half maximum (FWHM) of the (220) reflection of domain (Fig. 3c4 to 3c7).
the as-prepared MOX nanocrystals and their corresponding
uranium content.
6a1 b1 c1 d1
0 5 10 15 20
Energy / keV
a2 b2 c2 d2
0 5 10 15 20
Energy / keV
a3 b3 c3 d3
Thorium content
0 5 10 15 20
Energy / keV
a4 b4 c4 d4
0 5 10 15 20
Energy / keV
a5 b5 c5 d5
0 5 10 15 20
Energy / keV
a6 b6 c6 d6
0 5 10 15 20
Energy / keV
a7 b7 c7 d7
0 5 10 15 20
Energy / keV
Figure 3. The panels show STEM images (a1-a7), TEM images (b1-b7), HRTEM images (c1-c7) and EDX spectra of individual
nanocrystals (d1-d7) of thorium / uranium mixed oxide (MOX) nanocrystals synthesized by the controlled hot co-injection in BnOBn
(260°C) of Th(acac)4 and UO2(OAc)2.2H2O solved in a mixture of OA, N(Oct)3, OP(Oct)3 and BnOBn (RT). Each row represents the
full TEM characterization (i.e. STEM, TEM, HRTEM and EDX) of a sample with a given thorium/uranium composition. The thorium
content increases from the bottom to the top. Color code used for the EDX spectra: thorium (blue), uranium (green), oxygen (yellow),
copper from the support grid (red) and silicon as an impurity on the support grid (orange).
7In case of the MOX‐1 sample, the nanowires consist 80
a 30
b
Number of particles
of extended domains along the wire axis, but only 20
40
Number of particles
Number of particles
60
few nanowires are single domain (Fig. 3c1). Analysis 10
40 0
of the STEM images enables easy extraction of 0 10 20 30
Long length axis / nm
40 50
20
20
information concerning the size and shape
0 0
distributions. In case of pure thorium oxide (MOX‐1 0 1 2 3
Short length axis / nm
4 5 0 2 4 6 8 10 12 14
Feret's diameter / nm
16 18 20
sample, Fig. 3a1), the as‐prepared NCs are highly c d
anisotropic nanowires. Although we previously 200
Number of particles
Number of particles
100
reported such a feature [49] the controlled hot
co‐injection dramatically changes the final 50
100
characteristics of the NCs and particularly the aspect
ratio between the long and short axes. Additionally, 0
0 2 4 6 8 10 12 14
Feret's diameter / nm
16 18 20
0
0 2 4 6 8 10 12 14
Feret's diameter / nm
16 18 20
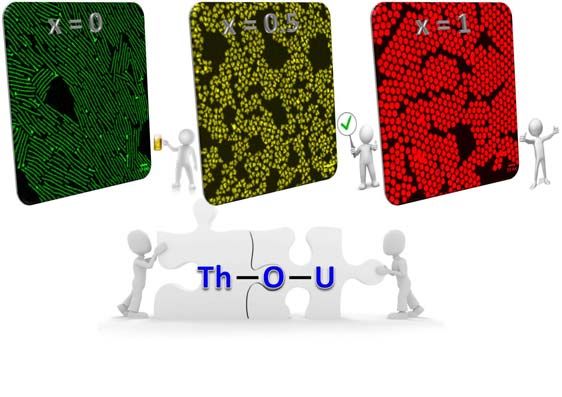
narrower size and shape distributions are observed. e
250
f
The mean size of the short length axis is 1.5 0.2 nm
150
200
Number of particles
Number of particles
whereas the mean size of the long axis is 22.5 5.7 100
150
nm (Fig. 4a). It has to be noticed that although the 100
50
shape distribution is much better with the controlled 50
hot co‐injection technique compared to the 0
0 2 4 6 8 10 12 14 16 18 20
0
0 2 4 6 8 10 12 14 16 18 20
Feret's diameter / nm Feret's diameter / nm
heating‐up technique, it is not perfect yet. Indeed, a Figure 4. Size distribution of thorium / uranium mixed oxide
few small dog‐bones like thorium oxide nanocrystals (MOX) nanocrystals synthesized by the controlled hot
co-injection in BnOBn (260°C) of Th(acac)4 and
were also observed (Fig. S8 in the ESM). Adding
UO2(OAc)2.2H2O solved in a mixture of OA, N(Oct)3, OP(Oct)3
small quantities of uranium during the controlled and BnOBn (RT). a) MOX-1 according to the short and long
hot injection is sufficient to prevent the growth of (inset) axes, b) MOX-2, c) MOX-3, d) MOX-4, e) MOX-5, f)
anisotropic NCs. Indeed, when co‐injecting 4.5 mol. MOX-7. Because of the agglomerated nanocrystals for the
MOX-6 sample, the corresponding size distribution is not
% of uranium and 95.5 mol. % of thorium, isotropic available.
NCs are obtained (Fig. 3a2) although a negligible
percentage (< 1 %) of elongated particles is still Increasing the uranium content up to 50 mol.% does
visible. The TEM and HRTEM images (Fig. 3b2 and not change the final characteristics of the as‐prepared
3c2) clearly show that the as‐prepared NCs are NCs (MOX‐5 sample, Fig. 3a5). The size distribution
characterized by highly irregular shapes. Despite shows slightly bigger NCs with a mean Feret
that, the NCs are essentially single crystalline (Fig. diameter of 7.1 1.5 nm (Fig. 4e) whereas the shape
3c2). Slightly increasing the uranium content (9.5 mol. is not altered and still homogeneous (Fig. S12 in the
% of uranium) induces the formation of similar NCs ESM). For a higher uranium content (MOX‐6 sample,
(Fig. 3a3, 3b3, 3c3) without any evidence of nanowires 72 mol.% of uranium) agglomerates of small NCs are
(Fig. S10 in the ESM). Additionally, the size obtained (Fig. 3a6) similar to the formation of nano
distribution is improved compared to MOX‐2 (Fig. flowers reported for In2O3 [52] or Mn‐doped ZnO
4b and 4c). The co‐injection of 19 mol.% of uranium NCs [53]. Similarly to the others MOX samples, the
and 81 mol.% of thorium still induces the formation size and shape distribution are homogeneous (Fig.
of isotropic NCs (Fig. 3a4). Nevertheless, the S13 in the ESM). Nevertheless, in this particular case
as‐prepared NCs look like highly faceted. Compared a detailed size distribution analysis could not be
to the samples with a low uranium content (i.e. performed due to the aggregation of the primary
MOX‐2 and MOX‐3), the NCs are characterized by a particles. Finally, in the case of pure uranium
similar size with a mean Feret diameter of 6.9 1.4 (MOX‐7 sample), highly monodisperse nanodots (Fig.
nm (Fig. 4d). The corresponding shape distribution is 3a7) with a mean Feret diameter of 10.7 0.6 nm
homogeneous and only one population, without any (Figure 4f) were obtained. The STEM data clearly
evidence of anisotropic NCs, was observed show that the addition of uranium prevents the
throughout the TEM grid (Fig. S11 in the ESM). formation of anisotropic NCs in favor of bigger
isotropic ones.
85.0 2.0
0.03
a) UO2 nano b)
4.5 1.8
Th0.72U0.28O2 nano
0.02 Th0.30U0.70O2 nano
4.0 1.6 Th0.42U0.58O2 nano
H = 70 kOe
-1
-1
0.01
/ emu.g
Th0.72U0.28O2 nano
M/H / 10 emu.mol
3.5 31 K UO2 sc 1.4 0.00 ThO2 nano
-1
UO2 nano
3.0 1.2
/ emu.g
Th0.30U0.70O2 nano -0.01
T=5K
Th0.42U0.58O2 nano
2.5 1.0 -0.02
-3
Th0.72U0.28O2 nano
2.0 ThO2 nano 0.8 -0.03
-8 -6 -4 -2 0 2 4 6 8
ThO2 bulk H / kOe
1.5 0.6
T=5k
1.0 0.4
0.5 0.2
0.0 0.0
-0.5 -0.2
0 50 100 150 200 250 300 0 10 20 30 40 50 60 70
T/K H / kOe
Figure 5. Magnetization measurements of the thorium / uranium mixed oxide (MOX) NCs. Figure 5a presents the molar magnetic
response M/H = mol for all MOX samples at 70 kOe. References curves from UO2 single crystal (SC) and ThO2 powder (bulk) have
been added for comparison. The magnetic transition is clearly visible at a temperature ~31 K for single crystal measurements. Neither
anomaly nor magnetic features are observed on the NCs. We observe a progressive reduction of magnetization with Th doping from a
Curie-Weiss like shape to a pure diamagnetic response for ThO2 based NCs. Th0.42U0.58O2 (MOX-5) NCs present an enhanced molar
magnetic susceptibility while Th0.72U0.28O2 (MOX-4) NCs magnetic susceptibility crosses diamagnetic line above 150 K. Figure 5b
presents the magnetization response with field at 5K. We do not observe any ferromagnetic features neither at low field nor at high field
up to 70 kOe. Top left inset shows the hysteresis loop for Th0.72U0.28O2 (MOX-4) NCs displaying perfect linear field dependence typical
of pure paramagnetic systems.
A modified molecular reactivity controlling the and uranium within a single MOX nanocrystal.
concentration of active monomers in solution or Additionally, the relative intensities of the thorium
differences (doped vs. non‐doped) related to the and uranium lines follow the trend of the data
surface energies of the seeds could explain the shape obtained by ICP‐MS analysis from the thorium‐rich
modification. Moreover, the homogeneous shape sample (MOX‐2) to the thorium‐poor sample
distribution for all thorium / uranium mixed oxides (MOX‐6). Hence, the EDX analysis used as a local
(Fig. S9 to S13 in the ESM) constitutes an additional probe for single NCs corroborates the data obtained
proof concerning the formation of mixed oxides by PXRD and ED and support the formation of
without any significant segregation (i.e. mixture of mixed oxides.
thorium oxide and uranium oxide), which should
lead to a mixture of both anisotropic and isotropic 2.2 Magnetism
NCs. As previously demonstrated, thorium oxide
easily forms anisotropic NCs when Th(acac)4 is used Magnetic molar susceptibility of the uranium –
as a starting precursor and so far a shape thorium mixed oxide NCs are clearly different
modification of thorium oxide NCs has only been compared to bulk uranium dioxide. Indeed, they
achievable by modifying the chemical nature of the present reduced values and no anomaly reminiscent
starting thorium precursor [49]. of the 31 K antiferromagnetic transition can be
To strengthen the structural characterization, EDX identified. The uranium rich NC magnetic
was used as a nanoscale local probe to get susceptibility M/H= can be described by a Curie
information about the chemical composition of Weiss behavior (=C/(T‐P)) with C, Curie constant
individual NCs. For each MOX sample the and P, Curie paramagnetic temperature. When
corresponding results are displayed in Figures 3c1 to substituting uranium by thorium in the ThxU1‐xO2
3c7. Although the EDX spectra are too noisy for a NCs, a change of from Curie Weiss for UO2 NCs
quantitative analysis, they can be used qualitatively. (MOX‐7) to a pure TIP diamagnetic behavior for
Accordingly, for each MOX sample (with the ThO2 NCs (MOX‐1) is observed (Fig. 5 a). This trend
exception of pure thorium and uranium dioxides), was already reported by Slowinski et al. for bulk
the EDX spectra show the presence of both thorium thorium / uranium solid solutions [54]. Parameters
9such as effective moment eff and paramagnetic nanoparticles, x‐ray magnetic circular dichroism
Curie temperature P, exhibit a continuous change (XMCD) and x‐ray absorption spectroscopy spectra
with increased percentage of thorium substituting (Au L3 and L2 edges) suggested the possibility of
uranium in the lattice. Nevertheless, when spin polarization states developing within the
approaching 25 mol.% of uranium, a significant nanoparticles and being at the origin of a super
discontinuity from the linear dependence for P with paramagnetic state [57]. The presence of defects due
the uranium content was observed. Curie Weiss fits to the high surface‐to‐volume ratio within NCs has
of our data for MOX‐7, MOX‐6 and MOX‐5 lead to also been suggested to be at the origin of
eff = 0.61, 0.58, and 0.8 B , with P = ‐31, ‐30, and ‐34 ferromagnetism and especially the spin polarized
K, respectively. These values are clearly different state induced by point defects [58]. Whereas
from the ones obtained for bulk crystals (3.11 B and ferromagnetic features reported in the literature are
‐208 K). MOX‐4 has the particularity to display a already observed at room temperature [48], no hint
diamagnetic behavior at high temperature and an of magnetic order is observed from room
important paramagnetic upturn at low temperature. temperature down to 2 K when considering thorium
Finally, MOX‐1 is purely diamagnetic as the / uranium MOX NCs.
reference bulk ThO2 we used. Interestingly its
diamagnetic signal is even enhanced and constant in 3. Conclusions
the full temperature range at d= ‐2.1x10‐4 emu.mol‐1
at 300 K. Efficient, reliable and versatile synthetic techniques
Considering magnetic response with field on Fig. 5b, dedicated to the formation of new actinide‐based
it is obvious that no ferromagnetic response is nano‐objects are the cornerstone towards a good
noticeable. Even at the lowest temperature achieved understanding of actinide‐based nanoscience. To
(2 K) and at highest field achievable (70 kOe), no date, the non‐aqueous method in highly
hysteresis was observed. Figure 5b indicates the coordinating organic media is the only one having
magnetization per gram for representative MOX demonstrated its capability concerning size and
systems. A slight curvature is visible for MOX‐7 to shape control of actinide‐based NCs. In this paper,
MOX‐5 but no magnetic hysteresis was noticeable. we demonstrated that the non‐aqueous synthesis is
The curvature observed could possibly be associated well adapted to control the chemical composition of
to a superparamagnetic state developing at low the as‐prepared NCs. Indeed, the controlled hot
temperature. MOX‐4 was examined at low field and co‐injection of Th(acac)4 and UO2(OAc)2.2H2O
at low temperature (T= 5K) (Inset Fig. 5b) but no (together with additional capping agents) into hot
difference for the magnetization curves is observed BnOBn can be used to synthesize Th1‐xUxO2 NCs
for increasing and decreasing magnetic fields. within the entire range of compositions. Additionally,
The absence of ferromagnetic behavior in all MOX both size and shape are modified as a function of the
NCs studied in the present work is a strong Th:U ratio. Hence, the controlled hot co‐injection
argument against the universality of ferromagnetism technique opens up the way to synthesize various
in non‐magnetic metal oxide NCs as recently doped (e.g. transuranium elements, lanthanides or
proposed [47, 55]. On one side, recent works have even transition metals) actinide‐based NCs. When
pointed out the importance of the preparation moving from UO2 to ThO2 based NCs, we observe
process and the possible occurrence of magnetic the disappearance of a Curie‐Weiss like magnetic
impurities during the synthesis as being a potential behavior replaced by a TIP diamagnetic feature as
source of misinterpretation [56]. It has also been for bulk materials. But contrary to reported magnetic
shown that Fe‐doped ZnO was necessary to observe features of various nanocrystalline systems, no hint
ferromagnetism. On the other side, several routes of ferromagnetism has been observed down to 2 K in
have been proposed to explain the intrinsic our materials, especially for pure non‐magnetic ThO2
properties of these unconventional ferromagnetic based NCs.
systems. For instance, despite the absence of clear
ferromagnetic magnetization curves of gold
104. Materials and Method the thermally treated mixture. The optically clear
solution turns turbid immediately. After
Chemicals. Benzyl ether (BnOBn, 99%, Acros centrifugation (4000 rpm, 30 min) the clear
Organics), trioctylphosphine oxide (OP(Oct)3, >98%, supernatant is discarded and the resulting
Merck), oleic acid (OA, Ph. Eu., Fluka), oleylamine precipitate is dispersed in apolar solvents (e.g.
(OAm, 80 – 90% C18 content, Acros Organics ) toluene). This purification procedure (ethanol
trioctylamine (N(Oct)3, >99%, Fluka ), ethanol precipitation – centrifugation – toluene dispersion) is
(absolute, Merck) and toluene (min 99.7%, repeated three times to remove all residual organics.
Sigma‐Aldrich) were used as received without For the last purification cycle, the final toluene
further purification. Thorium acetylacetonate dispersion is centrifuged 20 minutes at 8000 rpm in
(Th(acac)4) was purchased from International order to remove eventual insoluble materials.
Bio‐Analytical Industries Inc. (Boca Raton, Florida,
USA). Th(acac)4 was purified prior to use (Electronic Powder X‐Ray Diffraction. PXRD measurements
Supplementary Material). Uranyl acetate were performed at room temperature in
(UO2(OAc)2.2H2O) was synthesized as described in Bragg‐Brentano geometry using a Bruker D8
the Electronic Supplementary Material. Advance powder diffractometer with a copper
anticathode and a (111) Ge monochromator. The D8
Synthesis of Th/U mixed oxide NCs. All syntheses Advance is equipped with a 1‐dimensional detector
were performed using air‐free (Schlenk) techniques (LynxEye). PXRD patterns were recorded in the
under purified argon atmosphere. First, a stock range 10° ‐ 120° with a step size of 0.03° and a
solution containing thorium and uranium precursors counting time of 15 s per step. Rietveld refinements
is prepared. Th(acac)4 and UO2(OAc)2.2H2O are were performed using Jana 2006 software with the
solved (T = 60°C) in a mixture of OA, N(Oct)3, fundamental approach method. XRD samples were
OP(Oct)3 and BnOBn. All reagents quantities for each prepared by drop‐casting solutions of thorium /
sample are given in Table S1 in the Electronic uranium mixed oxide nanocrystals (precipitated in
Supplementary Material. The as‐obtained clear ethanol) onto a (911)‐oriented silicon substrate.
yellow solution (the color intensity depending on the
uranium content) is degassed under vacuum (5.10‐2 Transmission Electron Microscopy. TEM analysis
mbar) at 100°C for 20 minutes. The solution is then was performed using an image corrected FEI Titan
cooled down to room temperature and transferred 80‐300 microscope operated at 300 kV and equipped
(under inert atmosphere) into a 10 mL dropping with a Gatan US1000 CCD camera for TEM imaging
funnel connected to a four‐neck flask. Additionally, and electron diffraction. Scanning transmission
the four‐neck flask is equipped with a water electron microscopy (STEM) images were acquired
condenser, a PTFE stopcock connected to the Schlenk using a HAADF (High Angle Annular Dark Field)
line (Ar supply) and a Thermocouple. The second detector with a nominal spot size of 0.14 nm. EDX
step consists in transferring a given quantity of analysis was performed in STEM mode with a
BnOBn (previously degassed under vacuum and nominal spot size of 0.5 nm using an EDAX S‐UTW
stored over 4 Å molecular sieves) into the four EDX detector.
neck‐flask and heating up to 260°C. When the TEM samples were prepared by drop‐casting diluted
temperature is stabilized at 260°C, the stock solution suspensions of the thorium / uranium mixed oxide
is added (drop‐wise). After complete injection of the nanocrystals in toluene onto carbon coated copper
stock solution, the mixture is kept at 260°C for grids (Quantifoil holey carbon grids coated with a 2
additional 30 minutes (Fig. S11 in the ESI). nm thickness carbon layer).
Afterwards, the heating mantle is removed and the
flask is left to cool naturally to room temperature. Inductively Coupled Plasma Mass Spectrometry.
The analyses were performed with a double focusing
NCs recovering and purification procedure. magnetic sector field ICP‐MS (Finnigan Element2).
Absolute ethanol is added at room temperature to The dried thorium / uranium mixed oxide
11nanocrystals were dissolved in concentrated nitric composition-dependent properties of some colloidal
acid (14 M). After complete dissolution and dilution semiconductor nanocrystals. Acc. Chem. Res. 2004,
the thorium and uranium contents were determined 37, 326-333.
by ICP‐MS.
3. Alivisatos, A. P. Nanocrystals: Building blocks for
Magnetic properties. modern materials design. Endeavour 1997, 21, 56-60.
4. Goesmann, H.; Feldmann, C. Nanoparticulate
Magnetization and d.c. magnetic susceptibility were Functional Materials. Angew. Chem., Int. Ed. 2010,
measured on the encapsulated (under Ar atmosphere) 49, 1362-1395.
fresh NCs in the temperature range 2 ‐ 300 K and in 5. Peng, X. An essay on synthetic chemistry of colloidal
magnetic fields up to 7 T using a Quantum Design
nanocrystals. Nano Res. 2009, 2, 425-447.
MPMS‐7 superconducting quantum interference
6. Talapin, D. V.; Lee, J. S.; Kovalenko, M. V.;
device (SQUID). Magnetic contribution of the argon
filled Plexiglass container was determined before Shevchenko, E. V. Prospects of colloidal nanocrystals
encapsulation and subtracted. Resulting data were for electronic and optoelectronic applications. Chem.
corrected for the diamagnetic contribution using Rev. 2010, 110, 389-458.
Pascal’s constants. Magnetic calibration was done 7. Semonin, O. E.; Luther, J. M.; Beard, M. C. Quantum
with a cylindrical palladium standard having
dots for next-generation photovoltaics. Mater. Today
approximately the same geometry of the measured
2012, 15, 508-515.
samples.
8. Lohse, S. E.; Murphy, C. J. Applications of colloidal
inorganic nanoparticles: From medicine to energy. J.
Acknowledgements Am. Chem. Soc. 2012, 134, 15607-15620.
9. Lee, D. C.; Smith, D. K.; Heitsch, A. T.; Korgel, B. A.
This work was partially carried out with the support Colloidal magnetic nanocrystals: Synthesis,
of the Karlsruhe Nano Micro Facility (KNMF, properties and applications. Annu. Rep. Prog. Chem.
www.knmf.kit.edu) a large‐scale research C 2007, 103, 351-402.
infrastructure of the Helmholtz Society at the 10. Reddy, L. H.; Arias, J. L.; Nicolas, J.; Couvreur, P.
Karlsruhe Institute of Technology (KIT, Magnetic nanoparticles: Design and characterization,
www.kit.edu). Daniel Bouexiere is acknowledged for
toxicity and biocompatibility, pharmaceutical and
his help with powder x‐ray diffraction
biomedical applications. Chem. Rev. 2012, 112,
measurements performed in a dedicated glove‐box
for radioactive samples. 5818-5878.
11. Wang, X.; Yang, L.; Chen, Z.; Shin, D. M.
Electronic Supplementary Material: Supplementary
Application of nanotechnology in cancer therapy and
material (purification of Th(acac)4, synthesis of
imaging. Ca-Cancer J. Clin. 2008, 58, 97-110.
UO2(OAc)2.2H2O, composition of the reactive
12. Bouzigues, C.; Gacoin, T.; Alexandrou, A. Biological
mixtures, experimental thermal profiles, results of
the Rietveld refinements and additional TEM applications of rare-earth based nanoparticles. ACS
pictures) is available in the online version of this Nano 2011, 5, 8488-8505.
article at http://dx.doi.org/10.1007/s12274‐***‐****‐*. 13. Kwon, S. G.; Hyeon, T. Colloidal Chemical Synthesis
and Formation Kinetics of Uniformly Sized
References Nanocrystals of Metals, Oxides, and Chalcogenides.
1. Hodes, G. When small is different: Some recent
Acc. Chem. Res. 2008, 41, 1696-1709.
advances in concepts and applications of nanoscale
14. Park, J.; Joo, J.; Kwon, S. G.; Jang, Y.; Hyeon, T.
phenomena. Adv. Mater. 2007, 19, 639-655.
Synthesis of monodisperse spherical nanocrystals.
2. El-Sayed, M. A. Small is different: Shape-, size-, and
Angew. Chem., Int. Ed. 2007, 46, 4630-4660.
1215. Rao, C. N. R.; Vivekchand, S. R. C.; Biswasa, K.; 27. Wilson, R. E.; Skanthakumar, S.; Soderholm, L.
Govindaraja, A. Synthesis of inorganic nanomaterials. Separation of plutonium oxide nanoparticles and
Dalton Trans. 2007, 3728-3749. colloids. Angew. Chem., Int. Ed. 2011, 50,
16. Jun, Y. W.; Choi, J. S.; Cheon, J. Shape control of 11234-11237.
semiconductor and metal oxide nanocrystals through 28. Biswas, B.; Mougel, V.; Pécaut, J.; Mazzanti, M.
nonhydrolytic colloidal routes. Angew. Chem., Int. Ed. Base-driven assembly of large uranium oxo/hydroxo
2006, 45, 3414-3439. clusters. Angew. Chem., Int. Ed. 2011, 50, 5745-5748.
17. Jun, Y. W.; Lee, J. H.; Choi, J. S.; Cheon, J. 29. Ling, J.; Qiu, J.; Sigmon, G. E.; Ward, M.;
Symmetry-controlled colloidal nanocrystals: Szymanowski, J. E. S.; Burns, P. C. Uranium
Nonhydrolytic chemical synthesis and shape pyrophosphate/methylenediphosphonate
determining parameters. J. Phys. Chem. B 2005, 109, polyoxometalate cage clusters. J. Am. Chem. Soc.
14795-14806. 2010, 132, 13395-13402.
18. Dong, A.; Chen, J.; Vora, P. M.; Kikkawa, J. M.; 30. Soderholm, L.; Almond, P. M.; Skanthakumar, S.;
Murray, C. B. Binary nanocrystal superlattice Wilson, R. E.; Burns, P. C. The structure of the
membranes self-assembled at the liquid-air interface. plutonium oxide nanocluster [Pu38O
Nature 2010, 466, 474-477. 56Cl54(H2O)8]14. Angew. Chem., Int. Ed. 2008, 47,
19. Rogach, A. L.; Talapin, D. V.; Shevchenko, E. V.; 298-302.
Kornowski, A.; Haase, M.; Weller, H. Organization of 31. Burns, P. C.; Kubatko, K. A.; Sigmon, G.; Fryer, B. J.;
matter on different size scales: Monodisperse Gagnon, J. E.; Antonio, M. R.; Soderholm, L. Actinyl
nanocrystals and their superstructures. Adv. Funct. peroxide nanospheres. Angew. Chem., Int. Ed. 2005,
Mater. 2002, 12, 653-664. 44, 2135-2139.
20. Levchenko, T. I.; Kübel, C.; Huang, Y.; Corrigan, J. F. 32. Rousseau, G.; Fattahi, M.; Grambow, B.; Desgranges,
From Molecule to Materials: Crystalline Superlattices L.; Boucher, F.; Ouvrard, G.; Millot, N.; Niepce, J. C.
of Nanoscopic CdS Clusters. Chem. Eur. J. 2011, 17, Synthesis and characterization of nanometric powders
14394-14398. of UO2+x, (Th,U)O2+x and (La,U)O2+x. J. Solid
21. Buonsanti, R.; Milliron, D. J. Chemistry of doped State Chem. 2009, 182, 2591-2597.
colloidal nanocrystals. Chem. Mater. 2013, 25, 33. Wang, Q.; Li, G. D.; Xu, S.; Li, J. X.; Chen, J. S.
1305-1317. Synthesis of uranium oxide nanoparticles and their
22. Norris, D. J.; Efros, A. L.; Erwin, S. C. Doped catalytic performance for benzyl alcohol conversion
nanocrystals. Science 2008, 319, 1776-1779. to benzaldehyde. J. Mater. Chem. 2008, 18,
23. Bryan, J. D.; Gamelin, D. R., in Progress in Inorganic 1146-1152.
Chemistry2005, vol. 54, pp. 47-126. 34. Kumar, D.; Dey, G. K.; Gupta, N. M. Nanoparticles of
24. Erwin, S. C.; Zu, L.; Haftel, M. I.; Efros, A. L.; uranium oxide occluded in MCM-41 silica host:
Kennedy, T. A.; Norris, D. J. Doping semiconductor Influence of synthesis condition on the size and the
nanocrystals. Nature 2005, 436, 91-94. chemisorption behavior. Phys. Chem. Chem. Phys.
25. Shi, W.-Q.; Yuan, L. Y.; Li, Z. J.; Lan, J. H.; Zhao, Y. 2003, 5, 5477-5484.
L.; Chai, Z.-F., in Radiochim. Acta2012, vol. 100, pp. 35. Zhang, Z. T.; Konduru, M.; Dai, S.; Overbury, S. H.
727-736. Uniform formation of uranium oxide nanocrystals
26. Tsivadze, A. Y.; Ionova, G. V.; Mikhalko, V. K. inside ordered mesoporous hosts and their potential
Nanochemistry and supramolecular chemistry of applications as oxidative catalysts. Chem. Commun.
actinides and lanthanides: Problems and prospects. 2002, 2406-2407.
Prot. Met. Phys. Chem. Surf. 2010, 46, 149-169. 36. Wu, H. M.; Yang, Y. G.; Cao, Y. C. Synthesis of
13colloidal uranium-dioxide nanocrystals. J. Am. Chem. Today 2009, 4, 96-106.
Soc. 2006, 128, 16522-16523. 48. Sundaresan, A.; Bhargavi, R.; Rangarajan, N.;
37. Hudry, D.; Apostolidis, C.; Walter, O.; Gouder, T.; Siddesh, U.; Rao, C. N. R. Ferromagnetism as a
Courtois, E.; Kübel, C.; Meyer, D. Non-aqueous universal feature of nanoparticles of the otherwise
Synthesis of Isotropic and Anisotropic Actinide Oxide nonmagnetic oxides. Phys. Rev. B 2006, 74, 161306.
Nanocrystals. Chem. Eur. J. 2012, 18, 8283-8287. 49. Hudry, D.; Apostolidis, C.; Walter, O.; Gouder, T.;
38. Novikov, A. P.; Kalmykov, S. N.; Utsunomiya, S.; Courtois, E.; Kübel, C.; Meyer, D. Controlled
Ewing, R. C.; Horreard, F. o.; Merkulov, A.; Clark, S. synthesis of thorium and uranium oxide nanocrystals.
B.; Tkachev, V. V.; Myasoedov, B. F. Colloid Chem. Eur. J. 2013, 19, 5297-5305.
Transport of Plutonium in the Far-Field of the Mayak 50. Reiss, P.; Protière, M.; Li, L. Core/shell
Production Association, Russia. Science 2006, 314, semiconductor nanocrystals. Small 2009, 5, 154-168.
638-641. 51. Cheary, R. W.; Coelho, A. A. Axial Divergence in a
39. Kersting, A. B.; Efurd, D. W.; Finnegan, D. L.; Rokop, Conventional X-ray Powder Diffractometer. I.
D. J.; Smith, D. K.; Thompson, J. L. Migration of Theoretical Foundations. J. Appl. Crystallogr. 1998,
plutonium in ground water at the Nevada Test Site. 31, 851-861.
Nature 1999, 397, 56-59. 52. Narayanaswamy, A.; Xu, H. F.; Pradhan, N.; Kim, M.;
40. Nenoff, T. M.; Jacobs, B. W.; Robinson, D. B.; Peng, X. G. Formation of nearly monodisperse In2O3
Provencio, P. P.; Huang, J.; Ferreira, S.; Hanson, D. J. nanodots and oriented-attached nanoflowers:
Synthesis and low temperature in situ sintering of Hydrolysis and alcoholysis vs pyrolysis. J. Am. Chem.
uranium oxide nanoparticles. Chem. Mater. 2011, 23, Soc. 2006, 128, 10310-10319.
5185-5190. 53. Yang, Y. F.; Jin, Y. Z.; He, H. P.; Wang, Q. L.; Tu, Y.;
41. McLaughlin, M. F.; Woodward, J.; Boll, R. A.; Wall, J. Lu, H. M.; Ye, Z. Z. Dopant-Induced Shape Evolution
S.; Rondinone, A. J.; Kennel, S. J.; Mirzadeh, S.; of Colloidal Nanocrystals: The Case of Zinc Oxide. J.
Robertson, J. D. Gold Coated Lanthanide Phosphate Am. Chem. Soc. 2010, 132, 13381-13394.
Nanoparticles for Targeted Alpha Generator 54. Slowinski, E.; Elliott, N. Lattice constants and
Radiotherapy. PLoS One 2013, 8, e54531. magnetic susceptibilities of solid solutions of uranium
42. Kim, Y. S.; Brechbiel, M. W. An overview of targeted and thorium dioxide. Acta Cryst. 1952, 5, 768-770.
alpha therapy. Tumor Biol. 2012, 33, 573-590. 55. Sundaresan, A.; Rao, C. N. R. Implications and
43. Durakiewicz, T.; Joyce, J. J.; Wills, J. M.; Batista, C. consequences of ferromagnetism universally
D. Notes on the dual nature of 5f electrons. J. Phys. exhibited by inorganic nanoparticles. Solid State
Soc. Jpn. 2006, 75, 39-40. Commun. 2009, 149, 1197-1200.
44. Lander, G. H. Physics - Sensing electrons on the edge. 56. Coey, J. M. D. Dilute magnetic oxides. Curr. Opin.
Science 2003, 301, 1057-1058. Solid State Mater. Sci. 2006, 10, 83-92.
45. Kwon, S. G.; Hyeon, T. Formation mechanisms of 57. Yamamoto, Y.; Miura, T.; Suzuki, M.; Kawamura, N.;
uniform nanocrystals via hot-injection and heat-up Miyagawa, H.; Nakamura, T.; Kobayashi, K.;
methods. Small 2011, 7, 2685-2702. Teranishi, T.; Hori, H. Direct observation of
46. Donega, C. D.; Liljeroth, P.; Vanmaekelbergh, D. ferromagnetic spin polarization in gold nanoparticles.
Physicochemical evaluation of the hot-injection Phys. Rev. Lett. 2004, 93,
method, a synthesis route for monodisperse 116801-116801-116801-116804.
nanocrystals. Small 2005, 1, 1152-1162. 58. Das Pemmaraju, C.; Sanvito, S. Ferromagnetism
47. Sundaresan, A.; Rao, C. N. R. Ferromagnetism as a driven by intrinsic point defects in HfO2. Phys. Rev.
universal feature of inorganic nanoparticles. Nano Lett. 2005, 94, 217205.
1415
16
You can also read