Effects of Debris Torrents on Summer Water Temperatures: Salmonberry River (Nehalem Basin), Oregon - Ian Fergusson July 12, 2011
←
→
Page content transcription
If your browser does not render page correctly, please read the page content below
Effects of Debris Torrents on Summer Water Temperatures:
       Salmonberry River (Nehalem Basin), Oregon
                      Ian Fergusson
                       July 12, 2011

                                       Alluvial Deposit in Wolf Creek, July 2008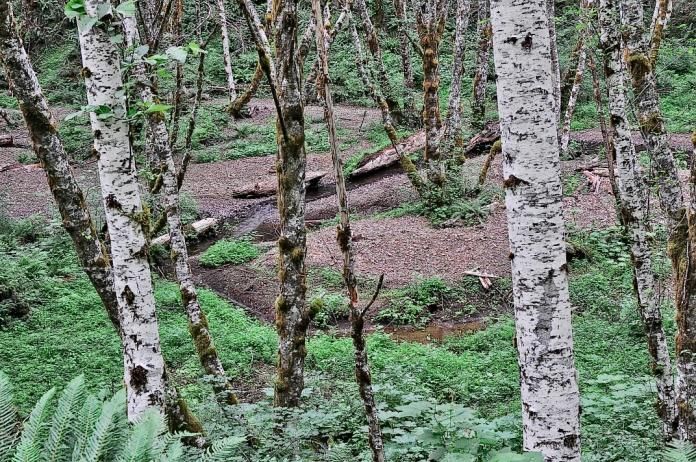
Contents
Executive Summary............................................................................................................................2
Acknowledgments .............................................................................................................................2
1. Introduction ...................................................................................................................................3
   1.1 The Salmonberry River ........................................................................................................................ 3
   1.2 Significant Weather Events/Landscape Changes ................................................................................ 3
   1.3 Temperature Changes......................................................................................................................... 3
   1.4 Factors Influencing Stream Temperatures.......................................................................................... 4
   1.5 Potential Effects of Debris Torrents on Temperatures ....................................................................... 4
2. Methods and Materials ..................................................................................................................5
   2.1 Data Loggers........................................................................................................................................ 5
   2.2 Accuracy Checks .................................................................................................................................. 5
   2.3 Sampling Frequency ............................................................................................................................ 5
   2.4 Field Deployment ................................................................................................................................ 6
   2.5 Measures of Watershed Characteristics ............................................................................................. 6
   2.6 Resource Agency Data ........................................................................................................................ 6
   2.7 Data Limitations ................................................................................................................................. 6
3. Site Selection and Descriptions .......................................................................................................7
   3. 1 Tributary Selection ............................................................................................................................. 7
   3.2 Tributary Descriptions......................................................................................................................... 7
4. Data Analysis Methods ...................................................................................................................9
5. Results/Discussion ....................................................................................................................... 10
   5.1 ANOVA Results .................................................................................................................................. 10
   5.2 Temperature Differences – Average Daily Maximum....................................................................... 11
   5.3 Temperature Differences – Average Daily Mean.............................................................................. 12
   5.4 Temperature Differences – Average Daily Minimum ....................................................................... 13
   5.5 Temperatures Relative to Biological Criteria .................................................................................... 15
6. Literature Cited ............................................................................................................................ 16
Appendix 1. Watershed Maps .......................................................................................................... 18
Appendix 2. Photographs. ................................................................................................................ 19

Effects of Debris Torrents                                                                                                                        Page 1
Executive Summary
The Salmonberry River has been identified as the only river on Oregon’s North Coast with a healthy native stock of
winter steelhead. The South Fork of the Salmonberry has been designated a Salmon Anchor Habitat by the Oregon
Department of Forestry. Besides steelhead, the river supports Chinook salmon, coho salmon, resident and sea-run
cutthroat trout, and a small local population of resident rainbow trout.
Severe rainstorms and associated landslides in February 1996 and December 2007 caused significant habitat
changes in tributaries and the main stem Salmonberry. The most obvious damage was caused by debris torrents;
some tributaries were completely stripped of riparian vegetation for several kilometers.
An Oregon Department of Fish and Wildlife STEP (Salmon Trout Enhancement Program) project team has
monitored summer water temperatures in the Salmonberry watershed since 1994. The data showed increased
maximum temperatures following the 1996 flood. The data provide an opportunity to compare predisturbance and
postdisturbance temperatures in “control” and “treatment” tributaries, to help determine whether the observed
temperature increases were the result of the changes brought about by debris torrents, or were simply normal
temperature variations.
Water temperatures are governed by many factors that interact in complex ways. The primary determinant
appears to be direct solar radiation, and the amount of solar radiation striking a stream is related to the shading
provided by topography and vegetation. A stream can be expected to present a different temperature profile after
the removal of significant amounts of riparian vegetation.
Four tributaries were studied in this analysis: Pennoyer Creek (the control); Kinney Creek and Wolf Creek
(“treatment” tributaries that experienced debris torrents); and the South Fork (a “treatment” tributary
experiencing no visible disturbance in 1996 and only a moderate degree of channel impacts in 2007).
Analysis of variance testing (ANOVA) showed that the difference between control and two treatment streams in
average daily maximum and mean temperatures increased significantly (p
1. Introduction

1.1 The Salmonberry River
Oregon’s Salmonberry River, a tributary of the lower Nehalem River, is known for its wild winter steelhead
(Oncorhynchus mykiss). The Salmonberry has a reputation for high-quality catch and release angling for large
steelhead, and attracts a substantial following of anglers. Huntington et al. (1996) identified the Salmonberry as
the only river on Oregon’s North Coast with a healthy native stock of winter steelhead.
The river supports two spawning runs of Chinook salmon (O. tshawytscha): one early-fall run and one fall run
(Kavanagh et al., 2006). Anadromous and resident forms of coastal cutthroat trout (O. clarki) are present, and a
resident population of rainbow trout (O. mykiss) exists in the North Fork of the Salmonberry (Kostow, 1995). Coho
salmon (O. kisutch) spawn in the Salmonberry November-January. Pacific Lamprey (Lampetra tridentata) redds
were observed in the Salmonberry in 2005 (Kavanagh et al., 2006).
Every year since 1993 a team of volunteers has conducted winter steelhead spawning ground surveys in the
Salmonberry, under an Oregon Department of Fish and Wildlife (ODFW) STEP (Salmon Trout Enhancement
Program) project. The STEP project also includes summer temperature monitoring. Following a 1993 trial
placement of a few data loggers, data loggers were placed at 10 sites (four mainstem and six tributary sites) in the
Salmonberry watershed in 1994, 1995, 1996, 1997, 2004, 2007, 2008, and 2009.

1.2 Significant Weather Events/Landscape Changes
During the course of the temperature monitoring program, there have been two significant floods with debris
torrents affecting some of the monitored tributaries. A number of terms are used to refer to movement of debris,
among them debris torrents, debris flows, channelized debris flows, debris avalanches, debris flow torrents, debris
flood torrents, and bedload torrents; distinctions among “flow”, ”torrent”, and “flood” are based on plasticity and
particle size (Slaymaker, 1988). For convenience, in this paper I take the liberty of employing the term “debris
torrent” to refer to a channelized debris flow with a long runout length, as it is the removal of riparian vegetation
over long distances that is of most importance for these purposes. I use “debris flow” in referring to literature
citations that also use the term, as well as to distinguish short-length channelized flows.
Over a four-day period in February 1996, record rainfall from a warm subtropical system fell on a deep snowpack
and caused widespread flooding throughout northern Oregon. This event was comparable to the December 1964
flood, the largest flood in Oregon since flood control reservoirs were built in the 1940’s and 50’s (Taylor, 1996).
Debris torrents originating on steep headwalls scoured four Salmonberry tributaries all the way to their mouths:
Tunnel Creek, Bathtub Creek, Kinney Creek, and Wolf Creek. The latter two have had temperatures monitored
since 1994.
In December 2007, another major rain storm flooded the North Coast. The Wilson River, the watershed just south
of the Salmonberry, reached a record peak stage of 20.5 feet on December 3, higher than the 18.4 feet recorded in
February, 1996 (Read et al. 2007). Three of the four Salmonberry tributaries that experienced debris torrents in
1996 did so again (Bathtub Creek, Kinney Creek, and Wolf Creek), and others that escaped damage in 1996
experienced debris torrents or other significant high water effects in 2007 (the North and South Forks, plus several
small named and unnamed tributaries).

1.3 Temperature Changes
The STEP project monitors the 7-day moving average of daily maximum temperature. The Oregon Department of
Environmental Quality has set an upper limit of 16 :C (61:F) for this metric for streams such as the Salmonberry,
identified as having core cold water habitat use for salmonids (Oregon Administrative Rules 340-041-0028).

The monitoring showed an increase in the number of days in excess of the core cold water standard after each of
the major storm events (Table 1). This was observed in tributaries as well as the mainstem, and was more evident
in the tributaries that were more obviously affected by debris torrents (Kinney Creek and Wolf Creek). This

Effects of Debris Torrents                                                                                   Page 3
observation led to the obvious question: Are the increased temperatures an outcome of the debris torrents, or are
they the result of normal climate variation?

                   Table 1. Days Above Core Juvenile Rearing Standard (16 °C)
                   Wide vertical bars show timing of the Feb 1996 and Dec 2007 floods
                    Location                    1994 1995       1996 1997 2004 2007               2008 2009
      Mainstem Above Pennoyer Cr. (RM 13.9)       0       0       0     0   M      0                0    0
      Mainstem Below Wolf Cr. (RM 11.7)           0       0       6     6   M      0                0   15
      Mainstem Below North Fork (RM 8.2)          0       0       7     0   M      0                2   20
      Mainstem Below Belfort Cr. (RM 3.0)        26      23      51    47   M      M               33   61
      Belfort Cr.                                 0       0      M      0   M      0                0    0
      Kinney Cr.                                  0       0       0    11   M      0                0    5
      North Fork                                  0       0       3     0   0      M                0   18
      Pennoyer Cr.                                0       0       0     0   0      0                0    0
      South Fork                                  0       0       0    M    M      0                0    0
      Wolf Cr.                                    0       0      12    15   0      M                0   13

Note that 2004 shows a large number of missing values. This was due to a variety of reasons: battery failure,
missing loggers, and dewatered sites. Water levels were so low in 2004 that even where complete datasets exist
there is some question as to how representative the recorded temperatures might be. Due to this uncertainty,
2004 was excluded from the analysis.

1.4 Factors Influencing Stream Temperatures
Many interacting factors can cause variations in stream temperature. Solar radiation, substrate type, canopy cover
and topographic shading, hyporheic flow, re-radiation, evaporation and convection at the air-water interface,
stream surface area, stream length, stream order, pool characteristics, discharge, gradient, channel roughness, air
temperature, relative humidity, and wind speed are among the variables considered important (Brown, 1972;
Beschta and Taylor, 1988; Zwieniecki and Newton, 1999; Bartholow, 2000; Johnson and Jones, 2000; Johnson,
2004; Tate et al, 2005).
Beschta and Taylor (1998) summarized previous studies evaluating the effects of vegetation removal on stream
temperatures; the primary cause of increased temperature is the additional solar radiation striking the water
surface. Johnson and Jones (2000) found significant increases in weekly maximum and minimum stream
temperatures following debris flows. Johnson (2004) shaded a reach of a small stream that had been scoured to
bedrock by debris flows, and observed decreased maximum temperatures as a direct result of the shading.
In the Salmonberry tributaries affected by debris torrents, riparian vegetation was removed over many km of
stream length. Presumably, the same level of topographic shading (steep canyons) and tall tree shading (from
upslope conifers) is present, but the shading provided by vegetation in the immediate riparian zone is absent. Any
innate “thermal signature” would be considerably altered in those cases, and there would be no opportunity to
return to normal through the mechanism of plant transpiration, as proposed by Zwieniecki and Newton (1999).

1.5 Potential Effects of Debris Torrents on Temperatures
To the eye, the most obvious effects of a debris torrent are the removal of riparian vegetation and deposition of
rubble over a significant length of a watercourse. The loss of shading and resulting increase in incoming solar
radiation can be expected to increase maximum temperatures. Beyond that, the dynamics are less obvious.
A loss of vegetative cover might be expected to result in lower minimum temperatures, as nighttime radiant heat
loss could increase (similar to the effect that clear nighttime skies have on terrestrial temperatures). However,
Johnson (2004) found that minimum water temperatures were not influenced by shade in a shading experiment,
and referred to conflicting studies, some showing increases in minimum temperatures under vegetative cover, and
some showing decreases.

Effects of Debris Torrents                                                                                  Page 4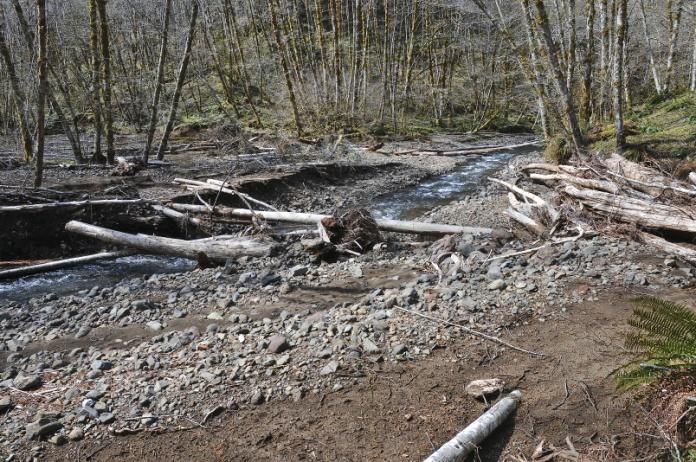
Debris torrents often scour portions of a channel to bedrock. Brown (1972) found that a bedrock stream bottom
conducts about 20% of incident solar radiation away from the stream. This would help ameliorate the expected
increases in maximum temperatures. It is also possible that the heat absorbed by bedrock during the daytime
would be released as the stream cools at night, making minimum temperatures higher.
Alluvial deposits are characteristic of debris torrents, marking where a loss of momentum occurred. During low
summer flows, streams can flow underneath alluvial deposits. Brown (1972) found that heat transfer by
conduction in porous gravels is very small compared to incoming radiation. Thus, an underground stream might
heat less than it would have had it remained above ground. This would help hold maximum temperatures down.
Johnson and Jones (2000) speculated that conduction from alluvial substrates might explain increases in minimum
temperatures after forest harvest. The interaction of these two processes, then, might be expected to result in
compression of the daily temperature range.
In the Salmonberry debris torrents, scouring and entrainment of bed material over long distances led to an
apparent decrease in channel complexity. The net effect of this on temperature is nearly impossible to predict. A
straighter channel would tend to create faster flows, which could result in lower daily fluctuations and lower
maximum temperatures (Bohle, 1994). A less complex channel would have a reduction in the shading normally
provided by woody structure, large boulders, and undercut banks; less shading would tend to increase maximum
temperatures. Overall pool numbers would be reduced. One might think that fewer pools would result in lower
temperatures, as pools would normally provide a greater surface area exposed to solar radiation. However, Brown
(1972) found that the outflow temperature of a pool is primarily a function of the way water flows through a pool,
so the effect of pool reduction could vary considerably with a reach.

                                           2. Methods and Materials

2.1 Data Loggers
Due to turnover at the ODFW Tillamook office, which oversees the STEP project, some details are unknown.
From 1994 through 2007, ODFW provided Onset Hobo® data loggers, exact models unknown. The downloaded
data show that the Hobo® loggers have a resolution of 0.1: C. Accuracy is unknown, but is probably ±0.5: C.
Starting in 2008, the loggers used are NexSens® model 1921G data loggers, with resolution of 0.5: C and accuracy
of ±1: C.
In 2008 the project team was given control of the data loggers, including the ability to launch them and retrieve
data. (Previously, this was handled in the ODFW Tillamook office.) In addition, the project was awarded a Salmon
and Trout Advisory Committee (STAC) mini-grant, and we purchased 10 additional NexSens® model 1921G loggers
to expand monitoring capacity starting in 2009.

2.2 Accuracy Checks
Accuracy-checking procedures prior to 2008 are unknown, as the procedures would have been conducted by
ODFW staff. Beginning in 2008, we used an ice-bath procedure (Dunham et. al., 2005).

2.3 Sampling Frequency
In 1994 through 1997, the data loggers recorded the temperature every 2.4 hours. In 2004 and 2007, the sampling
frequency was every 3.2 hours. In 2008 and 2009 it was every 2.0 hours.
Dunham et al (2005) presented a chart that can be used to determine the probability of underestimating the
maximum daily temperature, for a given sampling frequency and daily range in temperature. For the Salmonberry
sites under consideration in this study, the mean daily temperature range over all years was 1.5: C (2.7: F) during
the hot period (July 1 – August 31). The greatest daily range observed for any one site was 4.4: C (7.9: F). Based
on the Dunham chart, the probability of underestimating the daily maximum temperature in the streams under
consideration is about 1% for a 2-hour sampling interval, and 2% for a 3-hour interval. Over the course of a
summer, then, the daily maximum might be expected to be understated on one or two days.

Effects of Debris Torrents                                                                                  Page 5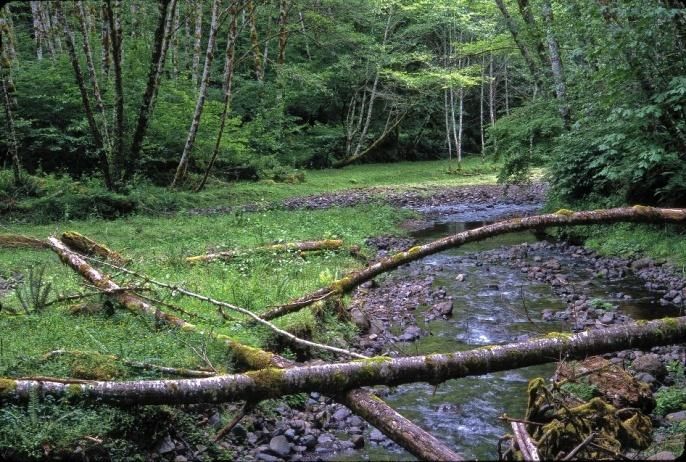
2.4 Field Deployment
Data loggers were deployed as early as April 24 and as late as June 6. Retrieval dates ranged from September 5 to
24. Dates analyzed in this report are July 1-August 31, the period when the warmest temperatures occur.
The loggers (in white waterproof housings) were placed in well-mixed areas in the thalweg. They were weighted
with rocks large enough to remain in place during higher flows. In some instances they were cabled to nearby root
wads or down trees, in addition to being weighted to stay in place.

2.5 Measures of Watershed Characteristics
I estimated elevations, stream gradients, and basin areas (Table 2) using National Geographic Topo! ® v. 4.3.3,
which is based on USGS 7.5 minute quadrangles. I determined stream order from blue line tributaries (perennial
and intermittent), using the same source. Approximate areas of land ownership (private vs. public) were derived
using the Topo! ® application and the Oregon Department of Forestry Tillamook State Forest Map (2002).

2.6 Resource Agency Data
I was not able to locate any documentation specific to the monitored sites that could be used to quantify changes
in stream characteristics that occurred over the period 1994-2008.
ODFW conducted habitat surveys in the Salmonberry in 1993, 1996, 2007, and 2008 (Kavanagh, 2008). The 1993
and 2008 surveys extended from the mouth to the headwaters, approximately 30 km (18 miles). The 1996 and
2007 surveys each covered two reaches, one on the main stem Salmonberry and the other on the North Fork.
None of the surveys included the tributaries covered in this report.
I also reviewed data posted on the websites of the ODFW Aquatic Inventories Project
(http://oregonstate.edu/dept/ODFW/freshwater/inventory/index.htm) and the Oregon Plan for Salmon and
Watersheds (http://www.oregon-plan.org/). I located an instance of an Oregon Plan habitat survey of a 543-meter
reach of Pennoyer Creek, performed in 2004. I was unable to locate any habitat surveys of Wolf Creek, Kinney
Creek, or the South Fork.

2.7 Data Limitations
This study is a case study, rather than a true experiment. Sites were selected for long-term monitoring, with no
experimental design intended. Nevertheless, the storm events separated out a “control” tributary and several
“treatment” tributaries. See 3.1, Tributary Selection.
I have no quantitative data regarding stream morphology and canopy cover before and after the disturbances, only
a subjective appraisal (supported by photographs; see Appendix 2).
Another complicating factor is that the Salmonberry watershed has been undergoing changes other than sudden
debris torrents. It is within the area of the “Tillamook Burn”, a series of wildfires occurring in 1933, 1939, 1945, and
1951, with the 1933 and 1945 burns affecting the Salmonberry watershed (Lucia, 1983). Harvesting of replanted
trees began in the early to mid 1990’s, with road construction, thinning, and clear-cut harvesting increasing
annually.
As discussed previously, changes in data stewardship, data logger resolution, and recording interval over the years
also add uncertainty to the data. Table 2 summarizes.

             Table 2. Variables relating to data loggers used
                                      1994 1995 1996 1997 2007 2008 2009
             Data Logger Brand                     Onset HOBO            NexSens
             Resolution/Accuracy                    0.1:C/0.5:C          0.5:C/1:C
             Sampling Frequency                  10X/day        8X/day    12X/day
             Logger/Data Custody                ODFW Tillamook         Project Team

Effects of Debris Torrents                                                                                      Page 6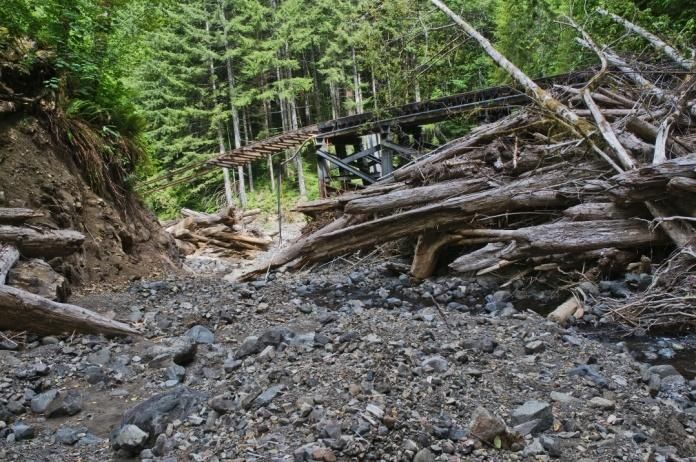
3. Site Selection and Descriptions

3. 1 Tributary Selection
The tributaries analyzed in this report are Pennoyer Creek, Kinney Creek, Wolf Creek, and the South Fork. The
monitors were placed in the tributaries, near their mouths (all less than 100 m from the main stem Salmonberry).
The sites are located within a radius of 4.4 kilometers (2.7 miles). See maps in Appendix 1.
Tributaries that are monitored but were excluded from the study are Belfort Creek and the North Fork. Belfort
                  nd
Creek is a small 2 order stream with a basin area of 3 km², joining the lower Salmonberry at an elevation of
                                                                                        th
100m. Its watershed is mostly privately owned and is heavily logged. The North Fork is 4 order with a basin area
of 60km², much larger than any other tributary.
Table 3 summarizes some characteristics of the watersheds. Runout length is distance from source slide to creek
mouth; in actuality the effects of these torrents continued on down the mainstem Salmonberry. The runout length
of the 1996 Kinney Creek debris torrent was estimated from site visits and aerial photos (see Appendix 2). The
runout length of the 1996 Wolf Creek debris torrent was verified by a spring 1996 site visit that located the source.
Limited site visits suggest the 2007 debris torrents were similar in extent.

             Table 3. Characteristics of Control and Treatment Tributaries
                                                                       1st
                                       Elev.        Area             Order              Runout Length,
                      Site              (m) Order (km²) Gradient Tribs.                      1996
          Kinney Creek                 1000 3rd       6     8.3%        5               3.5 km (2.2 mi )
          Pennoyer Creek (control) 1360 2nd           6     6.3%        4                     n/a
          Wolf Creek                   1100 3rd      17     8.3%       12                5 km (3.1 mi)
          South Fork                     580 3rd     17     8.0%        9                     n/a

Pennoyer Creek remained relatively undisturbed through the study period, and was used as the “control” for that
reason.
Kinney Creek and Wolf Creek were both affected by debris torrents in January 1996 and again in December 2007,
with considerable loss of riparian vegetation.
The South Fork was relatively undisturbed in 1996, and disturbed in 2007. The 2007 changes involved smaller
landslides entering the riparian zone, and moderate channel changes rather than the large-scale channel
disturbance and removal of riparian vegetation that occurred in Kinney and Wolf Creeks.
See the photographs in Appendix 2 for help in evaluating the subjective terminology relating to degree of
disturbance.

3.2 Tributary Descriptions
Pennoyer Creek is the uppermost of the named tributaries of the Salmonberry. By a rough estimate, 20% of the
watershed area is private industrial forest, and 80% Tillamook State Forest.
There is a pond 2.6 kilometers (1.6 miles) above the creek’s mouth. At one time Cochran Pond was a mill pond for
a logging settlement. The pond’s surface area is probably not much more than 1 hectare (2.5 acres). The effect of
the pond on downstream temperatures is unknown. Maxted et al. (2005) found significant increases in
downstream temperatures resulting from in-line ponds; however, the spillways in that study discharged water
from the pond surfaces, while the Cochran Pond’s discharge is at the base of the earthen dam, and if temperature
stratification occurs, that would result in cooler downstream temperatures. Regardless of whether the pond raises
or lowers downstream temperatures, it may also serve as a heat sink which could dampen downstream
temperature fluctuations, and it probably helps reduce the impacts of high water events.

Effects of Debris Torrents                                                                                   Page 7
There is a waterfall about 100 meters above Pennoyer Creek’s confluence with the Salmonberry, with a
perpendicular drop of approximately six meters. The monitoring site is downstream of the waterfall.
The 1996 and 2007 flood events appeared to cause little damage to the lower part of Pennoyer Creek. There was
one large slide in the headwaters in December 2007, but it entered at right angles and did not continue down the
creek channel. There was debris accumulation on the railroad tracks just above Cochran pond in 2007, but
minimal flood damage below the pond. See photos in Appendix 2.
Wolf Creek is the largest tributary above the North Fork. At the confluence with the Salmonberry, Wolf Creek and
the Salmonberry are approximately equal in flow. About 40% of the Wolf Creek watershed area is private industrial
forest, all in the headwaters.
In February 1996 a debris torrent scoured Wolf Creek for much of its length. The torrent originated on a steep
slope above a minor source channel and appeared to have continued unimpeded to the main stem Salmonberry, a
distance of 5 kilometers (3 miles). Short slides along the way contributed additional material. Large amounts of
rock and woody debris were deposited in the main stem Salmonberry below Wolf Creek.
In December 2007 Wolf Creek was scoured again by debris torrents. I was not able to cover the entire watershed,
but what I saw indicates that multiple sources contributed to mass movement of debris through the system. There
may have been multiple dam-break floods. Photographs of the after-effects of the 1996 and 2007 events are
presented in Appendix 2.
The Kinney Creek watershed was the most densely forested of the four examined here when we began
temperature measurements in 1994.
In the 1996 flood, Kinney Creek lost much riparian vegetation, and the channel was greatly modified. There was
enough movement of large wood to damage the railroad bridge at the mouth of Kinney Creek. Aerial photos in
Appendix 2 show the extent of vegetation removal – essentially the entire length of the stream.
In the 2007 flood, the railroad bridge was destroyed. Significant channel changes occurred, and riparian vegetation
recovering from the earlier event was removed.
The 1996 debris torrent appears to have originated at a single source high in the watershed; I have not been able
to establish whether the 2007 event involved a single catastrophic failure, or whether the damage resulted from
debris movement associated with multiple smaller failures.
The South Fork is approximately the same size as Wolf Creek. It joins the main stem Salmonberry about 2.5 km
(1.5 miles) below the North Fork confluence. The South Fork was designated as Salmon Anchor Habitat by the
Oregon Department of Forestry, the result of a cooperative effort also involving Oregon Trout, Ecotrust, the Wild
Salmon Center, and the Oregon Department of Fish and Wildlife (Miewald et al., 2008). Miewald et al. (2008)
provide the following synthesis of data/expert opinion regarding the South Fork:”Unique area for wild steelhead
(expert opinion), high intrinsic potential for steelhead, good watershed condition, high steelhead and cutthroat
(ODFW).” In addition, STEP surveys have documented adult coho spawning in the South Fork.
About 30% of the watershed is in private industrial forest; the rest is Tillamook State Forest. As with the other
tributaries, the private land is on the steep headwater slopes.
Damage from the 1996 flood was negligible in the South Fork. There was some evidence of debris movement in
Ripple Creek, the main tributary of the South Fork.
There was much movement of material in the South Fork in December 2007; this apparently resulted primarily
from multiple, relatively short, failures of side slopes in the lowest mile of the stream. At one location there
appeared to have been damage due to the sudden release of water impounded behind a temporary debris dam.
The major channel modifications seen in Kinney Creek and Wolf Creek did not occur in the South Fork. Although
mass movement of large wood was evident from depositions near the river mouth, the railroad bridge spanning
the mouth was not damaged, due to a sharp bend just above the bridge. I located the paths of three small debris
flows in the South Fork headwaters that scoured source channels to bedrock and deposited debris in the upper
South Fork. The source channels connect at right angles to the South Fork; consequently, the slides lost
momentum upon reaching the stream. These debris flows left large wood complexes in the upper reaches of the

Effects of Debris Torrents                                                                                    Page 8
South Fork. In contrast, the long-runout debris torrents in Wolf and Kinney Creeks transported large volumes of
                                     rd     th
wood, but deposited much of it in 3 - and 4 -order reaches of the mainstem.

                                            4. Data Analysis Methods
The temperature metrics examined were daily maximum, daily minimum, and daily mean. The mean is the “true”
daily mean, calculated as the mean of all the daily observations, rather than the average of the minimum and
maximum.
The analysis methodology was developed with the assistance of Robert Thomas, retired USFS statistician. Mr.
Thomas performed the formal statistical analysis, using the software package R (The R Foundation for Statistical
Computing, Vienna, Austria).
The analysis is based on the assumption that in the absence of significant disturbances, the “treatment” tributaries
will maintain a consistent relationship with the “control” tributary. This assumption is tested (see below for more
detail). Since all subject streams are located in a small geographic area, they are presumably affected by the same
general climatic factors. If the environmental conditions are such that one stream is warmer or cooler in a given
year than in some other year, then all of the tributaries should respond in the same manner and the relationships
would be maintained. Following a major disturbance in a “treatment” tributary but not the “control”, the
relationship could change significantly.

Initial examination of the data revealed serial correlation. Serial correlation is a common property of time-series
datasets, where measurements are made sequentially and where a value is not entirely independent of the value
of its neighbors. For example, the temperature at any given time is to some extent dependent on the temperature
an hour prior, or two hours, or one day, etc., with the effect diminishing over time. This presents problems for
analyzing temperature data using traditional parametric statistical methods, which are based on the assumption of
independent data: each observation should be independent of any others. Without corrective techniques, serial
correlation tends to result in underestimation of standard errors, confidence intervals that are too optimistic, and
artificially low p-values, resulting in a higher likelihood of finding a statistically significant effect where none exists
(Zwiers and Storch, 1995).
New datasets for the “treatment” tributaries were generated by subtracting each day’s Pennoyer Creek values
(maximum, mean, minimum) from the corresponding values for the treatment tributaries. This subtraction gives a
direct measure of how the treatment watersheds differ from the control. Changes in the differences should
measure changes due solely to the treatments themselves, as the differencing would “subtract out” the effects of
a changing environment. In fact, over the period analyzed, temperatures in the control stream, Pennoyer Creek,
increased slightly for unknown reasons. By using the difference between treatment and control for each year, this
overall change in temperature is cancelled out, making it more likely that the debris torrents are isolated as a
possible factor.

The initial difference series still did not display the necessary degree of independence. They were further
transformed by subdividing the datasets into blocks of 5, 6, 7, 8, 10, 12 and 15 days and testing the means of those
blocks for independence. The 15-day blocks showed the greatest independence. The final maximum, mean, and
minimum datasets for each year were means of 4 consecutive 15-day blocks, from July 1 to August 29. The
statistical package “R” was used to perform ANOVA (analysis of variance) testing.

For each of the three “treatment” tributaries (Kinney Creek, Wolf Creek, and South Fork), the difference series
derived from maximum, mean, and minimum temperatures were examined. Three periods were used for analysis:
the period before the first debris torrents (1994 and 1995); the period following the first debris torrents but before
the second (1996, 1997, and 2007); and the period after the second debris torrents (2008 and 2009). Each of those
periods was also tested for internal consistency, to verify the assumption that differences between treatment and
control would be consistent. Table 4 shows the periods used, and which years apply to which stream pairings (data

Effects of Debris Torrents                                                                                         Page 9
existed for Pennoyer Creek for all years, but were missing for the treatment tributaries in some years). Each
tributary has two years of data within each period.
Table 4. Periods used in analysis.
Wolf Kinney South
Creek Creek Fork
1994 X X X
Period 1
1995 X X X
First debris flows, February 1996
1996 X X
Period 2 1997 X X
2007 X X
Second debris flows, December 2007
2008 X X X
Period 3
2009 X X X
Each temperature metric (the difference between control and treatment in maximum, mean, and minimum
temperature) for each of the three tributaries was considered an “experiment”. Within each experiment, five
contrasts were performed in the ANOVA. Three contrasts involved the two years within each period, to test
internal consistency in each period. One contrast was Period 2 vs. Period 3, to test consistency between the two
periods following debris torrents; and the final contrast was Period 1 vs. all others, to test whether the debris
torrents had effects that could be distinguished from the baseline. The significance level chosen was 95% (p=.05); a
Bonferroni correction factor of 5 in each “experiment” was used to adjust for repeated testing, so that the p-value
evaluated in the ANOVA results was p=.01, corresponding to the desired significance level of 95%.
5. Results/Discussion
5.1 ANOVA Results
Table 5 shows the results of the “R” ANOVA procedure. For these purposes, a difference between years (or
periods) with a p-valuePeriod 1, before the first debris torrents, shows internal consistency: 1994 and 1995 did not differ significantly in
any of the measures. Period 2, covering a 12-year span between the two major events, also shows internal
consistency in eight of the nine measures, with only the minimum for Wolf Creek testing significantly different
between 1996 and 1997. Period 3, following the latest debris torrents, is also internally consistent, except for the
Kinney Creek minimum.
When Period 2 is compared to Period 3, only the minima (again, for Wolf Creek and Kinney Creek) are significantly
different. Maximum and mean temperatures are consistent; i.e. no difference exists between the periods that
followed the first and second debris torrents.
When Period 1 is compared with Periods 2 and 3, all measures for Wolf and Kinney Creeks show significant
differences. The South Fork, as discussed previously, did not undergo debris torrents, and does not show a
significant change after the storm events.
Each of the metrics is illustrated in the following subsections.
5.2 Temperature Differences – Average Daily Maximum
Figures 1- 3 show the extent of changes in Jul-Aug average daily maximum temperature, expressed as the
difference between the “treatment” streams (Kinney Cr., Wolf Cr., and South Fork) and the “control” stream
(Pennoyer Cr.). A positive value means the subject stream is warmer than Pennoyer Creek.
Fig. 1 Wolf Creek Maximum
2.5
Difference from Pennoyer
2
1.5
1
0.5
Cr., ⁰C
0
-0.5
-1
1994 1995 1996 1997 2008 2009
Period 1 Period 2 Period 3
Fig. 2 Kinney Creek Maximum
2.5
Difference from Pennoyer
2
1.5
1
0.5
Cr., ⁰C
0
-0.5
-1
1994 1995 1997 2007 2008 2009
Period 1 Period 2 Period 3
Relative to the control, there was a significant increase in maximum temperature in Wolf and Kinney Creeks
following the first debris torrents. In Kinney Creek, this increase appears to persist over the long span (1997-2007)
Effects of Debris Torrents Page 11before the second debris torrents. It is not possible to say whether the same is true for Wolf Creek, as we have no
data from the end of Period 2. A long period of recovery, however, might be expected: Johnson and Jones (2000),
studying clear-cut timber units, determined an average of 15 years to return to preharvest stream temperatures in
small first-order streams, coinciding with canopy closure in the riparian zone. This period was found to be
consistent with the recovery model postulated by Beschta and Taylor (1988), based on the recovery of angular
canopy density following clearcutting and slash-burning.
The average increase in daily maximum temperature resulting from the debris torrents (Period 2/3 average -
Period 1 average) is 1.5:C (2.7:F) in Wolf Creek, and 2.2:C (4.0:F) in Kinney Creek. Before the first debris torrent,
Kinney Creek was cooler than Pennoyer Creek.
Fig. 3 South Fork Maximum
2.5
Difference from Pennoyer
2
1.5
1
0.5
Cr., ⁰C
0
-0.5
-1
1994 1995 1996 2007 2008 2009
Period 1 Period 2 Period 3
In contrast, the South Fork shows no effect from the 1996 flood (as expected, since the South Fork did not appear
to be disturbed in that event), and only a minor rise following the second event, which is not significant (p=.031).
5.3 Temperature Differences – Average Daily Mean
Figures 4-6 show changes in daily mean temperature relative to Pennoyer Creek. Since the daily mean temperature
by necessity is lower than the maximum, the magnitude of the effect is different, but the pattern for Wolf and
Kinney Creeks is the same as for the maximum temperature: a significant change (pFig. 5 Kinney Creek Mean
2.5
Difference from Pennoyer
2
1.5
1
0.5
Cr., ⁰C
0
-0.5
1994 1995 1997 2007 2008 2009
Period 1 Period 2 Period 3
The average increase in daily mean temperature resulting from the debris torrents (Period 2/3 average - Period 1
average) is 0.8:C (1.4:F) in Wolf Creek, and 1.5:C (2.7:F) in Kinney Creek. Before the first debris torrent, the Kinney
Creek daily mean was lower than Pennoyer Creek.
Fig. 6 South Fork Mean
2.5
Difference from Pennoyer
2
1.5
1
0.5
Cr., ⁰C
0
-0.5
-1
1994 1995 1996 2007 2008 2009
Period 1 Period 2 Period 3
As with the daily maximum, the storm events had no significant effect on daily mean temperatures in the South
Fork.
5.4 Temperature Differences – Average Daily Minimum
Figures 7-9 show changes in daily minimum temperature relative to Pennoyer Creek. There is a wide range of
possible effects on minimum temperature that might result from debris torrents (see discussion in Section 1.5),
and these data seem to bear that out.
Effects of Debris Torrents Page 13Fig. 7 Wolf Creek Minimum
2.5
Difference from Pennoyer
2
1.5
1
0.5
Cr., ⁰C
0
-0.5
-1
1994 1995 1996 1997 2008 2009
Period 1 Period 2 Period 3
The ANOVA showed a significant difference in minimum temperature for Wolf Creek within Period 2, meaning the
data are not consistent enough to consider Period 2 as a discrete period. Although a comparison between Period 1
and Period 2 was not made in this analysis (to keep testing to a minimum), from this chart it is clear that there is
not much difference between Period 1 and Period 2. Period 3 is significantly different from Period 2 (pFig. 9 South Fork Minimum
2.5
Difference from Pennoyer
2
1.5
1
0.5
Cr., ⁰C
0
-0.5
-1
1994 1995 1996 2007 2008 2009
Period 1 Period 2 Period 3
As with the maximum and mean temperatures, the South Fork shows no significant difference in average daily
minimum temperature due to the flood events.
5.5 Temperatures Relative to Biological Criteria
To this point the emphasis has been on changes in temperature relative to the control stream. The actual
temperatures are also important because of their possible effects on biota. Table 6 shows the average July-August
temperatures for each of the streams analyzed.
Table 6. Average Daily Temperatures, July-August
Maximum, :C Mean, :C Minimum, :C
PC WC KC SF PC WC KC SF PC WC KC SF
Period 1 1994 12.5 12.9 11.7 12.1 11.7 12 11.5 11.3 10.9 11.1 11.2 10.5
1995 12.5 12.7 12 12.2 11.7 12.1 11.6 11.4 11.1 11.4 11.3 10.8
Period 2 1996 13 15.1 x 12.7 12.2 13.3 x 11.7 11.4 12.2 x 11
1997 13.3 15.2 15.1 x 12.8 13.6 14 x 12.3 12.6 13.1 x
2007 12.6 x 14.1 12.4 11.9 x 13.2 11.6 11.4 x 12.5 11
Period 3 2008 12.6 14.2 14.1 13.1 11.8 13.1 12.9 11.7 11.1 12.5 12.4 11
2009 13.3 15.1 14.5 13.4 12.5 13.6 14.1 12 11.7 13 13.9 11.2
PC=Pennoyer Cr.; WC=Wolf Creek; KC=Kinney Cr.; SF=South Fork; x=missing data
The Oregon Department of Environmental Quality has set an upper limit of 16 :C (61:F), measured as a seven-day
moving average of the daily high, for streams identified as having core cold water habitat use (OAR 340-041-0028).
Although the tributaries studied here only occasionally exceed that threshold (see Table 1), the mainstem exceeds
the threshold for long periods in the summer, and this is undoubtedly contributed to by warming of the tributaries.
Another way to look at the possible effects of tributary warming is to relate tributary temperatures to optimal
temperatures for juvenile salmonids. Yearling rainbow trout select temperatures about 13:C (Sauter et al., 2001).
For Chinook salmon, optimum growth occurs within 10-15.6: C (McCullough et al., 2001). Pauley et al. (1989)
reported that the optimal temperature for juvenile cutthroat trout is 15:C; Sauter et al. (2001) report preferred
field temperatures of 10-14:C for juvenile and adult cutthroat. Dent and Walsh (1997) evaluated stream
temperatures against a standard of 55:F (13:C) as the preferred temperature for juvenile cutthroat and coho
salmon.
13:C seems a reasonable estimate of optimum temperature for the range of salmonid species rearing in the
tributaries. With that as a criterion, Table 7 shows the frequency of days on which the 7-day moving average high
temperature exceeds 13:C.
Effects of Debris Torrents Page 15Table 7. Frequency of Jul-Aug days > 13:C
(7-day moving average of daily maximum)
Pennoyer Wolf Kinney S. Fork
Year Days Pct Days Pct Days Pct Days Pct
1994 15 24% 29 47% 0 0% 0 0%
1995 17 27% 24 39% 0 0% 4 6%
1996 27 44% 58 94% 16 26%
1997 43 69% 57 92% 58 94%
2007 9 15% 57 92% 4 6%
2008 13 21% 62 100% 62 100% 34 55%
2009 28 45% 61 98% 62 100% 37 60%
There was considerable variability in this metric even before the storm events. The two most heavily affected
tributaries, Wolf Creek and Kinney Creek, have clearly shifted, with 92-100% of days in July and August exceeding
13:C since the first event. The shift is most noticeable in Kinney Creek, which did not exceed 13:C at all in 1994 and
1995.
A significant change in thermal characteristics in a stream could be beneficial for some biota and harmful for
others; interrelationships are complex. Assessing the full range of potential impacts is far beyond the scope of this
paper. One effect that might result from higher temperatures is increased metabolic rates. For salmonids, if food is
plentiful, growth rates will increase; if food is limited, higher metabolic rates cause stress and decreased resistance
to disease, parasites, and predation (Sauter et al. 2001; McCullough et al., 2001).
Debris torrents clearly have effects beyond temperature. Food supplies for fish may be temporarily reduced:
disturbance of Pacific Northwest streams by floods and debris flows greatly reduces local macroinvertebrate
density and diversity (Hershey and Lamberti 1998). This effect might be short-term, as recovery of the
macroinvertebrate base can be rapid due to increased primary productivity from increased light levels, with
positive results on fish growth (Lamberti et al., 1991).
Food supplies notwithstanding, McCullough et al. (2001) stated that disease becomes a significant mortality factor
in temperatures above optimum levels, and that water temperatures in salmon-rearing reaches must be managed
in order to provide the greatest salmonid population production capacity, ensuring a full range of temperatures:
very cold headwaters, cold midreaches, and cold/cool lower reaches.
6. Literature Cited
Bartholow, J. 2000. Estimating cumulative effects of clearcutting on stream temperatures. Rivers 7(4), 284-297.
Beschta, R, and R.L. Taylor. 1988. Stream temperature increases and land use in a forested Oregon watershed.
Water Res. Bull. 24: 19-25.
Bohle, T. 1994. Stream temperatures, riparian vegetation, and channel morphology in the upper Grande Ronde
River watershed, Oregon. Master of Science thesis, Oregon State University. 116 p. Oregon State University
Scholars Archive, http://ir.library.oregonstate.edu/dspace/handle/1957/9386
Brown, G. 1972. An improved temperature prediction model for small streams. Research Report WRRI-16, Water
Resources Research Institute, Oregon State University, Corvallis, OR. 20 p.
Dent, L. and J. Walsh. 1997. Effectiveness of riparian management areas and hardwood conversions in maintaining
stream temperature. Forest Practices Technical Report Number 3, Oregon Department of Forestry. 58 p.
Dunham, J., G. Chandler, B. Rieman, and D. Martin. 2005. Measuring stream temperature with digital data
loggers: a user’s guide. Gen. Tech. Rep. RMRS-GTR-150WWW. Fort Collins, CO: U.S. Department of Agriculture,
Forest Service, Rocky Mountain Research Station. 15 p.
Effects of Debris Torrents Page 16Hershey, A. and G. Lamberti. 1998. Stream Macroinvertebrate Communities. In: Naiman, R. and Bilby, R., eds. River Ecology and Management/Lessons from the Pacific Coastal Ecoregion, Springer –Verlag, New York. p 169- 199. Huntington, C., W. Nehlsen, and J. Bowers. 1996. A survey of healthy native stocks of anadromous salmonids in the Pacific Northwest and California. Fisheries Vol. 21 No. 3, 6-14. Johnson, S. 2004. Factors influencing stream temperatures in small streams: substrate effects and a shading experiment. Can. J. Fish. Aquat. Sci. 61: 913-923. Johnson, S. and J. Jones. 2000. Stream temperature responses to forest harvest and debris flows in western Cascades, Oregon. Can. J. Fish. Aquat. Sci. 57: 30-39. Kavanagh, P., K. Jones, and C. Stein. 2006. Fish habitat assessment in the Oregon Department of Forestry lower Nehalem and Necanicum study area. Oregon Department of Fish and Wildlife Aquatic Inventories Project, Corvallis, OR. Kavanagh, P. 2008. ODFW Aquatic Inventory Project Stream Report: Salmonberry River. Oregon Department of Fish and Wildlife Aquatic Inventories Project, Corvallis, OR. Kostow, K. 1995. Biennial report on the status of wild fish in Oregon. Oregon Department of Fish and Wildlife. Lamberti, G.A., S.V. Gregory, L.R. Ashkenas, R.C. Wildman and K.M.S. Moore. 1991. Stream ecosystem recovery following a catastrophic debris flow. Canadian Journal of Fisheries and Aquatic Sciences 48: 196-208. Maxted, J.R., C.H. McCready, and M.R. Scarsbrook. 2005. Effects of small ponds on stream water quality and macroinvertebrate communities. New Zealand Journal of Marine and Freshwater Research 39:1069-1084. McCullough, D., S.Spalding, D.Sturdevant, and M.Hicks. 2001. EPA Issue Paper 5. Summary of technical literature examining the physiological effects of temperature on salmonids. US Environmental Protection Agency EPA-910-D- 01-005. 114 p. Miewald, T., B. van Dyck, and G.Reeves. 2008. Oregon North Coast Salmon Conservation Assessment. Wild Salmon Center website, http://www.wildsalmoncenter.org/pdf/WSC_OR_NCSalmonAssmnt08.pdf ODFW Aquatic Inventories Project, Corvallis, OR http://oregonstate.edu/dept/ODFW/freshwater/inventory/index.htm Oregon Plan for Salmon and Watersheds http://www.oregon-plan.org/ Pauley, G.B., K. Oshima, K.L. Bowers, and G. L. Thomas. 1989. Species profiles: life histories and environmental requirements of coastal fishes and invertebrates (Pacific Northwest)—sea-run cutthroat trout. U.S. Fish and Wild. Serv. Biol. Rep. 82(11.86). U.S. Army Corps of Engineers TR EL-82.4. 21 pp. Read, W., C.Hale, and G.Taylor. 2007. The Great Coastal Gale. Oregon Climate Service website, http://www.ocs.orst.edu/page_links/whats_new/wind_storm.html . Sauter, S., J.McMillan, and J.Dunham. 2001. EPA Issue Paper 1. Salmonid behavior and water temperature. US Environmental Protection Agency EPA-910-D-01-001. 36 p. Slaymaker, O. 1988. The distinctive attributes of debris torrents. Hydrol. Sci. J. 33(6):567-573. Tate, K., D.Lile, D.Lancaster, M.Porath, J.Morrison, and Y.Sado. 2005. Statistical analysis of monitoring data aids in prediction of stream temperature. California Agriculture, Vol. 59 No. 3, 161-167. Taylor, G. 1996. The Great Flood of 1996. Oregon Climate Service website, http://www.ocs.orst.edu/reports/flood96/Flood2.html . Zwieniecki, M. and M. Newton. 1999. Influence of streamside cover and stream features on temperature trends in forested streams of western Oregon. West. J. Appl. For. 14: 106-112 Zwiers, F. and H. von Storch. 1995. Taking Serial Correlation into Account in Tests of the Mean. J. Climate 18: 336- 351. Effects of Debris Torrents Page 17
Appendix 1. Watershed Maps

                                               Nehalem River

                                           Salmonberry R.

Fig.1 (above). Nehalem and Salmonberry River watersheds are delimited by bold black lines. Fig.2 (below). Detail
of Salmonberry River watershed, with arrows pointing to approximate data logger locations in the tributaries.

                          Nehalem R.

                                                     North Fork

                                                                          Pennoyer Cr.

                                           South Fork

                                                     Kinney Cr.         Wolf Cr.

Effects of Debris Torrents                                                                               Page 18
Appendix 2. Photographs.
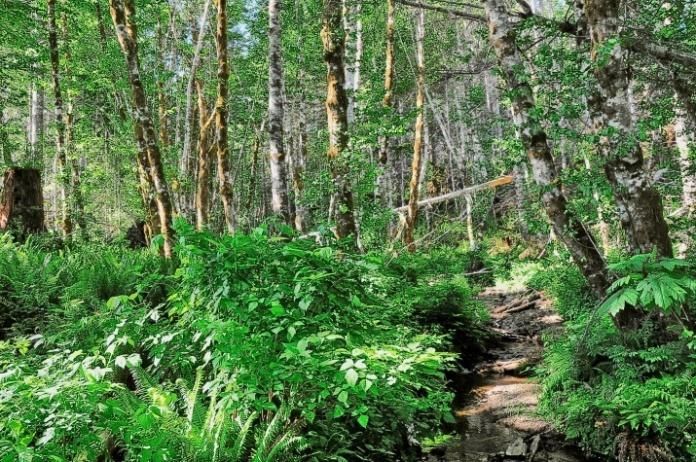
2.1 Pennoyer Creek
Fig 1 (left). Upper Pennoyer Creek, June 2008. A 1996 ODFW electroshock survey found cutthroat trout at this
location. There are clearcuts on either side of this point. This photo illustrates the function of both canopy and
understory vegetation in shading first-order channels. Fig 2 (right). Cochran Pond, May 2008. The gravel bar is
comprised of railroad fill and ballast deposited by Pennoyer Creek overflow in Dec. 2007. This illustrates the pond’s
function as a buffer during high water events.
Fig 3 (left). Pennoyer Creek below Cochran Pond, July 2008. High water resulted in removal of herbaceous
vegetation, but the meanders and canopy were preserved. Fig. 4 (right). Pennoyer Creek temperature monitoring
site, May 2008. The confluence with the mainstem Salmonberry is about 30 meters below this point.
Fig 5. Road washout in the upper Pennoyer Creek
watershed, May 2008. This slide reached the creek, but
was perpendicular to the channel and lacked the
necessary momentum to become a full long-running
debris torrent. This is above the site shown in Fig. 1.
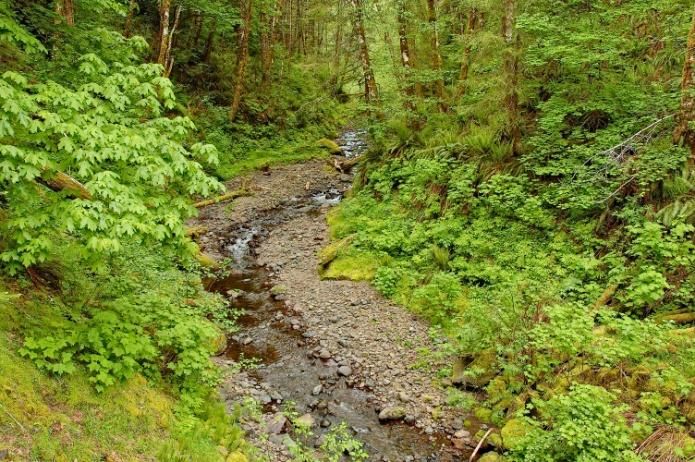
Effects of Debris Torrents Page 192.2 Kinney Creek Fig 6 (left). Lower Kinney Creek, Feb 1995. Fig 7 (right). Lower Kinney Creek, May 1997, 15 months after the Feb 1996 debris torrent. Fig 8 (left). Lower Kinney Creek from RR bridge, May 2007, 11 years after the 1996 debris torrent. Immediate streamside vegetation still had not fully recovered. Fig 9 (right). Logs at Kinney Cr RR bridge, July 2008. Fig 10 (Ieft). Kinney Creek, July 2008. Fig 11 (right) Kinney Creek watershed, May 2007, looking west from the Kinney-Wolf Creek divide. The central ridge divides the two main forks of Kinney Creek. The 1996 debris torrent came down the near valley. Effects of Debris Torrents Page 20
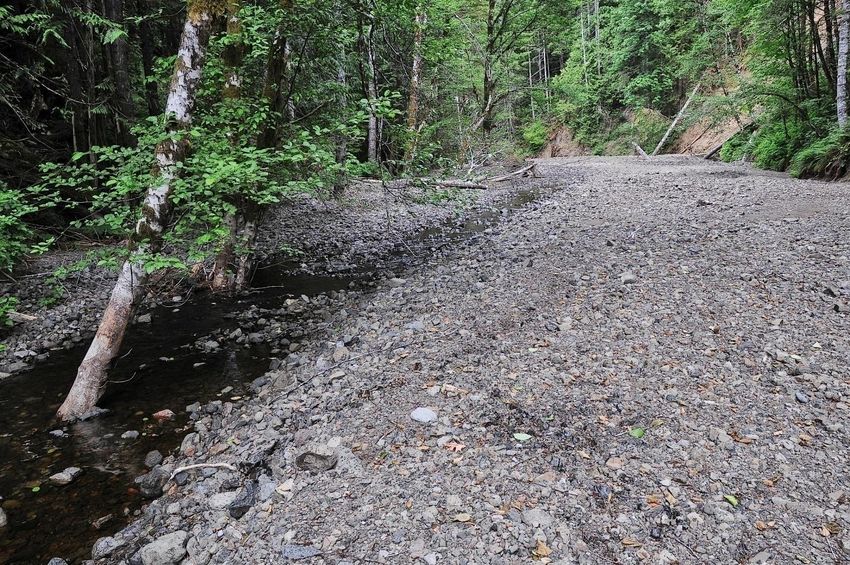
Fig. 12 (left) Kinney Creek watershed in 1995; Fig 13 (right) Kinney Creek watershed in 2000. The Salmonberry
River and the Port of Tillamook Bay Railroad run from right to left about ¼ of the way from the top of both photos.
The Kinney Creek basin is approximately delimited by the heavy black line in Fig. 12. The extent of riparian
vegetation removal is apparent in the right hand photo, with Kinney Creek showing as a broad white line for most
of its length. Aerial photos courtesy of Oregon Department of Forestry.

2.3 South Fork

Fig 14 (left). South Fork, March 2001. Fig 15 (right). South Fork, May 2007, at the same spot.

Effects of Debris Torrents                                                                                Page 21
Fig .16. South Fork, April 2008, same spot. There is
                                                            obvious high water damage, but no effect on shading at
                                                            this location (main stem, just above the mouth).

Fig 17 (left). South Fork, April 2007, showing a channel change that occurred in the winter of 2006/07. Previously
the river flowed entirely to the right. This relatively minor flood caused more channel changes in the South Fork
than the 1996 flood did. It appeared that a dam caused by a small slide in a narrow part of the canyon impounded
water for a time, then burst. Fig 18 (right). South Fork, April 2008 at the same spot, following the Dec. 2007 event.
This short reach is one of only a few spots where canopy shading was eliminated, compared to several miles of
removal in Kinney and Wolf Creeks.

Fig 19 (left) Ripple Creek in foreground, joining South Fork (channel at middle left), June 2003. Fig 20 (right). Same
spot, April 2008.

Effects of Debris Torrents                                                                                    Page 22
2.4 Wolf Creek
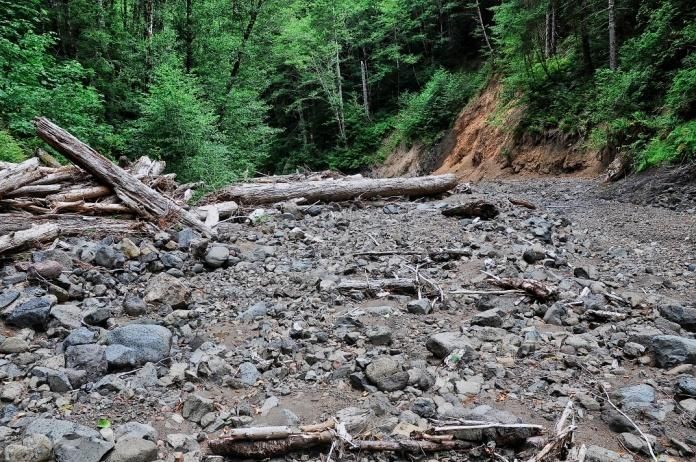
Fig 21 (left). Path of 1996 Wolf Creek debris torrent (1997 photo) down a headwall source channel. Fig 22 (right).
Wolf Creek in May 2003. In the seven years since the debris torrent, the creek had cut down through a deep gravel
deposit (shelf on right of photo). Note the young red alders on both sides of the stream.
Fig 23 (left). Wolf Creek, July 2008. This slide, one of many short slides down the canyon sides, originated on the
railroad grade. Fig 24 (right). Wolf Creek, July 2008. The creek subsides entirely into the gravel in the distance.
Fig 25 (left). Headwaters of Wolf Creek in July 2008, where one of the three main forks crosses Wolf Creek Road.
st
Two 1 order channels converge just above this crossing. A 1996 ODFW electroshock survey found cutthroat trout
in both of them. Fig 26 (right). Wolf Creek watershed, May 2007, showing some of the landscape changes, other
than debris torrents, occurring over the period of this study.
Effects of Debris Torrents Page 23You can also read