CFA Institute Research Challenge - Hosted by CFA Society Chile Dream Team - (CFA) Society

Page created by Laurie Bowen
 
CONTINUE READING
CFA Institute Research Challenge - Hosted by CFA Society Chile Dream Team - (CFA) Society
CFA Institute Research Challenge
     Hosted by CFA Society Chile
            Dream Team

                                   1
CFA Institute Research Challenge - Hosted by CFA Society Chile Dream Team - (CFA) Society
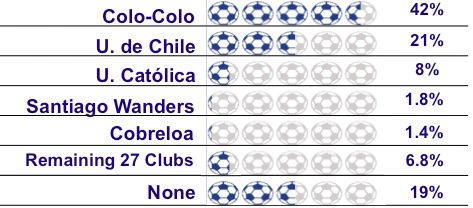
This report is published for educational purposes only by students
participating in the CFA Institute Research Challenge

                                                                       Dream Team - Research

                                                                                                                                                                                                                                                                                                                                                                                                                             Owns and operates a professional soccer team
                                        Cruzados S.A.D.P.                                                                                                                                                                                                                                                                                                                                                       Santiago Stock Exchange, Chilean Electronic Stock Exchange

  Date: 09-Nov-2017                                                                                                                                                                                                                                                                                                                                                                        Recommendation: HOLD                                              Santiago de Chile
  Ticker: CRUZADOS CI Equity                                                                                                                                                                                                                                                                                                                                                                Target Price: CLP $131                                    Current Price: CLP $128.5

                                                                                                                                                                                                                                                                                                                                                                              EXECUTIVE SUMMARY
Fig. 1: Cruzados Market Data
                                                                                                                                                                                                                                                                                                                                                                              Cruzados S.A.D.P is a Chilean Company engaged in the operation of Club Deportivo
 Market Data                                                                                                                                                                                                                              Unique Class                                                                                                                        Universidad Católica’s soccer division, a professional soccer club based in Chile. Cruzados is
                                                                                                                                                                                                                                                                                                                                                                              one of the main three national team, beside Colo Colo and Universidad de Chile.
 Closing Price (CLP$)                                                                                                                                                                                                                                                                                           128.00

 Average daily Volume (MCLP$)                                                                                                                                                                                                                                                                                                     1.79
                                                                                                                                                                                                                                                                                                                                                                              INVESTMENT RECOMMENDATION
 Shares (Thousands)                                                                                                                                                                                                                                                                              64,221.60                                                                    We issue a HOLD recommendation with a 12-month target price of CLP $131 with a proposed
 Free Float (Thousands)                                                                                                                                                                                                                                                                          41,909.77                                                                    upside of 1.94% from its closing price of CLP $128.5 on November 9, 2017.
 Market Cap (MCLP$)                                                                                                                                                                                                                                                                                  8,220.40
                                                                                                                                                                                                                                                                                                                                                                              To obtain this target price we applied a discount cash flow model and a multiple valuation
 P/E                                                                                                                                                                                                                                                                                                                     43.58                                                model. Given the long-term growth prospect we weight the DCF with 90% in our valuation
 Enterprice Value (MCLP$)                                                                                                                                                                                                                                                                            6,181.25                                                                 approach. Our multiple valuation is based on EV/EBITDA.
 EBITDA 12 * (MCLP$)                                                                                                                                                                                                                                                                                 2,042.14
                                                                                                                                                                                                                                                                                                                                                                              Investment thesis
 EV / EBITDA                                                                                                                                                                                                                                                                                                                      3.03

 Industry Median EV / EBITDA                                                                                                                                                                                                                                                                                                      9.54                                        There is a medium growth potential for Cruzados, rooted in three elements, the increasing
                                                                                                                                                                                                                                                        Source: Bloomberg                                                                                                     demand for soccer content, the modification of the sponsorship contracts and the motivation
                                                                                                                                                                                                                                                                                                                                                                              of the fans responding to the companies’ efforts of enhancing the experience inside and
                                                                                                                                                                                                                                                                                                                                                                              outside the stadium.
                                                                                                                                                                                                                                                                                                                                                                              In relation to the increasing demand for soccer content, this revenue gets to Cruzados
                                                                                                                                                                                                                                                                                                                                                                              though the A.N.F.P, that is the organization that distribute to the professional soccer teams
                                                                                                                                                                                                                                                                                                                                                                              the revenues generated by the CDF, that is 80% owned by the soccer teams. The growth is in
                                                                                                                                                                                                                                                                                                                                                                              the form of the rising demand of the HD subscription of the channel.
                                                                                                                                                                                                                                                                                                                                                                              The motivation of the fans and the change in the sponsorships contracts responds to the
                                                                                                                                                                                                                                                                                                                                                                              strategy of the club to try to decrease the dependence of the revenues, and the sporting
Fig. 2: Cruzados Financial Data
                                                                                                                                                                                                                                                                                                                                                                              achievements, that is an actual phenomenon in the soccer industry.
Cruzados                                                                                                                      2012                                                 2013                                           2014                                                2015                                            2016
                                                                                                                                                                                                                                                                                                                                                                              There is also a revenue generator, that is the transfers of players, this generator of revenues,
Gross Margin                                                                                                            26,87% 37,55% 32,95% 22,60% 30,55%                                                                                                                                                                                                                    is also the biggest generator of costs in this industry, and that happens for Cruzados too.
EBITDA Margin                                                                                                           4,45% 21,30% 15,64% 9,96% 17,84%                                                                                                                                                                                                                      This is an uncertain variable because it depends on the prices of the external players, and the
Market Cap (MCLP$)                                                                                                      10000 10000 9000      9435   9437
Div idend y ield                                                                                                         -      -      -       -      -
                                                                                                                                                                                                                                                                                                                                                                              internal ones.

ROE                   -6,29%                                                                                                                                                  1,79%                                             0,55%                                            -3,19%                                             1,28%
Pric e/Book Value      0,97                                                                                                                                                    0,95                                              0,82                                             0,80                                               0,74

                                                                                                                                                                                                                                                                                                                                                                              INVESTMENT HIGHLIGHT
ROE to New Inv estor* -6,51%                                                                                                                                                  1,90%                                             0,68%                                            -3,99%                                             1,73%

ROA                                                                                                                         -6,29%                                            1,79%                                             0,55%                                            -3,19%                                             1,28%
                                                                                                                                                                                                                                                                                                                                                                              Concession
                                                                                                                                                                                                                               Source: Team research                                                                                                                          Cruzados S.A.D.P is a Chilean Company dedicated to the economic and financial management
                                                                                                                                                                                                                                                                                                                                                                              of the Club Deportivo Universidad Católica’s soccer area through a renewable 40 years term
                                                                                                                                                                                                                                                                                                                                                                              concession. This contract expires in 32 years (2049), but it has a 20 more year’s extension if
                                                                                                                                                                                                                                                                                                                                                                              both parties agrees on it (Club Deportivo Universidad Católica and Cruzados). This is the first
                                                                                                                                                                                                                                                                                                                                                                              time in the club history, that the team get pass by a concession, so it is unknown if the 20
                                                                                                                                                                                                                                                                                                                                                                              years renewable is a probable event or it isn’t.

                                                                                                                                                                                                                                                                                                                                                                              Capital increase process
                                                                                                                                                                                                                                                                                                                                                                              In 2015 Cruzados start a capital increase process in which they issued 35,087,720 additional
                                                                                                                                                                                                                                                                                                                                                                              shares. Currently there are still 18.660.504 shares remaining to be subscribed, and payed.
Fig. 3: Cruzados’ Stock Price (CLP)
        350
                                                                                                                                                                                                                                                                                                                                                                              CDF
                                                                                                                                                                                                                                                                                                                                                                              The Chilean's professional soccer teams own though the ANFP 80% of the CDF, a Professional
        300
                                                                                                                                                                                                                                                                                                                                                                              soccer Channel, who is in charge of the national television rights of the Chilean’s soccer
        250                                                                                                                                                                                                                                                                                                                                                                   industry. Because of this, each team receive a fix percentage of the 80% of the CDF revenues.
                                                                                                                                                                                                                                                                                                                                                                              The owner of the remaining 20% is Jorge Claro, who’s offering to sell his ownership. The
 CLP$

                                                                                                                                                                                                                                                                                                                                    25,8%
                                                                                                                                                                                                                                                                                                                                    Upside
        200

                                                                                                                                                                                                                                                                                                                                                              161             current potential buyers are FOX, ESPN and Turner. If this transaction is completed, each
        150
                                                                                                                                                                                                                                                                                                                                                                              team of the first division will receive a one-time amount of $2.000 Million CLP.
                                                                                                                                                                                                                                                                                                                                                                   128
        100

                                                                                                                                                                                                                                                                                                                                                                              Corporate governance
              03-12-09
                         03-03-10
                                    03-06-10
                                               03-09-10
                                                          03-12-10
                                                                     03-03-11
                                                                                03-06-11
                                                                                           03-09-11
                                                                                                      03-12-11
                                                                                                                 03-03-12
                                                                                                                            03-06-12
                                                                                                                                       03-09-12
                                                                                                                                                  03-12-12
                                                                                                                                                             03-03-13
                                                                                                                                                                        03-06-13
                                                                                                                                                                                   03-09-13
                                                                                                                                                                                              03-12-13
                                                                                                                                                                                                         03-03-14
                                                                                                                                                                                                                    03-06-14
                                                                                                                                                                                                                               03-09-14
                                                                                                                                                                                                                                          03-12-14
                                                                                                                                                                                                                                                     03-03-15
                                                                                                                                                                                                                                                                03-06-15
                                                                                                                                                                                                                                                                           03-09-15
                                                                                                                                                                                                                                                                                      03-12-15
                                                                                                                                                                                                                                                                                                 03-03-16
                                                                                                                                                                                                                                                                                                            03-06-16
                                                                                                                                                                                                                                                                                                                       03-09-16
                                                                                                                                                                                                                                                                                                                                  03-12-16
                                                                                                                                                                                                                                                                                                                                             03-03-17
                                                                                                                                                                                                                                                                                                                                                        03-06-17
                                                                                                                                                                                                                                                                                                                                                                   03-09-17

                                                                                                      Cruzados Equity                                                              Current Price                                                     Target Price
                                                                                                                                                                                                                                                                                                                                                                              Unlike the other two large Chilean's team, Cruzados hasn’t had any control takeover and it’s
                                                                                                                                                                                                                                                                                                                                                                              difficult that it will happed in the future, because there would always be two shares (series B)
                                                                                                                                                                        Source: Bloomberg & Team Research
                                                                                                                                                                                                                                                                                                                                                                              with veto rights over the final decisions, that are in the hands of Club Deportivo Universidad
                                                                                                                                                                                                                                                                                                                                                                              Católica, and the Pontificia Universidad Católica de Chile.

                                                                                                                                                                                                                                                                                                                                                                                                                                                                                 2
CFA Institute Research Challenge - Hosted by CFA Society Chile Dream Team - (CFA) Society
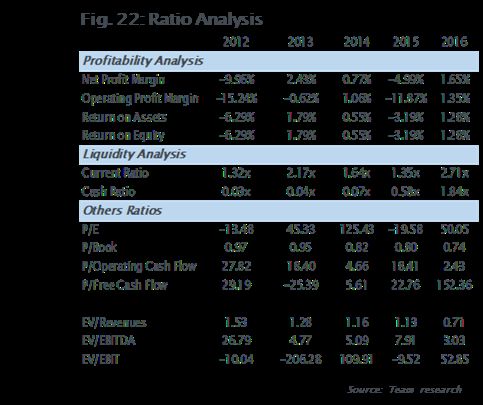
BUSINESS DESCRIPTION
    Fig. 4: Revenues Evolution Breakout
                                                                              Cruzados S.A.D.P. is a Chilean Company engaged in the operation of Club Deportivo
                                        11%                                   Universidad Católica’s soccer division. Universidad Católica is one of the most successful
  20%          14%          15%                      13%         13%
                                                                              companies in Chilean professional soccer and one of the few clubs listed on a stock
               28%          25%         25%          27%         26%          exchange. In addition to the professional team of the univeristy, which is playing in the first
  20%                                                                         division A, the company is also responsible for the management of the amateur team and
                                                                              cadets.
                            30%         35%          21%         28%
  42%          30%
                                                                              Club Deportivo Universidad Católica grant Cruzados through a 40-years-term concession
                                                                              renewable for 20 additional years. The concession includes the rent of the stadium, and its
               25%          26%         28%          34%         32%          facilities, the use of the different brands associated with the team and the sale of the players,
  18%
                                                                              among others.
  2011        2012          2013        2014        2015         2016
                                                                              Fundación Club Deportivo Universidad Católica was founded in 1937 as a non-profit
  Commercial           Transfers        Broadcasting         Matchday organization, and in accordance to a regulation in the Chilean law that took place in 2009
                                                    Source: Company Report    Fundación Club Deportivo Universidad Católica originates Cruzados S.A.D.P as a result to
                                                                              separate from the organization and constituted itself as a sports corporation. S.A.D.P. stands
                    Fig. 5: Revenues Evolution                                for Sociedad Anónima Deportiva Profesional. This last one is responsible of the professional
                                                                              team, the management for the cadets and the female team, thru the concession given by
 3,900                                                                        Club Deportivo Universidad Católica.
 3,400
                                                                              The company generates revenues from the operation of the stadium in San Carlos de
 2,900                                                                        Apoquindo, use the trade mark “UC” in merchandising as well as the television rights and
 2,400                                                                        revenues from advertising and players transfers.
 1,900
                                                                              Main Revenues
 1,400
   900                                                                        Soccer clubs generate revenues in four broad ways: aommercial activities, broadcasting,
                                                                              matchday and transfers of players. In Fy 2016, 71% correspond to sales, commercials and
              2011       2012       2013      2014      2015       2016
                                                                              tickets revenues and 28% to transfers (figure 4). About this last stream is relevant to mention
                                                                              that between 2011 and 2014 was the main source of revenues and is the most volatile
                    Broadcasting                           Matchday           revenue as shown in figure 5.
                    Transfers                              Commercial
                                                    Since 2013 Cruzados has been increasing its revenues at a CAGR of 8% after a decrease of
                                                    22% between 2011 and 2012 given the 3,982 million of transfers’ revenues in 2011, which is
                                                    Source: Company Report

                                                    the highest amount until the date, against 2,220 million in 2012. Consequently, the expenses
                                                    have been increasing in a similar rate maintaining a margin of 21% in average (Figure 5 and
Fig. 6: Revenues versus Expenses Evolution (M CLP$) 6).

 12,000                                                                       Advertising and Sponsorship as driver of Commercial Activities

 10,000                                                                       This stream includes mainly revenues from advertising and sponsorships agreements, which
                                                                              correspond a 77% of the Commercial revenues in 2016, it’s also compound by soccer
  8,000                                                                       membership fees, soccer school enrollment, UC store sales and merchandising rights, which
                                                                              complete the remaining 23% (Figure 5).
  6,000
                                                                              Broadcasting
  4,000                                                                       It contemplates the television right of the national and international tournaments. Primarily
               2011 2012 2013 2014 2015 2016                                  the most important is the revenues from domestic rights, which in Chile is the distribution
                Total Revenues                Total Sales Expenses            generated by the soccer channel (CDF for its Spanish acronym), as for 2016, represents 94%
                                                                              of the total broadcasting segments the revenues.
                                                Source: Company Report
                                                               This national right is assigned by the National Association of Professional soccer (ANFP) who
                                                               distribute 80% of the cash flows generated by CDF. The ANFP define the percentages for the
        Fig. 7: ANFP’s Broadcasting Limits                     32 teams that conform the professional soccer which is restricted for the three main (Colo
                                                               Colo, Universidad de Chile and Universidad Católica). This restriction implies a stablished
                  2016 2017 2018 2019 2020 2021 2022 2023 2024 limit for those teams that will decrease annually until 2023 and then it will remain fixed at
 Limit three main  25% 23% 21% 20% 19% 18% 17% 16.5% 16.5% 16,5%. Regarding Cruzados, the amount received is shown in figure 7.
 teams
 Cruzados as % of     6.69% 6.34% 5.79% 5.51% 5.23% 4.96% 4.68% 4.55% 4.55%   Matchday
 total
                                                 Source: Company Report
                                                                              This segment revenues are generated by seasonal tickets and general admission tickets. The
                                                                              Matchday streams do not follow a defined trend (figure 8), this can be explained because the
                                                                              main drivers are both team’s performance and Cruzados’ fans and followers.
     Fig. 8: Matchday Revenues Evolution (M CLP$)
                                                                              The Stadium has a capacity of 14.118 viewers, but because of Chilean security standards the
  2,000                                                                       average capacity that can be sold is 13.000. To ensure an occupation rate, the management
                                                                              pursue to stimulate the sale of seasonal tickets. In a short-term horizon the goal is to reach
  1,750                                                                       6,000 seasonal tickets (Appendix B).
  1,500
  1,250                                                                       Transfer of Player
  1,000
                                                                              This segment is driven by all the movements of players to different soccer clubs, which is a
    750                                                                       stream hard to predict. As figure 2 confirms, there is no defined trend and the transfers, this
    500                                                                       revenue goes from 3,981 million in 2011 to a decrease of 44% to the following year and then
    250                                                                       increase two more year near of 20% and decrease 36% to the fourth year. This can be
      0                                                                       explained by the fact that the quantity of players able to sell and the price, depends not only
                                                                              in the sport success and players abilities, but also on market factors, as the supply and
              2011 2012 2013 2014 2015 2016                                   demand at a certain time. Additionally, every team should define the number of players for
                                                   Source: Company Report
                                                                              each position to complete is roster. Each position has a different range of prices and if the
                                                                              team change the soccer manager, he can change the existent roster to adapt it to a different
                                                                              strategy. Then, purchases affect directly sells or loans of players and vice versa to achieve a
                                                                              complete competitive roster.
                                                                                                                                                                             3
CFA Institute Research Challenge - Hosted by CFA Society Chile Dream Team - (CFA) Society
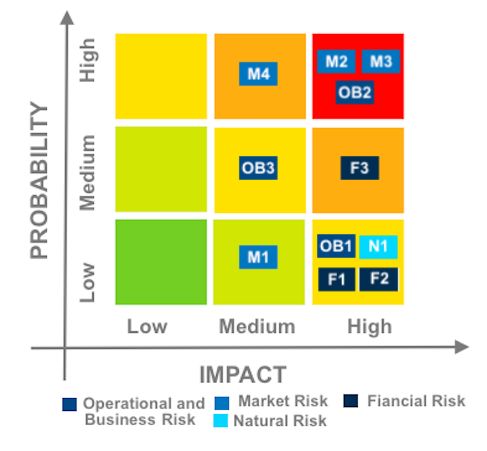
Fig. 9: Expenses Evolution Breakout                                   Expenses
  15%      16%         14%       10%      11%          9%
                                                       9%             The main expense of Cruzados are the players and coaching staff expenses reaching 65% in
  16%      10%         18%       21%      16%                         FY 2016 and representing a 54% of the total expenses in average between 2011 and 2016
                                                      16%             (Figure 9). The remaining percentage is represented by three expenses: Operating, Transfers
  16%      19%                   19%      18%                         and Tournament.
                       18%
                                                                      Fans and Followers - Team Performance the main drivers
                                                        65%
   53%         54%      49%       50%      54%                        The principal drivers of the business are the number of fans and followers of the Club, and
                                                                      the team performance. Cruzados’ goal is to gain prestige and sporting success (on-pitch). If
                                                                      the Club is successful on-pitch, will be capable of capture more fans and followers, that
                                                                      generate the attraction of best media and sponsor agreements. This produce revenues, which
  2011     2012        2013      2014     2015        2016
                                                                      can be invested in improving the squad to increase chances of further sport success (figure
Employee           Operating      Transfer       Tournaments          10). This means that on-field achievements of the club generate significant broadcasting
                                             Source: Company Report   revenues, commercial and matchday streams.
   Fig. 10: Cruzados’ Synergy Cycle                                   The financial success can be achieved partly by an intensified fan involvement, which
                                                                      subsequently influence the utilization of the stadium, ticket price and the merchandising
                                                                      revenues. That’s why Cruzados has been developing its customer relationship programs and
                                                                      it’s looking for further opportunities to deepening fan engagement, through its different
                                                                      activities such as the fair they organized, the program “Cruzados por dentro”, and lunches
                                                                      with the players, to name some of them.

                                                                      Fans and Followers - Team Performance the main drivers

                                                                      The principal drivers of the business are the number of fans and followers of the Club, and
                                                                      the team performance. Cruzados’ goal is to gain prestige and sporting success (on-pitch). If
                                                                      the Club is successful on-pitch, will be capable of capture more fans and followers, that
                                                                      generate the attraction of best media and sponsor agreements. This produce revenues, which
                                                                      can be invested in improving the squad to increase chances of further sport success (figure
                                                                      10). This means that on-field achievements of the club generate significant broadcasting
                                          Source: Team research
                                                                      revenues, commercial and matchday streams.
  Fig. 11: Organization Chart of Cruzados
                                                                      The financial success can be achieved partly by an intensified fan involvement, which
                                                                      subsequently influence the utilization of the stadium, ticket price and the merchandising
                                                                      revenues. That’s why Cruzados has been developing its customer relationship programs and
                         Directory                                    it’s looking for further opportunities to deepening fan engagement, through its different
                                                                      activities such as the fair they organized, the program “Cruzados por dentro”, and lunches
                                                   Sports             with the players, to name some of them.
  General               Commissions
Management                                       Management
                                                                      MANAGEMENT AND GOVERNANCE
      Administration                      Formative                   Regarding the governance of the company is relevant to highlight that as Cruzados is a
       and Finance                         Soccer                     concession from Club Deportivo Universidad Católica is must maintain aligned to the values
       Management                        Management                   of the university. As a result, the university remains as a fundamental government on the
                                                                      company represented in the possession of the only two Serie B shares. This shares have
                                                                      specific right in which the important one is having veto right over the final decisions.
     Commercial                          Technical staff
                                                                      There is no natural or juridical person who possess over 10% of the property and that could
     Management                           Management
                                                                      take control of the firm. Club Deportivo Universidad Católica (CDUC) owns 15% of the series A
                                                                      shares, however it is a non-profit organization, so it can not take control of the firm. The
                                            Source: Company Report    only other entity is Inversiones Santa Filomena ltda. who manages 13%, but is constituted by
  Fig. 12 : Revenue’s Market Share                                    three partners with 34%, 34% and 32% respectively, so neither of them reach the 10% or more
                                                                      of Cruzados capital on their own.

                                                                      Cruzados’ management is a matricidal organization, on one branch is the sports
                                                                      management (Formative soccer and professional soccer) and on the other is the general
                                                                      management (Administration & Finances and Commercial) (figure 11) both below the
                                                                      directory. This directory

                                                                      Its concerned that given the tend to gain on-pitch in this industry the only entity above these
                                                                      two branches is the directory. Thus, the sport management is going to have constants
                                                                      confrontations with the general management and given the industry it is possible that most
                                              Source: Team research
                                                                      of the time the sports area is going to have a higher relevance over the final decision.

                                                                      On the other hand, is it relevant to consider the fact that in this industry sporting success
 Fig. 13: Porter’s five forces analysis                               cannot be always bought. That means, a higher investment in a squad do not always ensure
                                                                      better sporting success

                          Intensity of
                                                                      INDUSTRY OVERVIEW AND COMPETITIVE POSITIONING
                         Competitive
                              Rivality
                                                                      Soccer is the most popular sport worldwide and in Chile. This industry generated around US$
                                                                      111 millions in Chile as for 2016, in which the main parties are Blanco y Negro, Azul Azul and
                                                                      Cruzados, in terms of revenues. In aggregate, this three teams concentrate a 59% of the
                                                  Bargaining
     Barriers to                                                      industry (Figure 12) in which Cruzados have a 17%.
                                                   Power of
       Entry
                                                   Suppliers          This industry have percentage of market share defined, due to the fanaticism of the
                                                                      followers, so getting each player to increase their market share is difficult. The teams in this
                                                                      industry do not compete for the price, instead the pursue differentiation. This strategy allows
                                                                      addition of income for the commercial part that represents on average 30% of the revenues.
                                           Bargaining
           Threat of                                                  For a new entrant it is easy to enter, but to afford keeping incomes is difficult due the fact of
                                             Power of
          Substitutes                                                 the lower fans and followers that do not sustain the business. This las concept is what makes
                                             Buyers
                                                                      a barrier that obstruct new soccer teams to compete in the relevant market. (figure 13).
                                                                      (Complete Porter’s analysis at Appendix J)
                                                                                                                                                                      4
                                         Source: Team Analysis
CFA Institute Research Challenge - Hosted by CFA Society Chile Dream Team - (CFA) Society
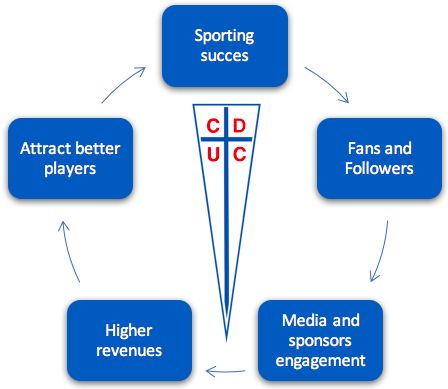
Fig. 14: Chileans’ Fans and Followers Evolution in                                        Fans and followers as driver of the business.
                millions of persons                                                       The soccer teams cannot survey without fans and followers, they are the engine of this
                                                                                          Industry. They generate all the tickets related revenues and the merchandising revenues
      8,100                                                                               directly. Additionally, are the main driver of the broadcasting and sponsorships revenues.

                                                                                          ANFP distribute CDF revenues.
      7,600
                                                                                          The television rights are administrated by the CDF, this entity provides 80% of its revenues to
      7,100                                                                               the ANFP who is in charge of distribute the amount in the 32 teams. The main fundament for
                                                                                          the definition of each’s club percentage depends on the number of followers that each club
                                                                                          has.
      6,600
                      2013          2014           2015           2016       2017         Demographics characteristic are relevant
                                                   Source: Gfk Adimark of soccer 2015     The geographic location, age and socioeconomic situation makes differences in the revenues.
                                                                                          For example, if the fan lives in another city its unlikely to them to assist in the Matchday to
                                                                                          the stadium every time, but he can support his team by television broadcasting. The
 Fig. 15: Salaries Evolution in the Chilean Market                                        disposition of economics resources of the fan affects directly the amount that he can spend
 in CLP Millions                                                                          in merchandising or the number of matches that he attends and for example the sector he
      40,000                                                                              buys can depend on the age, as older people is no always willing to be at gallery.
                                    CAGR 52%
                                                                                          Sports succeeds provide fans and monetary prizes
      30,000
                                                          Winning competitions and been recognize as the best team (or one of the best) can capture
      20,000                                              more fans, more merchandising sells and better sponsorship contracts. Other privilege of
                                                          winning tournaments is the monetary prize for the winners and the possibility to participate
      10,000                                              in other tournaments with a higher exposure. Only by broadcasting terms the revenues for
                                                          just one round played in Sudamericana international tournaments is USD $ 250,000. But must
                 0                                        considerer that one-time success does not provide all these benefits, must be constantly
                       2009 2010 2011 2012 2013 2014 2015 good to gain more adepts and classify to international tournaments.
                                      Source: Unidad de Control Financiero ANFP 2015
                                                                                          Intensive capital expenditure industry

Fig. 16: Fans and Followers per team as total of                                          The clubs must count with a complete roster to it soccer season and they can try to generate
the people interested in soccer in Chile                                                  the best team as they can. For this reason, try to have the best player is not cheap. Every
                                                                                          team must pay millionaire amount for transfers of players and then pay theirs expenses each
                                                                                          month.

                                                                                          The salaries expenses have been increasing at a CAGR of 52% since 2009 (figure 15) and this
                                                                                          trend can continue upwards. The main problem is that a higher inversion does not assure
                                                                                          sports success.

                                                                                          COMPETITIVE POSITIONING

                                                    Cruzados has the smaller number of fans and followers between the three main clubs, and it
                                                    has not increase strongly over the last years, even though it is the Club with less leakage of
                                                   Source: Gfk Adimark of Soccer 2017
                                                    followers. Colo Colo has grown the number, but it has also a high leakage of them and U. de
 Fig. 17: Fans and Followers per team as total of   Chile has leaked more fans than that they could attract. (Figure 17). The fan profile of
 the people interested in soccer in Chile Evolution Cruzados has a better purchased power than Blanco y Negro and Azul Azul, this helps them
                                                    attract better sponsorships agreements, because the agreements are based in the potential of
  38.4%      37.6%      44.8%      45.6%      42.0% exposure that the team gives, and the potential that their customers has.
                                                                                        Excluding the transfers of players, Cruzados gain less revenues than the other two main
  26.6%                                                                                 teams in 2015 and 2016 (Figure 19), but comparing the revenues per fan/follower of each
                       21.3%               25.7%                  23.3%                 team the relation between the teams is the opposite as before (figure 20). Cruzados is the
                                                                                  21.0% more efficient collecting revenues per fan and follower than Blanco y Negro and Azul Azul.
      15%
                                                                  13.5%
                                19%           10%                                   19% Performance outcome – Regarding this driver, Cruzados does not have the same amount of
                                                                                          winning championship than the other main teams. Since 2009 Cruzados have been champion
       7.1%                                                        7.2%                   only in two national’s tournaments compare to eight of Azul Azul and four of Colo Colo -
                       7.2%                         6.6%                            8.0% excluding international performance. However, Cruzados competitive position is not based
      2013               2014                 2015                 2016             2017 on most tournament’s winning in the national’s competition, instead it is known as the more
                                                                                          consistent one in relation of result, since 2010 (Figure 18). This is supported by the cadets’
                      Colo colo                                          U. de Chile      strategy they have, in which they put special emphasis in the quality of the player they form.
                      U. Católica                                        None             Giving consistency to their results.

                        Source: Gfk Adimark of Soccer 2013, 2014, 2016 and 2017           INVESTMENT SUMMARY
                                                                                          INVESTMENT THESIS
Fig. 18: Cummulative Soccer Results
                                                                                          We issue a HOLD recommendation on Cruzados with a target price of CLP $131 per share
420                                                                                       representing a 2% upside from closing price of CLP $128.5 per share of November 9, 2017.
400        410            405
                                                                                          Our target price is based on a mix of the Discounted Cash Flow to Equity Model and
380
                                        391                                               EV/EBITDA multiples, attributing 90% and 10% weighting respectively to each methodology.
360
                                                                                          KEY POTENTIAL DRIVERS:
                                                                                          Engagements of the Fans and Followers - Fans and Followers is a key driver since they are the
340
                                                        338            333
320
                                                                                          base of a soccer club. (FIG GRAFICO HINCHA CONI) Even so this aspect has been decreasing,
300
        U. Católica     Colo Colo    U. de Chile      O'Higgins     U. Española
                                                                                          Cruzados maintain their range of support, thus it is foreseeing that this driver will be as
                                                                                          positive as in historical information. As the scenario used represent a conservative approach
                                                      Source: Team Research
                                                                                          we forecast that fans and followers will remain in it historical 64% of assistance to the
                                                                                          stadium in the long-term.

                                                                                          Winning Stars - Sporting success on-field triggers positive results for both club and players
                                                                                          of the professional roster. Historically, Cruzados have shown that after good result on-pitch
                                                                                                                                                                                      5
respectively. Furthermore, achieving soccer success induce to more fans and followers that
                                                            cause a “domino effect” resulting in positive revenues for the club.

                                                            MERITS:

                                                            Reliable Sponsorship’s Revenues - In Chile there is a socio-economic classification for the
                                                            population based on the spending capacity been the denomination ABC1 the richest and D
                                                            the poorest. Based on this measure, Cruzados’ mainly fans are assign as ABC1. On the other
                                                            hand, sponsorship contracts are based on the fans and follower the team have, because of
                                                            the exposure it means for the brand and potential consumers. Consequently, Cruzados’
                                                            sponsorship contracts pay CLP $4,074 for each fan, which we foresee it will increase
                                                            responding to inflation and population growth

                                                            Engaging up-coming talents - Regarding Cruzados’ strategy in sport management, the club
                                                            pursue to discover potential players with talent recruiters and develop them to become a
                                                            prospective youth talent for both professional roster and as possible revenue. This cadet-
                                                            program create upcoming talent with a strong soccer culture which facilitate the adaption of
                                                            the player in any kind of team, those discipline values turns Cruzados into an attractive club
                                                            to buy players from. This strategy is forecast to continue in the long-term in which we expect
                                                            to be 60% of the total transfers revenues.

                                                            CONCERN

                                                            Intangible Fixed Assets – Cruzados’ historical EBITDA is 16% of the total revenues which
                                                            remains the same in our projections in the long-term. This stream is not reflected in a high
                                                            equity value due the intensive expense on players. In this industry, soccer clubs must invest
                                                            in buying player to improve the roster with the purpose to achieve on-field results. On the
                                                            other hand, buying players trigger higher expenses, as a result, clubs must balance their
                                                            revenues with their capex and their expenses to afford that decision.

Fig. 19: Target Price                                       VALUATION
Total Equity Value (Th)                                     Frameworks considered for modeling
                                  $      17,658,423
(Multiples Approac h)
Total Equity Value (Th)
                                  $        7,378,793        The main approach used for the valuation was the Discounted Cash Flow (DCF) to the Equity
(DCF Optimistic Sc ene)                                     weighted 90% and the remainder 10% correspond to the Multiple model. (Figure 19).
Tot al Equit y Value Weight ed $          8, 406, 756       Between the present value models, the Dividend Discount Model was not used because
(Th) (10% / 90%)
                                                            extrapolating the historical information for future dividends is not an option. On the other
Outstanding Shares (Th)                      64,201
                                                            hand, the fact that Cruzados does not manage any financial debt, nor it is expected, means
Target Pric e (CLP)            $                 131        the equivalence of the used approach with the APV and the DCF to the Firm. Furthermore, this
Current Share Pric e (CLP)                                  DCF to the Equity was estimated based on a conservative scenario root on their historical
                               $                 128.5
11/09/2017
                                                            results.
Upside (Dow nside)                               1. 90%
                                    Source: Team research
                                                            Comparing footballs clubs across borders frequently involves cultural and economic
                                                            differences, resulting in different risks and growth opportunities implying a possible misprice
Fig. 20: Discount Rate                                      if we use any of the ratios Price to Cash Flow, Price to Sales and Price to Book Value for
                                                            Cruzados relative to the chosen peers. Also, since some of the comparable football teams
                                                            have trailing losses using P/E would suggest a negative price. Therefore, the ratio used was
Risk Free Rate                                  4.45%
                                                            EV/EBITDA, which reflects in an objective and comparable manner the efficiency of the
Beta                                              0.83
                                                            company, on the based on the resources invested. Hence, we can not use more than one
Equity Risk Premium                             6.55%
                                                            valuation indicator than EV/EBITDA we decided to weight this approach 10% in the target
CAPM                                            9. 89%
                                                            price.
Iliquidity Premium                              4.20%
Discount Rat e                                 14. 09%      Valuation Horizon
                                    Source: Team research
                                                            The forecasting method consist in a two-stage growth model. The first phase is based in a
                                                            specific year to year forecast up to 2022, considering the historical movements of each
                                                            account (see Appendix H and I). And the second phase is based more in macroeconomic
Fig. 21: Sensibility Test                                   variables like the GDP growth and the expected inflation rate. Since the most important
                                                            assets of Cruzados, are given by concession, and the renewal isn’t clear, we used residual
 WA C C     13.0% 13.5% 14.1% 14.5% 15.0%                   value for the year 2049, when the actual concession should end, for the only big asset that is
 Pr ec io    134   125      115   109      102              not under concession, the players rights.

                                    Source: Team research   Explanation of Cash Flow Generation

                                                            The two main drivers of this industry are the number of fans and followers, and the sportive
 Fig. 22: Betas
                                                            achievements obtain by the team in the national and international levels. These ones are the
                                                            responsible for the movement of the revenues and main cost streams. The number of fans
                                                            and followers, moves the revenues that the CDF distribute, the occupation rate in the stadium
  Hist oric al Met hod                                      and the sponsorships contacts, to name few. The achievements, generates international
  Beta                                    0.50              broadcasting revenues, sales of players, and more exposure, that is appreciated by the
  R^2                                    3.99%              sponsors. This movement generates more revenues, but also more costs by the hand of the
  Unleverage-peers Met hod                                  players and coaching staff expenditures, and tournaments expenses.
  Beta                                    0.63
                                                            Estimating the discount rate
  R^2                                       4%
  Ent ret ainment Met hod                                   For the estimation of the discount rate, we applied the Capital Assets Pricing Model (CAPM) to
  Beta                                    0.83              obtain the cost of equity. A Central Bank Bond 10Y in CLP which yield a return of 4.45% was
                                  Source: Team research     used as risk-free rate. For the Equity Risk Premium, we used a common target premium used
                                                            for Chilean company valuations.(Fig. 20)

                                                            For the beta, if we administer a historical approach for Cruzados’ return, the value obtained
                                                            and its relevance in term of coefficient of determination (R2) imply a non-statistical
                                                            significance. Not even including international soccer clubs as comparable, to achieve an
                                                            unleveraged-industry-beta, the relevance does not change. Hence the best proxy to estimate
                                                                                                                                                    6
                                                            the beta of a soccer club, was to use the ones provided by Damodaran* for the global
                                                            entertainment industry. Due there is not financial. (Fig.22)
Due there is not financial debt, Cruzados’ beta is the same as the unleveraged one. Finally,
                                                                  we add to the cost of capital an illiquidity premium from the study of Yakov Amihud*** for
                                                                  Chile, to adequately reflect the real risk of the stock since their trading volume.

  Fig. 23: Multiples Approach                                     Multiples Approach

Median EV/EBITDA Industry                                  7.21   We identified Enterprise Value (EV) to Earnings before Interest, Taxes, Depreciation and
EBITDA 2018E                                       1,998,909      Amortization (EBITDA) as the appropriate multiple to compare Cruzados to its peers. We used
                                                                  EV/EBITDA mainly because the soccer industry is a capital-intensive business compromised
EV                                               14,402,139
                                                                  by substantial amortization. This multiple valuation will consider a 10% of the total value
(-) Finance Debt                                            -     obtained (the remainder 90% correspond to DCF valuation).
(+) Cash and Equivalents                           3,256,284
                                                                  The relevant market are national and international soccer clubs. Thus, we considered as peers
Total Equity Value                               17,658,423
                                                                  both Blanco y Negro and Azul Azul (National Clubs) and seven clubs from other countries,
Number of Shares                                       64,201     trying to emulate the industry. Hence, the average historical industry multiple as for 2014 to
Fair Value per Share (CLP)                                 275    2016 is 7.55x. Since the first semester of 2017 has an abnormal international broadcasting
                                                                  revenue, we used the Cruzados’ forecast 2018 EBITDA. (Fig. 23)

                                                                  FINANCIAL ANALYSIS
                                                                  Weak Profitability
                                                                  The profitability ratios show a poor performance, especially in 2012 and 2015, when the net
                                                                  income was negative, because of a significant decrease in the revenues from the sale of
                                                                  players. (Figure 22)

                                                                  When compared with its peers, Cruzados is the one with the lowest revenues. (Azul Azul and
                                                                  Blanco y Negro) in the last 5 years, regardless of that, is more stable than the others, with an
                                                                  11.3% of revenue growth YoY. In the same period Blanco y Negro achieved a 20.2%, but with
                                                                  highest volatility. Meanwhile, Azul Azul showed a consistent decline in its revenues (Figure
                                                                  24).

                                                                  In spite of the above, Cruzados historically has obtained the highest operating income, due
                                                                  their strategy, mentioned previously, followed closely by Blanco y Negro (Figure 23). Likewise,
                                                                  both teams are the ones with the highest operating margin, this means that they are better
                                                                  prepared than Azul Azul for future crisis, or an increase in competition.

                                                                  For the year 2018, there are expected negative net income, given the low performance
                                                                  reached in the current year, and to the increase in the total costs (Figure 25). Because
 Fig. 25 Net Income Evolution (M CLP$)                            Cruzados didn’t qualify to Copa Libertadores nor Copa Sudamericana for the next year, they
  1,000                                                           will not receive any income from International Broadcasting.

                                                                  From the Dupont Analysis (figure 24), we can get the following information:
      500                                                         Profit Margin – This industry shows a very volatile ratio. Due to the high dependence that the
                                                                  teams have on their sporting successes, and in the transfer of players (Figure 1). It is
        0                                                         important to notice that the transfers depends highly on external factors that can not be
                                                                  controlled by the teams. However, Cruzados shows better results in comparison to its peers
     -500                                                         in the form of only two years of losses instead of the three or more that shows the other two
                                                                  firms.
 -1,000                                                           Asset Turnover - Even though a 0.7x ratio isn’t much in the general of industries, by
                                                                  comparing it with the national and international football industry, the 0.7x it is above
 Fig. 26: Historical Operational Margin
                                                                  average. Cruzados is the most efficient in the use of their assets, implying that the firm is
                                                                  generating more sales per Chilean pesos of assets. Azul-Azul and Blanco y Negro has a 0.58x
  20%                                                             and 0.29x ratio respectively. Cruzados efficiency even exist when comparing it with one of
  10%                                                             the most profitable teams at the international level, Manchester United, that has a 0.48x
   0%                                                             ratio. All ratios where calculated as a five years average.
 -10%    2012         2013      2014   2015        2016           However, if the turnover of the gross purchase of player rights is analyzed, the conclusions
 -20%                                                             change, being Blanco y Negro the most efficient with a rotation of 2.45x in 2016, followed by
 -30%                                                             Cruzados slightly below with a 2.41x, and finally Azul Azul with a 0.87x (Figure 27 and 28).
 -40%
 -50%                                                             Financial Leverage - The main three teams have the same financial leverage ratio, this
     Cruzados              Azul Azul     Blanco y Negro           happen because non has any financial debt. This can be explained by the fact that it is
                                       Source: Bloomberg          difficult for them to have access to funding, from banks or financial institutions because of
                                                                  the risks they represent because Chilean teams don’t have assets to put as collateral. In the
                                                                  case of Cruzados, they don’t own the Stadium San Carlos de Apoquindo, because it is part of
                                                                  the concession given by Club Deportivo Universidad Católica. Therefore, it can not be used as
                                                                  collateral to secure for leverage. Additionally, they have a policy of not having this kind of
                                                                  debt. Because of this Cruzados keen in having enough cash to buy players and carry out
                                                                  projects (see the table in the next page: “Selected Key Financials”).
                                                                  Because of that, we believe that Cruzados should continue without financial debt, since it is a
                                                                  feature of the industry in Chile that teams can not obtain financing through banks or other
                                                                  financial entities.

                                                                                                                                                            7
Fig. 27: Cruzados versus Peers
C r u zado s              2012       2013           2014     2015        2016
In M$
Operational Margin       -15.24%    -0.62%         1.06%    -11.87%      1.35%
EBIT                     -1,136      -57             99      -1,148       154
                                                                                  Liquidity Ratios
Revenues                  7,451      9,097         9,360     9,667       11,450   Cruzados has been healthy in terms of liquidity over the years (Figure 22). The current rate is
Dupont analysis                                                                   around 1.84x, and the historical ratio has never been below 1x. Because of this, Cruzados
         Profit Margin   -9.96%      2.43%         0.77%     -4.99%      1.65%
                                                                                  has the ability to pay all its current obligations. It is important to mention that in 2015a
       Asset Turnover     0.63x      0.74x         0.72x     0.64x       0.78x
 Financial Leverage        1x         1x             1x        1x         1x      capital increase took place, collecting $1,345.9 millions, a large part was used for purchasing
                                                                                  players and infrastructure. The capital increase continued in 2016, raising an additional
A zu l A zu l             2012       2013           2014     2015        2016     $788.1 millions.
In M$
Operational Margin       22.01%      1.49%        -17.89% -25.18% -46.97%
                                                                                  The increase in cash and equivalents can be explained with the capital increase, with a
EBIT                        5,748          230     -2,659    -3,442      -6,009   decrease in the receivable documents that is generated by the sale of the economic rights of
Revenues                   26,118     15,428       14,864    13,669      12,793   the players.
Dupont Analysis
                                                                                  Although Cruzados had has losses for several years, it has also generated flows, largely due
         Profit Margin   16.39%      0.81%        -11.28% -17.48% -35.21%
       Asset Turnover     0.86x      0.52x         0.57x     0.54x       0.43x
                                                                                  to the intangible assets amortization, compound mainly by the concession and the purchased
 Financial Leverage        1x         1x             1x        1x         1x      of players right. Because of this , we believe that thay will continue being able to pay their
                                                                                  current obligations, and therefore the ratios related to liquidity will continue to be place
Blan c o y Neg r o        2012       2013           2014     2015        2016
                                                                                  above 1x, around 1.6x.
In M$
Operational Margin       -36.22%    -31.94%        1.28%    -16.42%      3.72%                                                Selec ted Key Fin an c ials
EBIT                       -2,901     -2,970          203    -2,449        621
                                                                                                                                      2012         2013       2014            2015           2016
Revenues                    8,010      9,299       15,855    14,917      16,715
Dupont analysis                                                                   In M$
         Profit Margin   -31.77%    -24.90%        3.66%    -12.19%      -3.22%   Net Income                                      -     742          221         72         - 482                189
       Asset Turnover     0.17x      0.22x         0.35x     0.34x       0.39x
                                                                                  Depreciation                                           39           46         62              61               97
 Financial Leverage        1x         1x             1x        1x         1x
                                                                                  Amortization                                         1,429       1,943      1,303           2,050          1,791
                                                       Source: Team research
                                                                                  Capital Expenditure                                  1,060         944      1,258           1,516          1,530
Fig. 28: Gross Transfer of Players Turnover                                       Change in Net Working Capital                   -     677        1,660    - 1,427         - 301                484
                                                                                  Fr ee C as h Flo w                                   343       - 394       1,605             415                62
                                    2015                    2016

  Cruzados                          1.73x                  2.41x                  Revenues                                            7,451       9,097      9,360            9,667         11,450
  Blanco y Negro                    1.97x                  2.45x                  EBITDA                                               332        1,938      1,464             963           2,042
  Azul Azul                         1.81x                  0.87x                  EBIT                                                -1,136        -57         99           -1,148              154
                                                                                  En ter pr is e Valu e                               8,888       9,247      7,446           7,613          6,181
                                                 Source: Team research
                                                                                     (+ ) Market Capitalization                       10,000      10,000     9,000            9,435          9,437
                                                                                     (+) Finance Debt                                    -           -           -              -                -
                                                                                     ( -) C as h an d Mar ketable Sec u r ities       1,112        753       1,553           1,822          3,256

                                                                                                                                                                      Source: Bloomberg & Team
                                                                                                                                                                      Research

Fig. 29: Year Share Price                                                         Other Ratios
                                                                                  EV ratios (Figure 22) present a downward trend, driven by a reduction of the EV between 2012
                                                                                  and 2016. This is explained by a generalized decrease in the market capitalization and an
                                                                                  increase in cash and equivalents, specially in 2016 (See table: “Selected Key Financials”). The
                                                                                  big difference between EV/EBITDA and EV/EBIT is explained by the large amortizations that
                                                                                  have to be recognized for the purchase of the players rights and the concession.

                                                                                  Downward Trend Price
                                                                                  Since Cruzados IPO, it can be seen a generalized decrece in their price. This cause the
                                                                                  negative expectation that the market is forseeing for the future cash flow generation and in
                                                                                  speceific a weak EBITDA (Figure 29).
                                                       Source: Bloomberg

                                                                                  INVESTMENT RISKS
                                                                                  *Impact and likelihood of the following risk are presented in figure XXXXX.

                                                                                  Market Risks
                                                                                   (M1) ANFP’S new reduction of broadcasting revenues share-out limits – (Impact: Medium/
                                                                                  Probability: Low)
                                                                                  Since 2016 until 2023 the ANFP has already limited the percentage of revenues for
                                                                                  broadcasting to be distribute reducing it from 6% to 4%. As a limit has being set and reduce
                                                                                  already there is no certainty that this will not happen again reducing the broadcasting
                                                                                  revenue.
                                                                                  •Impact on Revenues: If the broadcasting revenues to be distributed by the ANFP to the
                                                                                  clubs stays in the revenues obtained in FY 2016, then a reduction of 0,5% in the share-out
                                                                                  limit to Cruzados would be equal to CLP $ 212.9 Millions in the yearly revenues.

                                                                                                                                                                                                  8
(M2) Growth of Players and Coaching Staff Expenses – (Impact: High/ Probability: High)
    Fig. 101: Risk Matrix                                     This industry is players expenses intensive, demanding the best roster it can be afford. The
                                                              teams must mainly employ Chilean players (only can be 4 non-Chilean players on field per
                                                              team). The players expenses in Chile increased on average 52% YoY from 2009 to 2016
                                                              (figure IO). The best Chilean players are usually being recruit by European clubs with higher
                                                              monetary offers. Consequently, the clubs are expending more in players every year, but the
                                                              performance of the players do not represent the increase in expenses and it do not generate
                                                              revenues growth at the same or higher rates.
                                                              If the revenues and expenses keep increasing as it historically grown, it is possible to the
                                                              wages beats the revenues excluding transfers related revenues (figure 102).

                                                              (M3) Limited potential fans and follower’s expansion – (Impact: High/ Probability: High)
                                                              The fans and follower can stop supporting the club, but they are not going to change and
                                                              support another Chilean team. In other words, the Colo Colo’s fans are never going to be
                                                              Universidad Católica’s fans. Thus, the increase of fans and followers is limited to the number
                                                              on people interest in soccer but with no team chose and this population can reduce in the
                                                              followings years.
                                                              In FY 2017 Cruzados potential market was 165 thousand persons, and persons who are
                                                              interest in soccer has stayed near 50% of the Chilean population since 2013.

                                                              (M4) Pour Chilean national soccer team’s performance – (Impact: Medium / Probability: High)
                                     Source: Team Analysis
                                                              As the Fans don’t change their team preferences, the population that are interest in soccer
                                                              but they do not have preference for any Chilean Club are the only possibility to increase the
                                                              followers of Cruzados. Therefore, the performance of the national team can encourage or
                                                              discourage potential followers. A pour performance with no classifications to international
 Fig. 102: Wages Players and Coaching Staff                   tournaments discourage the interest in soccer of the Chilean population, reducing the
             risk in CLP millions                             potential fan and followers

36,000                                                        Operational and Business Risks
                                                              (OB1) Severe or Chronic injuries of relevant players – (Impact: High / Probability: Low)
31,000
                                                              Injuries disable the players to take part of the game for a time and possible limits the injured
26,000                                                        future performance. Additionally, the transfers of players is the main revenue source
                                                              historically, then a severe or chronic injure reduce significantly the sell possibilities and its
21,000                                                        price.
16,000                                                        (OB2) High Players and Coaching Staff expenses not assure sporting success – (Impact: High /
11,000                                                        Probability: High)
                                                              Cruzados’ revenues depend on the sport success of the roster, but the hiring expenses do
 6,000                                                        not ensure performance. Therefore, the club spend an amount expecting certain performance
                                                              and return, but it is possible that those foresees do not accomplish. Not fulfill the expected
 1,000                                                        performance affect directly the revenues, the club must pay the players despite the results
                                                              and the sell prices tend to decrease with low sport results.
                                                              •Mitigant: Cruzados is starting to try new sponsorships terms where the variable revenues of
         Revenues excluding Transfers and Solidarity          it depends on commercial goals rather than the team performance.
                                                              •Mitigant: The club intensively promotes its upcoming talents (figure 10), thus it can spare in
         Wages Players and Coaching Staff                     expenses and cruzados has proof that its cadets can generate a good team performance.
                   Source: Annual Report and Team Analysis

                                                              (OB3) Change of trainer, key players or management – (Impact: / Probability: )
                                                              These three factors are all related, the management decide who is going to be the trainer and
 Fig. 10: Percentage of Players on the Squad                  for how long and the trainer define the roaster according his strategy. Then every time that
             Formed by Cruzados                               management change or the trainer change the roaster can be completely renovated.

               69%                                            Financial Risks
         66%                                                  (F1) Short term illiquidity – (Impact: High / Probability: Low)
  58%                  60%                          59%       Cruzados‘ EBITDA has been in average 817 Millions since 2010 and its average of payable
                                55% 53%                       debts to the buyer team is 1,151 Millions. Thus, if the debt accreditors require all the
                                                              payments at ones, Cruzados do not have the paying capacity.

                                                              (F2) Non-Banks’ financing – (Impact: High / Probability: Low )
                                                              If Cruzados appeal to the banks for financing, they can not put Universidad Católicas’ in
  2010 2011 2012 2013 2014 2015 2016                          concession assets as collateral. Thus the banks do not loan resources to the club.
                                                              This could be a future liquidity problem for Cruzados.
                                     Source: Company Report

                                                              (F3) Issue of Shares - (Impact: High / Probability: Medium )
                                                              In 2015 the club issued 35 millions shares for the first time and there are still 18 millions
                                                              shares available to subscribe. If Cruzados is not able to subscribe the hole issuance of
                                                              present a real difficulty selling the remaining shares, is going to difficult even more future
                                                              financings.

                                                              Natural Risks
                                                              (N1) Seismic Country     - (Impact: High / Probability: Low)
                                                              The Stadium is located in San Carlos de Apoquindo, nearby the San Ramón geological fault in
                                                              a seismic country with constant telluric activity. Then it is possible that an earthquake could
                                                              disable the installations for a time or even destruct them leaving Cruzados without court to
                                                              train and compete.

                                                                                                                                                             9
APPENDIX A: BUSINEES MAIN AREAS

                                                                Source: Company Report

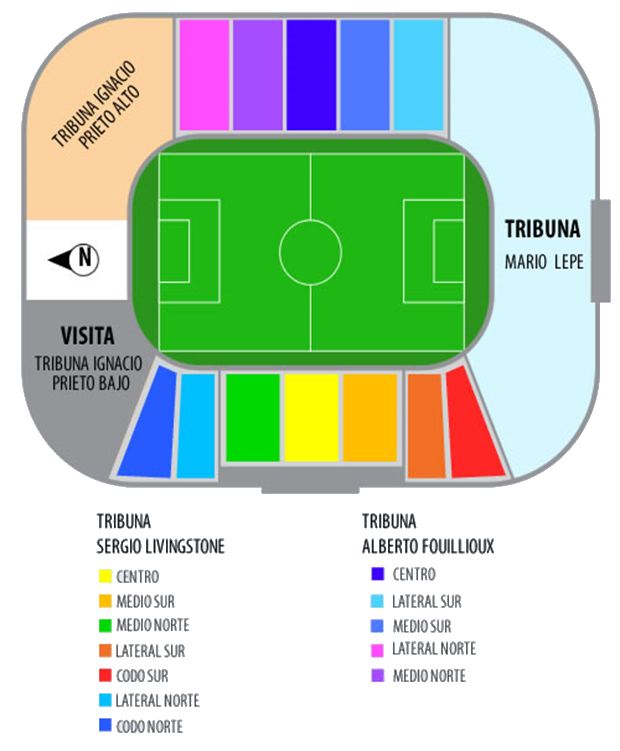
APPENDIX B: CRUZADOS’STADIUM

In 2014, seats were installed, instead of plank, in the Sergio Livingstone grandstand. This allowed the different locations to be
segmented by prices, with the middle and center being the most expensive ones.

                                                                                                                               10
APPENDIX C: CHILEAN FANATISM BREAKOUT

                               % over Chilean Population   N umber of                                         Dis tribution of the Chilean Population
                     Club
                                   Interes t in Soc c er Fans /Followers                                              by Socioeconomic Group
    Colo colo                              42%                 3,648,505
                                                                                                              ABC1                                                             7%
    U. de Chile                            21%                 1,824,252
                                                                                                              C2                                                              15%
    U. Católica                             8%                   694,953
                                                                                                              C3                                                              22%
    Santiago Wanders                       1.8%                  156,364
                                                                                                              D                                                               34%
    Cobreloa                               1.4%                  121,617
                                                                                                              E                                                               21%
    Everton                                0.8%                   69,495
    O'higgins                              0.6%                   52,121
    Antofagasta                            0.5%                   43,435
                                                                                                           The     Chilean   population  is
    Rangers                                0.5%                   43,435                                   distributed in the socioeconomic
    Deportes Iquique                       0.4%                   34,748
                                                                                                           groups mentioned in the table
    Coquimbo Unido                         0.4%                   34,748
    Magallanes                             0.4%                   34,748                                   above, ordered from highest to
    Deportes Concepión                     0.3%                   26,061
                                                                                                           lowest income.
    Unión Española                         0.3%                   26,061
    Audax italiano                         0.3%                   26,061
    Palestino                              0.3%                   26,061                                           Monthly Income of Each
    Huachipato                             0.3%                   26,061                                       Socioeconomic Group    (in CLP)
    San Marcos de Arica                    0.3%                   26,061                                      ABC1                     1,700,000 or more
    Deportes La Serena                     0.2%                   17,374                                      C2                       600,000 to 1,200,000
    Don't have a favorite Club             19%                 1,650,514                                      C3                       400,000 to 500,000
                                                                                                              D                        200,000 to 300,000
                                                                                                              E                        Less than 160,000

                                                                                                                                                          Source: GFK Adimark, 2017

     APPENDIX D: CHAMPIONSHIP VICTORIES

                   Torneo                  2008                          2009                          2010                           2011                         2012
Apertura Primera divis ión            Cuartos de Final                Semifinales                                                 Semi-Campeon                Cuartos de Final
                                                                                            Campeón de Primera División
Claus ura Primera divis ón            Cuartos de Final              Semi-Campeon                                                    Semifinales               9º Fase Regular
Copa Chile                             Segunda Fase                   Quinta Fase                 Octavos de Final                  Campeón

Copa Libertadores de Améric a          Primera ronda                                                Segunda Fase                Cuartos de Final               Segunda Fase
Cupo                                                                                            Cupo Chile 3 --> F1           Cupo Chile 1 --> F2           Cupo Chile 2 --> F2
                                                                                           Best-placed non-champion por     Campeon Primera Division       Primera Division 2011
                                                                                                   clausura 2009                     2010                 aggegate table best non-
                                                                                                                                                                 champion

Copa Sudameric ana                    Octavos de Final                                                                            Octavos de Final              Semifinales
Cupo                                                                                                                           Cupo Chile 2 --> FR          Cupo Chile 1 --> F1
                                                                                                                            Clasificación Apertura 2011     Campeon Copa Chile

                   Torneo                 2013                           2014                          2015                          2016                          2017
Apertura Primera divis ión            Semi-Campeon                        14°                    Semi-Campeon (2°)                  Campeón
Claus ura Primera divis ón            Semi-Campeon                  Semi-Campeon                   Semifinales (4°)                 Campeón                       Semifinal
                                                               Semifinales (2013- 14)
Copa Chile                       2º vs U. de Chile (2012-13)                                   Octavos de Final (2015)              Campeón                     Segunda Fase
                                                               Fase de Grupos (2014-15)

Copa Libertadores de Améric a                                                                                                                                   Fase Grupo
Cupo                                                                                                                                                        Cupo Chile 1 --> FG
                                                                                                                                                           Campeon Clausura 2016

Copa Sudameric ana                    Octavos de Final               Primera ronda                Segunda ronda                  Primera Fase                  Segunda ronda
Cupo                               Cupo Chile 3 --> F1            Cupo Chile 3 --> F1          Cupo Chile 3 --> F1            Cupo Chile 1 --> F1
                                 2do lugar transición 2013     Primera Division 2014-14    Campeon Liguilla Clausura 2015   Campeon Liguilla Apertura
                                                               aggregate table best team                                             2015
                                                                      not qualified

                                                                                                                                                                                 11
APPENDIX E: TOURNAMENTS

                                                            In Chile the 16 best teams, according previous year results, use to play three national
                                                            tournaments (Torneo de Clausura, Torneo de Aperura and Copa Chile). Torneo de Clausura
Fig. ..: Libertadores Qualifiying Stages                    and Torneo de Apertura, known as national Championship, were half a year tournament, but
                                                            from the next year both tournaments are going to be replaced by an annual
                                                            tournament. Additional to the national tournaments the Chilean teams are able to qualify in
                                                            two international tournaments, Copa Libertadores de América and Copa Sudamericana.

                                                            National Tournaments

                                                            National Championship – This Championship is the is comprised of the top 16 soccer teams
                                                            in Chile known as the Primera A. The basic principles of the championships have change
                                                            several times, especially the quantity and the calendar of tournament (Appendix X). In March,
                                                            the ANFP announced the change of this championship from two half year tournaments to an
                                                            annual tournament. Until the date the ANFP has no specify all the principles, but they declare
                                                            it would be a 16 teams’ tournament and all will meet in two games (one home and one
                                                            away). Until this year the Torneo de Apertura and Torneo Clausura were played by the top 16
                                                            teams and each tournament had 15 match days. The team that has the most points at the
                                                            end of the tournament wins the title, each win is awarded three points and each draw is
                                                            awarded one point. At the end of each season the bottom three teams will be relegated from
                                                            the Primera A. The first half competition grants two places in international competitions. The
                                                            second half competition grant four places in international competitions (Figure 15). As the
                                                            classification system to international tournament for the annual championship has not been
                                                            specified yet, it is plausible to estimate that the annual competition will grant the same
                                                            places that the two half year competition.

                                                            Copa Chile – This Cup is played by the top 32, the teams from the Primera A and the
                                                            following top 16 teams (Primera B). In its First round each team from Primera A plays against
                                                            a team of the Primera B, one home and one away, according from the geographic location
                                   Source: Team research    with direct elimination. This cup grant two places in international competitions (See Table
                                                            “Chilean classifications to International Competitions “).

                                                            International Tournaments

                                                            Copa Libertadores de América – It is one of the most prestigious tournaments in the world
                                                            and the oldest and most prestigious club competition in South American soccer. The
                                                            competition has had several times over its lifetime. The last basics principles define the
                                                            participation of 32 teams of which 4 teams classification in the National Chilean’s
                                                            tournaments.

                                                            Copa Sudamericana – It is the second most prestigious club competition in South America
                                                            soccer. The competition comprised 48 teams in a knockout format, with 16 sides getting bye
                                                            to the second round where the last 32 teams

   Fig. ..: Sudamericana Qualifiying Stages                 Tournaments Calendar

  1st Stage
              2nd Stage

                          Round 16
                                 Quarter

                                           Semi
                                                                                                                                           Source: Team research

                                                   Final

                                                            Chilean classifications to International Competitions

                                                             Copa Libertadores de Améric a
                                                                               2018                    2019E
                                                             Chile 1 1º Torneo Clausura 2017 1º Nacional Championship
                                                             Chile 2 1º Torneo Apertura 2017 2º Nacional Championship
                                                             Chile 3    1º Copa Chile 2017       1º Copa Chile 2017
                                                                     Winner - 2º Apertura vs
                                                             Chile 4                         3º Nacional Championship
                                                                            2º Clausura

                                                             Copa Sudameric ana
                                                                             2018                      2019E
                                                                     Loser - 2º Apertura vs
                                                             Chile 1                          4º Nacional Championship
                                                                          2º Clausura
                                    Source: Team research    Chile 2  3º Torneo Apertura      5º Nacional Championship
                                                             Chile 3  4º Torneo Apertura      6º Nacional Championship
                                                             Chile 4     2º Copa Chile              2º Copa Chile

                                                                                                       Source: Team research
APPENDIX F: REVENUES AND COSTS CHANGE

The costs have grown at a higher rate than revenues for the last few year in the soccer industry.
 In the following graph you can see the change between 2009 and 2015. This is mainly due to the increase in the cost of the squad and
coaching staff.

                                                           Source: ANFP Financial Control Unit, 2015

                                                                                                                                   13
APPENDIX G: ROSTER AND COACHING STAFF

                                                                                                                                      In
                          C o n tr ac t                                                       Mar ket Valu e Fo r m ed by
         Nam e                                Natio n ality        Pr o v en an c e     Age                                       C r u zado s
                           ex pir y                                                             ( M C LP$ )       C r u zado s
                                                                                                                                    Sin c e
  Go alkeeper s
  Cristopher Toselli               2018                       Up-and-comeing-talent     29               477          yes                  2007
  Franco Constanzo                 2017                       Olympiacos                37                    -                            2013
  Álvaro Ogalde                           -                   Up-and-comeing-talent     20                37          yes                  2016
  Defen der s
  Benjamín Vidal                   2020                       Palestino                 26               331                               2017
  Branco Ampuero                   2018                       Deportes Antofagasta      24               331                               2017
  Cristián Álvarez                 2017                       Universitario             37                73          yes                  2011
  Germán Lanaro                    2018                       Palestino                 31               367                               2015
  Fernando Cordero                 2018                       Unión Española            30               441                               2012
  German Voboril                   2018                       Newell`s Old Boys         30               331                               2017
  Stefano Magnasco                        -                   Groningen                 25               624          yes                  2014
  Juan Carlos Espinoza             2019                       Huachipato                26               404                               2015
  Benjamín Kuscevic                2019                       Real Madrid Juvenil       21               514          yes                  2015
  Midfield
  César Fuentes                    2019                       O`higgins                 24               606                               2015
  Carlos Lobos                     2018                       Up-and-comeing-talent     20               294          yes                  2014
  Ignacio Saavedra                        -                   Up-and-comeing-talent     17                37          yes                  2017
  Fabián Manzano                          -                   Up-and-comeing-talent     23               220          yes                  2012
  Luciano Aued                     2019                       Racing Club               30               514                               2017
  Carlos Espinosa                  2018                       Huachipato                34               147                               2015
  Diego Buonanotte                 2019                       AEK Atenas                29               918                               2016
  Fo r war ds
  Jeisson Vargas                          -                   Estudiantes de la Plata   20               882          yes                  2017
  José Luis Muñoz                  2018                       Santiago Wanderers        30               184                               2017
  José Pedro Fuenzalida            2019                       Boca Juniors              32               367          yes                  2016
  Diego Vallejos                   2020                       Audax Italiano            27               441                               2017
  David Llanos                     2018                       Huachipato                28               294                               2014
  Santiago Silva                   2017                       Banfield                  36               257                               2017

                                                                                                                            Source: Team Research

The Roster is compound by 25 players, 10 of them were formed by the same team in previous years, and 5 were promoted from the
cadets (Up-and-comeing-talent). Those who have been in the team the largest time are Cristopher Toselli, Cristián Álvarez, Fernando
Cordero and Fabián Manzano, compelling more than 5 years in Cruzados. According to Transfer Markt figures the market value of this
team is valuated in CLP$ 9,091 millions (Euro 12,4 millions).

The coaching staff is compound by 6 members; Mario Salas, the coach of the team, of chilean nationality has been with cruzados one
and a half year and his contract is ending on 2018. The rest 5 are Leonardo Zamora, Fernando Gutierrez, Osvaldo Alegría, Cristián
Villagrán and Javier Rodríguez that are assistant coach and physical trainer of the players.

                                 14
APPENDIX H: STATEMENT OF FINANCIAL POSITION

    Balance Sheet

In Millio ns C LP $                                        Dec -12    Dec -13    Dec -14    Dec -15         Dec -16      Ju n -17
A SSETS
C u r r en t A s s ets
Cash & Cash Equivalents                                        46         55        116       1,822           3,256        3,291

Other Current Financial Assets                               1,066       698       1,437

Other Non Financial Current Assets                                                              19              10

Comercial Debtors & Other Current Accounts Receivable         791       2,504      1,327      2,354           1,492         948

Accounts Receivable from Related Entities                        -                     2                                         2

Inventories                                                    12         22         28         31              26              36

Current Tax Assets                                               -                   16         19              17              10

   To tal C u r r en t A s s ets                            1,915      3,279      2,926      4,245           4,802       4,286

No n C u r r en t A s s ets
Comercial Debtors & Other Noncurrent Accounts Receivable                            724        256             241          239

Intangible Assets Different from Capital Gain               8,128      7,062      7,197      7,474           6,567        6,616

Property, Plants and Equipment                                142        167        185        539             535          500

Deferred Tax Assets                                         1,620      1,783      1,985      2,607           2,607        2,607

   To tal No n C u r r en t A s s ets                       9,890      9,012     10,092     10,876           9,951       9,962

   To tal A s s ets                                        11,805     12,291     13,018     15,120         14,753       14,248

EQ U ITY A ND L IA BIL ITIES
L IA BIL ITIES
C u r r en t L iabilities
Comercial Payable Accounts & other Accounts Payable          1,238      1,227      1,383      2,753           1,444        1,208

Current Accounts Payable from Related Entities                 28         82        160         29              76               1

Other Current Provisions                                      130        138        170        246              70          173

Other Current Non Financial Liabilities                        51         63         70        106             183          107

   To tal C u r r en t L iabilities                         1,447      1,510      1,783      3,134           1,773       1,488

No n C u r r en t L iabilities
Non Current Liabilities                                          -       203        204        178             194          470

   To tal No n C u r r en t L iabilities                        -       203        204        178             194          470

   To tal L iabilities                                      1,447      1,712      1,988      3,312           1,967       1,958

EQ U ITY
Total Common Equity                                         15,030     15,030     15,030     16,455          17,243       17,246

Gain (loss) Accumulated                                     (4,721)    (4,500)    (4,048)    (4,530)         (4,342)      (4,840)

Emission Premiums                                               79         79         79

Other Reserves                                                 (30)       (30)       (30)     (116)            (116)       (116)

Equity Attributable to the Owners of the Parent             10,358     10,578     11,030     11,809          12,785       12,290

   To tal Equ ity                                          10,358     10,578     11,030     11,809          12,785       12,290

   To tal Equ ity an d L iabilities                        11,805     12,291     13,018     15,120         14,753       14,248

                                                                                                       Source: Company Report

                                                                                                                           15
APPENDIX I: STATEMENT OF FINANCIAL POSITION

Income Statement

   In Millio n s C LP$                          2015        2016         2017E        2018F         2019F         2020F        2021F        2022F        2023F
   Revenues from National Broadcasting          2,449       2,850        2,756         2,753        2,853          2,951       3,102         3,255       3,494
   YoY growth                                    7.8%       16.4%        -3.3%         -0.1%         3.6%          3.4%         5.1%          4.9%        7.3%
   Revenues from International Broadcasting      199         172         1,174             0         177           356          553           183         584
   YoY growth                                   122.9%      -13.4%       581.2%       -100.0%             -       100.8%       55.2%         -66.9%      219.6%
   Revenues from Matchday                       1,254       1,543         899           918          976           1,636       1,686         1,420       1,611
   YoY growth                                   19.4%       23.0%        -41.8%         2.1%         6.4%          67.6%        3.0%         -15.8%      13.5%
   Revenues from Transfers                      2,037       3,156        3,864         4,593        2,896          4,486       2,502         3,063       3,236
   YoY growth                                   -37.0%      54.9%        22.4%         18.9%        -37.0%         54.9%       -44.2%        22.4%        5.7%
   Commercial Revenues                          3,272       3,677        3,765         4,184        4,532          5,452       6,425         7,272       7,598
   YoY growth                                   25.7%       12.4%         2.4%         11.1%         8.3%          20.3%       17.8%         13.2%        4.5%
   Solidarity & Others                           455          51           87            67           69            71           73            76          78
   Revenues from Ordinary Activities            9,667       11,450       12,545       12,515        11,504        14,954       14,341       15,267       16,600

   Players & Coaching Staff Expenses            (4,028)     (5,168)      (5,219)      (6,749)       (7,424)       (7,499)      (7,724)      (7,955)      (8,273)
   YoY growth                                   29.3%       28.3%         1.0%         29.3%        10.0%          1.0%         3.0%          3.0%        4.0%
   Operating Costs                              (1,367)     (1,263)      (1,271)      (1,463)       (1,661)       (1,535)      (1,677)      (1,688)      (1,738)
   YoY growth                                   13.6%       -7.6%         0.7%         15.1%        13.6%          -7.6%        9.2%          0.7%        3.0%
   Tournament & Other Expenses                   (798)       (679)        (614)        (472)         (613)         (522)        (513)        (464)        (477)
   YoY growth                                   30.0%       -14.9%       -9.6%         -23.1%       30.0%         -14.9%       -1.7%         -9.6%        3.0%
   Transfer Expenses                            (1,214)      (738)       (1,352)      (1,710)       (1,609)        (979)        (565)       (1,034)      (1,065)
   YoY growth                                   -5.9%       -39.2%       83.0%         26.5%        -5.9%         -39.2%       -42.3%        83.0%        3.0%
   Sales Costs Products                          (75)        (104)        (69)         (122)         (81)          (169)        (588)        (439)        (464)
   Cost of Goods Sold                           (7,482)     (7,952)      (8,524)      (10,516)     (11,389)      (10,703)     (11,066)      (11,579)    (12,018)

   Other Operating Income & Expenses            (1,221)     (1,456)      (1,293)      (1,412)       (1,064)       (1,269)      (2,094)      (1,860)      (1,915)
   YOY growth                                   -24.6%      19.2%        -11.2%         9.2%        -24.6%         19.2%       65.0%         -11.2%       3.0%
   EBITDA                                        963        2,042        2,728          587         ( 949)        2,982        1,181         1,829       2,667

   Depreciation & Amortization                  (2,111)     (1,888)      (1,865)      (1,749)       (2,717)       (2,682)      (2,508)      (2,481)      (2,612)
   YOY growth                                   54.7%       -10.6%       -1.2%         -6.2%        55.4%          -1.3%       -6.5%         -1.1%        5.3%
   EBIT                                        ( 1,148)      154          863         ( 1,162)     ( 3,666)        301        ( 1,327)       ( 652)        55

   Ear n in gs Befo r e Tax es                 ( 1,104)      190          895         ( 1,168)     ( 3,673)        294        ( 1,334)       ( 659)        47
   Income Expenses                               622          (2)         (228)         315          992           (79)         360           178         (13)
   Net In c o m e                               ( 482)       189          667          ( 853)      ( 2,681)        215         ( 974)       ( 1,728)       35

                                                                                                              Source: Company Report & Team Research

Free Cash Flow

                                              2015        2016        2017E        2018F        2019F          2020F        2021F        2022F        2023F
          In Millio n s C LP$
          Net Income                          (482)        189          667         (853)       (2,681)          215         (974)       (1,728)         35
          Depreciation                          61          97          108           119          133           147          163           181         192
          Amortization                        2,050       1,791        1,757        1,629        2,584          2,534        2,345        2,299        2,421
          Capital Expenditure                 1,516       1,530         667         (853)       (2,681)          215         (974)       (1,728)         35
          Change in Net Working Capital       (301)        484          683        (1,235)        (782)          767          138             6         122
          Fr ee C as h Flo w                   415          62        1,101        1,019       ( 1,286)          448        ( 356)     ( 1,039)         642

                                                                                                      Source: Company Report & Team Research

                                                                                                                                                                   16
You can also read