Driving the Electrification of Mobility - Switchback Energy

Page created by Edwin Daniels
 
CONTINUE READING
Driving the Electrification of Mobility - Switchback Energy
Driving the Electrification
                           of Mobility

© 2020 ChargePoint, Inc.
Driving the Electrification of Mobility - Switchback Energy
Disclaimer
FORWARD-LOOKING STATEMENTS                                                                                  eliminated; potential adverse effects on ChargePoint’s revenue and gross margins if customers
All statements other than statements of historical facts contained in this presentation (this               increasingly claim clean energy credits and, as a result, they are no longer available to be claimed
“Presentation”) are forward-looking statements. Forward-looking statements may generally be                 by ChargePoint; the effects of competition on ChargePoint’s future business; risks related to
identified by the use of words such as “believe,” “may,” “will,” “estimate,” “continue,” “anticipate,”      ChargePoint’s dependence on its intellectual property and the risk that ChargePoint’s technology
“intend,” “expect,” “should,” “would,” “plan,” “project,” “forecast,” “predict,” “potential,” “seem,”       could have undetected defects or errors; the amount of redemption requests made by Switchback’s
“seek,” “future,” “outlook,” “target” or other similar expressions that predict or indicate future events   public stockholders; the ability of Switchback or the combined company to issue equity or equity-
or trends or that are not statements of historical matters. These forward-looking statements include,       linked securities or obtain debt financing in connection with the Proposed Business Combination or
but are not limited to, statements regarding estimates and forecasts of other financial and                 in the future and those factors discussed in Switchback’s final prospectus dated July 25, 2019,
performance metrics, projections of market opportunity and market share. These statements are               Annual Report on Form 10-K for the fiscal year ended December 31, 2019 and any subsequently
based on various assumptions, whether or not identified in this Presentation, and on the current            filed Quarterly Report on Form 10-Q, in each case, under the heading “Risk Factors,” and other
expectations of ChargePoint, Inc.’s (“ChargePoint”) and Switchback Energy Acquisition                       documents of Switchback filed, or to be filed, with the Securities and Exchange Commission
Corporation’s (“Switchback”) management and are not predictions of actual performance. These                (“SEC”). If any of these risks materialize or Switchback’s or ChargePoint’s assumptions prove
forward-looking statements are provided for illustrative purposes only and are not intended to serve        incorrect, actual results could differ materially from the results implied by these forward-looking
as, and must not be relied on by any investor as a guarantee, an assurance, a prediction or a               statements. There may be additional risks that neither Switchback nor ChargePoint presently know
definitive statement of fact or probability. Actual events and circumstances are difficult or               or that Switchback and ChargePoint currently believe are immaterial that could also cause actual
impossible to predict and may differ from assumptions, and such differences may be material.                results to differ from those contained in the forward-looking statements. In addition, forward-looking
Many actual events and circumstances are beyond the control of ChargePoint and Switchback.                  statements reflect Switchback’s and ChargePoint’s expectations, plans or forecasts of future events
These forward-looking statements are subject to a number of risks and uncertainties, including              and views as of the date of this Presentation. Switchback and ChargePoint anticipate that
changes in domestic and foreign business, market, financial, political and legal conditions; risks          subsequent events and developments will cause Switchback’s and ChargePoint’s assessments to
relating to the uncertainty of the projected financial information with respect to ChargePoint; the         change. However, while Switchback and ChargePoint may elect to update these forward-looking
inability of the parties to successfully or timely consummate the potential business combination            statements at some point in the future, Switchback and ChargePoint specifically disclaim any
between ChargePoint and Switchback and related transactions (the “Proposed Business                         obligation to do so. These forward-looking statements should not be relied upon as representing
Combination”), including the risk that any required regulatory approvals are not obtained, are              Switchback’s and ChargePoint’s assessments as of any date subsequent to the date of this
delayed or are subject to unanticipated conditions that could adversely affect the combined                 Presentation. Accordingly, undue reliance should not be placed upon the forward-looking
company or the expected benefits of the Proposed Business Combination or that the approval of               statements. Neither ChargePoint, Switchback, nor any of their respective affiliates have any
the stockholders of Switchback or ChargePoint is not obtained; the failure to realize the anticipated       obligation to update this Presentation.
benefits of the Proposed Business Combination; risks related to the rollout of ChargePoint’s
                                                                                                            USE OF PROJECTIONS
business and the timing of expected business milestones; ChargePoint’s dependence on
                                                                                                            This Presentation contains projected financial information with respect to ChargePoint. Such
widespread acceptance and adoption of electric vehicles and increased installation of charging
                                                                                                            projected financial information constitutes forward-looking information and is for illustrative
stations; ChargePoint’s ability to maintain effective internal controls over financial reporting,
                                                                                                            purposes only and should not be relied upon as necessarily being indicative of future results. The
including the remediation of identified material weaknesses in internal control over financial
                                                                                                            assumptions and estimates underlying such financial forecast information are inherently uncertain
reporting relating to segregation of duties with respect to, and access controls to, ChargePoint’s
                                                                                                            and are subject to a wide variety of significant business, economic, competitive and other risks and
financial record keeping system, and ChargePoint’s accounting staffing levels; ChargePoint’s
                                                                                                            uncertainties that could cause actual results to differ materially from those contained in the
current dependence on sales of charging stations for most of its revenues; overall demand for
                                                                                                            prospective financial information. See “Forward-Looking Statements” paragraph above. Actual
electric vehicle charging and the potential for reduced demand if governmental rebates, tax credits
                                                                                                            results may differ materially from the results contemplated by the financial forecast information
and other financial incentives are reduced, modified or eliminated or governmental mandates to
                                                                                                            contained in this Presentation, and the inclusion of such information in this Presentation should not
increase the use of electric vehicles or decrease the use of vehicles powered by fossil fuels, either
                                                                                                            be regarded as a representation by any person that the results reflected in such forecasts will be
directly or indirectly through mandated limits on carbon emissions, are reduced, modified or
                                                                                                            achieved. Neither Switchback’s nor ChargePoint’s independent auditors have audited, reviewed,
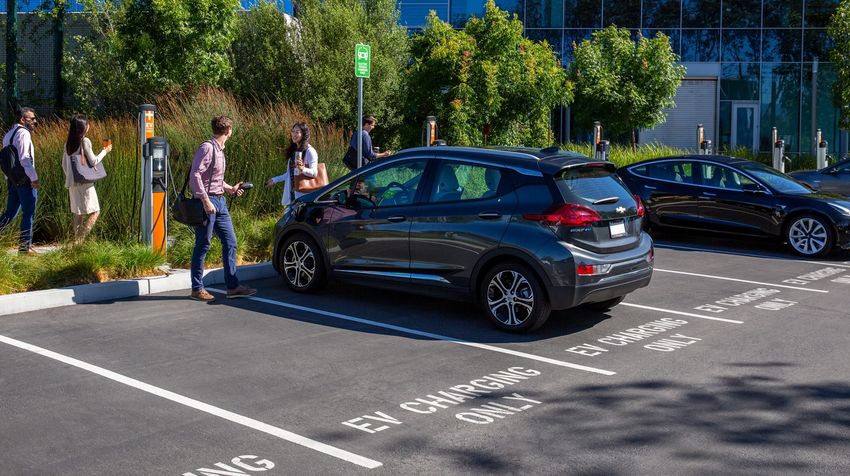
Driving the Electrification of Mobility - Switchback Energy
Disclaimer Cont’d
compiled or performed any procedures with respect to the projections for the purpose of their            evaluating projected operating results and trends in and in comparing ChargePoint’s financial
inclusion in this Presentation, and accordingly, neither of them expressed an opinion or provided        measures with other similar companies, many of which present similar non-GAAP financial
any other form of assurance with respect thereto for the purpose of this Presentation.                   measures to investors. Management does not consider these non-GAAP measures in isolation or
                                                                                                         as an alternative to financial measures determined in accordance with GAAP. The principal
IMPORTANT INFORMATION FOR INVESTORS AND SHAREHOLDERS
In connection with the Proposed Business Combination, Switchback will be required to file a              limitation of these non-GAAP financial measures is that they exclude significant expenses and
                                                                                                         income that are required by GAAP to be recorded in ChargePoint’s financial statements. In
registration statement (which will include a proxy statement/prospectus of Switchback) and other
relevant documents with the SEC. Stockholders and other interested persons are urged to read the         addition, they are subject to inherent limitations as they reflect the exercise of judgments by
                                                                                                         management about which expense and income are excluded or included in determining these non-
proxy statement/prospectus and any other relevant documents filed with the SEC when they
become available because they will contain important information about Switchback, ChargePoint           GAAP financial measures. In order to compensate for these limitations, management presents non-
                                                                                                         GAAP financial measures in connection with GAAP results.
and the Proposed Business Combination. Stockholders will be able to obtain a free copy of the
proxy statement/prospectus (when filed), as well as other filings containing information about         INDUSTRY AND MARKET DATA
Switchback, ChargePoint and the Proposed Business Combination, without charge, at the SEC’s            Although all information and opinions expressed in this Presentation, including market data and
website located at www.sec.gov.                                                                        other statistical information, were obtained from sources believed to be reliable and are included in
                                                                                                       good faith, ChargePoint and Switchback have not independently verified the information and make
PARTICIPANTS IN SOLICITATION                                                                           no representation or warranty, express or implied, as to its accuracy or completeness. Some data
Switchback, ChargePoint, and their respective directors and executive officers and other persons
                                                                                                       is also based on the good faith estimates of ChargePoint and Switchback, which are derived from
may be deemed to be participants in the solicitations of proxies from Switchback’s stockholders in     their respective reviews of internal sources as well as the independent sources described above.
respect of the Proposed Business Combination and the other matters set forth in the proxy
                                                                                                       This Presentation contains preliminary information only, is subject to change at any time and, is
statement/prospectus. Information regarding Switchback’s directors and executive officers is           not, and should not be assumed to be, complete or to constitute all the information necessary to
available under the heading “Directors, Executive Officers and Corporate Governance” in its Annual
                                                                                                       adequately make an informed decision regarding your engagement with ChargePoint and
Report on Form 10-K for the year ended December 31, 2019 filed with the SEC on March 30, 2020. Switchback.
Additional information regarding the participants in the proxy solicitation and a description of their
direct and indirect interests, by security holdings or otherwise, will be contained in the proxy       TRADEMARKS AND TRADE NAMES
statement/prospectus relating to the Proposed Business Combination when it becomes available.          ChargePoint and Switchback own or have rights to various trademarks, service marks and trade
                                                                                                       names that they use in connection with the operation of their respective businesses. This
FINANCIAL INFORMATION; NON-GAAP FINANCIAL MEASURES                                                     Presentation also contains trademarks, service marks and trade names of third parties, which are
The financial information and data contained in this Presentation is unaudited and does not            the property of their respective owners. The use or display of third parties’ trademarks, service
conform to Regulation S-X promulgated under the Securities Act of 1933, as amended.                    marks, trade names or products in this Presentation is not intended to, and does not imply, a
Accordingly, such information and data may not be included in, may be adjusted in or may be            relationship with ChargePoint or Switchback, or an endorsement or sponsorship by or of
presented differently in, any proxy statement/prospectus or registration statement to be filed by      ChargePoint or Switchback. Solely for convenience, the trademarks, service marks and trade
Switchback with the SEC. Some of the financial information and data contained in this                  names referred to in this Presentation may appear with the ®, TM or SM symbols, but such
Presentation, such as EBIT, EBITDA and EBITDA Margin, have not been prepared in accordance             references are not intended to indicate, in any way, that ChargePoint or Switchback will not assert,
with United States generally accepted accounting principles (“GAAP”). Switchback and                   to the fullest extent under applicable law, their rights or the right of the applicable licensor to these
ChargePoint believe these non-GAAP measures of financial results provide useful information to         trademarks, service marks and trade names.
management and investors regarding certain financial and business trends relating to
ChargePoint’s financial condition and results of operations. ChargePoint’s management uses these
non-GAAP measures for trend analyses, for purposes of determining management incentive
compensation and for budgeting and planning purposes. Switchback and ChargePoint believe that
the use of these non-GAAP financial measures provides an additional tool for investors to use in
                                                                                                                                                                                                               3
Driving the Electrification of Mobility - Switchback Energy
Transaction Summary
Summary of Proposed Transaction                                                                                      Capital Structure                                                                Leadership
+ Founded in 2007, ChargePoint has built one of the world’s                                                          + ChargePoint shareholders rolling 100%
  leading electric vehicle (EV) charging networks                                                                      of their equity
       – Delivers a fully integrated EV charging solution, with a                                                    + >$450M proceeds net of debt
                                                                                                                                                                                                                         Pasquale Romano
         comprehensive portfolio of hardware, software and services                                                    elimination and transaction fees to fund
                                                                                                                                                                                                                         Director
                                                                                                                       growth (assuming no redemptions)                                                                  President & CEO
+ ChargePoint to be capitalized with cash necessary to bolster
  positions in existing markets and to fund European growth,                                                         + PIPE size of $225M1
  ChargePoint as a Service™ and Hardware and Software R&D
+ Switchback (NYSE:SBE) has $317M of cash in trust account                                                           Valuation                                                                                           Rex Jackson
                                                                                                                                                                                                                         CFO
                                                                                                                     + Enterprise value of $2.4B
+ Transaction expected to fully fund business model through
  cash flow positive                                                                                                 + Attractive entry multiple relative
                                                                                                                       to EV ecosystem

                                                                                                                                                                                                                         Scott McNeill
                                                                                                                                                                                                                         Director
       Switchback has identified ChargePoint, the #1 brand in EV charging, as the company                                                                                                                                CEO & CFO
        best positioned to continue leading the growth in charging infrastructure required by
                              the world’s transition to electric mobility
                                                                                                                                                                                                                         Jim Mutrie
                                                                                                                                                                                                                         Director
                                                                                                                                                                                                                         CCO & GC

(1) Together, Scott McNeill and Jim Mutrie will purchase $2.0M of stock in the PIPE on the same terms as the PIPE investors, in addition to the $2.0M of stock purchased on the same terms as the public in SBE’s IPO.
© 2020 ChargePoint, Inc.                                                                                                                                                                                                                   4
Driving the Electrification of Mobility - Switchback Energy
Meet the New Fueling Network

                           Site Host: Fortune 10 Workplace

© 2020 ChargePoint, Inc.
Driving the Electrification of Mobility - Switchback Energy
VISION
                           Move All People and Goods on Electric Power
                           INVESTMENT OPPORTUNITY

                           The Index for the Electrification of Mobility

Passenger

          Fleet                                                            …and more.

© 2020 ChargePoint, Inc.                                                                6
Driving the Electrification of Mobility - Switchback Energy
Executive Summary
                                The Trend
                                The electrification of mobility is
                                undisputed, with consumers and fleets
                                adopting at record rates

                                The Market
                                Our addressable market is massive…
                                every place vehicles park, in North
                                America and Europe

                                The Product
                                We sell charging software, stations and
                                services. Software attach = 100%. We do
                                not monetize energy or driver utilization.
                                The Business Model
                                Selling to businesses makes for capital-
                                light growth. We expect significant
                                revenue and margin expansion ahead.

                                                                             7
Site © 2020Public
     Host:  ChargePoint,
                  LibraryInc.
Driving the Electrification of Mobility - Switchback Energy
Market   Model   Moats   Growth

Investment Highlights
    Massive Total                                             Winning                           Strong                          Strong Capital-Light
    Addressable Market                                        Business Model                    Competitive Moats               Growth
+ EVs projected to be 9.9%                                  + As EV penetration grows,         + Significant level of capital   + Continued EV adoption
  of new vehicles sold in                                     we grow. Monetization not          raised to date has powered       across segments
  2025 and 29.2% in 2030                                      tied to energy or utilization.     differentiation (R&D and go    + Minimal capex required
  in the U.S. and Europe                                    + Vertically integrated,             to market engine)                to scale
  (compared to 2.6% in                                        complete portfolio of
  2019)1                                                                                                                        + Recurring revenue
                                                              networked solutions
                                                                                                                                  streams provide strong
+ EV charging infrastructure                                + Platform technologies                                               financial visibility
  investment projected to be                                  provide major advantages         + >4K customers; high
  ~$190B by 20302                                                                                                               + Company revenue grew
                                                              in fleet applications              switching costs                  60% YOY in 2019 and
                                                                                               + Deep ecosystem                   projected at 60% CAGR
                                                                                                 integrations, open network       from 2021 to 2026
                                                                                                 with broad reach

1   Source: BloombergNEF Electric Vehicle Outlook 2020 (Passenger Vehicles)
2   Source: BloombergNEF Electric Vehicle Outlook 2020
© 2020 ChargePoint, Inc.                                                                                                                                         8
Driving the Electrification of Mobility - Switchback Energy
Market   Model   Moats   Growth

Fueling Fundamentals

At Home, At Work and Around Town
   PREFERENCE
   Large Battery EVs
   LOCATION
   Where Drivers Live, Work
   and Play
   PARADIGM
   Mostly Top Up While Parked
   MONETIZATION
   Businesses (Site Hosts) in
   Control (set price/free)

                                                          CHARGEPOINT REVENUE POTENTIAL OF ELECTRIFICATION =
                                                          Total Vehicles x EV % x Port Attach % x Market Share x ASP

                                                          CHARGEPOINT RECURRING REVENUE =
                                                          Installed Base x Annual Subscriptions

Site Host: Apartment Complex, 2 Ports of Charging Shown

© 2020 ChargePoint, Inc.                                                                                                            9
Driving the Electrification of Mobility - Switchback Energy
Market   Model   Moats   Growth

Major Markets Committed to Electrification
                       Technology      Automotive           Energy          Oil & Gas

                           TNCs

                                    Essential Charging Platform Partner
                                                                          Fleet Systems

© 2020 ChargePoint, Inc.                                                                                 10
Market   Model      Moats      Growth

ChargePoint Growth Directly Proportional
to EV Penetration
     Passenger                                                                                                                                Commercial
      EV Sales                                                                                                                                Ports

                                                                                                                                   10% EVs

                                                                                                           ChargePoint Estimated
                                                                                                           $1B Revenue at 3%
                                                                                                           EV Penetration

                                                                                                                                                      Additional Tailwinds
                                                                                                                                                      + Fossil fuel bans
                                                                                                                                                      + Transit electrification dates
                                                                                                   COVID-19 Impact                                    + Incentive programs
                                                                                                                                                      + All major auto OEM brands
                                                                                                                                                        committed to electric
                                                                                                                                                      + Further EV cost reductions
                                                                                                                                                        with advances in battery
                                                                                                                                                        technology

                                                                              ChargePoint Annual
                                                                              NA Port Sales

Source: Historical EV sales from InsideEVs and Baum. Future EV sales projections from BNEF.
© 2020 ChargePoint, Inc.                                                                                                                                                         11
Market   Model   Moats   Growth

Corporate Timeline
                                                                                                                                                 114K Ports

Positioned to Continue to Scale
                                                                                                                                                 (3.4M EVs)

                                                                                                   36K Ports
                                                                                                  (1.2M EVs)

                                       1.9K Ports
                                      (116K EVs)

                    2007–2012                                              2013–2016                                            2017–20201                    Forward
     Commercial                                        Commercial                                                  Commercial                                 + Accelerate new products
     - Workplace                                       - Workplace                                                 - Workplace
     - Retail & Hospitality                            - Retail & Hospitality                                      - Retail & Hospitality                     + Invest incrementally in
                                                       - Commercial Properties                                     - Commercial Properties                      Marketing & Sales
                                                       - Education                                                 - Education                                + Fund more CPaaS
                                                       - Fueling & Convenience                                     - Fueling & Convenience
                                                                                                                                                                (Commercial and Fleet)
                                                       Fleet                                                       Fleet                                      + Expand European footprint
                                                       - Sales Service & Motorpool                                 - Sales Service & Motorpool
                                                                                                                   - Delivery & Logistics                     + Enable strategic acquisitions
                                                                                                                   - Shared Mobility
                                                       Residential                                                 Residential
                                                       - Single Family                                             - Single Family
                                                       - Multi Family                                              - Multi Family
1   EV Source: European Alternative Fuels Observatory, North America and Europe. Ports and EVs sold through Dec 2019.
© 2020 ChargePoint, Inc.                                                                                                                                                                        12
Market   Model     Moats   Growth

 Business Model and Investment Level Set Us Apart

                                  Charging Is Essential
                                  Businesses and fleets are investing in charging solutions

                                  ChargePoint Capital Is Focused on Winning
                                  Free of monetizing energy or drivers, our capital is focused on
                                  + Research & Development: Complete solutions, all use cases;
                                     investment keeps us steps ahead
                                  + Marketing & Sales Engine: Enables us to reach site hosts first
                                  + Policy: Ensures competition, innovation, choice

                                  Network Effects Are Significant
                                  A superior experience makes us preferred by site hosts and drivers
                                  + Hosts expand as adoption grows
                                  + Strong channel established
                                  + Drivers rely on us as the largest and highest quality network
Site Host: Fortune 10 Workplace
© 2020 ChargePoint, Inc.
Market     Model       Moats    Growth

3 Lines of Business

We Sell Hardware, Recurring Software and Services
Commercial Products                                                 Traditional CapEx Purchase           or     OpEx Purchase

                                                                                                                           1   3    5

                 Charging Stations   Software as a Service (SaaS)   Assure™ Annual Subscription          ChargePoint as a Service™ (Bundles SaaS,
                                         Annual Subscriptions         (Parts & Labor Warranty)           Charging Stations and Assure Subscription)

Fleet Products

                                                  SaaS Annual        SaaS Vehicle Scheduling      SaaS Energy Management       Professional Services        Assure Pro Annual
                           Charging Stations
                                                  Subscriptions       & Fueling Optimization           Subscriptions              for Design/Build          Subscription (Parts
                                                                          Subscriptions                                            & Construction           & Labor Warranty)

Residential Products                                                          Single Family        and          Multi Family

                                                          ChargePoint® Home Charger                                                Multi Family Charging Solution
                                                          + Sold with Lifetime Subscription                                        + Monthly Fee Billed to Tenant
                                                          + Utility Plans for Managing Home Use                                    + Additional Charges for Power Consumed
                                                                                                                                     (Property Owner Sets Pricing)

© 2020 ChargePoint, Inc.                                                                                                                                                          14
Market    Model    Moats    Growth

Site Hosts Buy to Reach Business Goals
Commercial                      Workplace & Commercial Properties | Education | Fueling & Convenience          …and Drivers Rely on Us
                                Healthcare | Hospitality & Retail | Parking                                    + Easily find, view and access
                                                                                                                 charging stations
                                  Reduce expenses
                                                                                                               + Roam across networks

                                                                                               62%
                                  Generate direct and indirect income
                                                                                                               + View all activity and cost (for both
                                  Attract employees, tenants, customers and visitors
                                                                                                                 at home and public charging) in
                                  Achieve ESG objectives
                                                                                                of Fortune       one place
                                                                                               Top 50 Use
Fleet                           Delivery & Logistics | Sales Service & Motorpool               ChargePoint
                                Shared Mobility
                                  Manage operating costs (fueling and maintenance)
                                  Meet government mandates and regulations
                                  Minimize risk and future-proof operations
                                  Achieve sustainability goals

Residential                     Single Family | Multi Family
                                  Increase convenience with app-controlled, at-home charging (Single Family)
                                  Gain control and visibility with software controlled smart charging
                                  Reduce cost by charging at off-peak hours
                                  Achieve sustainability goals

Fortune Top 50 Companies 2018
© 2020 ChargePoint, Inc.                                                                                                                                15
Market    Model    Moats    Growth

Product Portfolio Leverage

One Portfolio Serves Many Geos and Segments
                                           Commercial Business

     [                 +     +         ]       North America
                                               + Proven model, de facto leader
                                               + Expected gross margin in the 40s
                                                                                                  Europe
                                                                                                  + Large addressable market
                                                                                                  + Billings growth > North America as
                                                                                                    we capture share
      One comprehensive portfolio                                                                 + Global product in 2021 expected to
                                                                                                    drive up margin
      deployed globally, with modest                                                              + Leasing Company path to market
      regional variations as needed
                                           Fleet Business
                                               North America and Europe
                                               + Largest contributor to growth
                                               + Stabilization of new products expected to yield improved gross margin
                                               + Excess commercial capacity available to fleet (off-hours charging)

                                           Residential Business
                                               North America                                      Europe
                                               + Scaling Multi Family and direct-to-consumer      + Leasing Company path to market
                                                 channels                                           includes home and work charging
                                               + Utilities expanding their residential programs     solutions
                                               + Common product powers Fleet and
                                                 residential
© 2020 ChargePoint, Inc.                                                                                                                 16
Market   Model   Moats     Growth

Our Winning Formula =
              Hardware            +                   Software              +               Services

 + Upfront payment for initial purchase      + Recurring SaaS model, 100% attach to   + Parts & labor warranty
 + High land-and-expand pattern consistent     hardware                               + Recurring model
   with electric vehicle penetration         + Revenue recognized ratably during      + Revenue recognized ratably during
 + Long term expected life                     contract periods                         contract periods
                                             + Minimums with annual renewal

© 2020 ChargePoint, Inc.                                                                                                        17
Market   Model    Moats   Growth

Complete Hardware Portfolio Powered by Software
                               Comprehensive Hardware Portfolio Delivers
                               + Solutions for every use case, all vehicle types and brands
                               + High efficiency in power and footprint
                               + Modular, scalable, secure architecture designed for
                                 serviceability
                               + Unparalleled quality; advanced testing (vehicle,
                                 functional, climate, environment) for long-term reliability
                               + Options for site hosts to use custom branding

                               Software Enables
                               +   Control of who can use stations and when
                               +   All vehicles to get charged on time
                               +   Multiple vehicles to share power
                               +   Drivers to get in line when ports are occupied
                               +   Proactive and remote diagnosis
                               +   Power management to avoid demand charges

© 2020 ChargePoint, Inc.                                                                       18
Market   Model   Moats   Growth

Already Integrated to the Ecosystem
 Automotive Platforms      Consumer Platforms                         Fleet Platforms

                                                “Alexa, ask
                                                ChargePoint if my
                                                car is plugged in.”

                                                                      Roaming Integrations with Other
                                                                      Charging Networks

© 2020 ChargePoint, Inc.                                                                                       19
Market   Model   Moats   Growth

Thousands of Brands Choose ChargePoint

Select Customers Participating in the New Fueling Network
Commercial                                                 Fleet                       Residential
Workplace & Commercial Properties   Healthcare             Delivery & Logistics        Multi Family

                                    Hospitality & Retail

                                                           Sales Service & Motorpool

Education
                                                                                               Go-to-Market Partners

                                    Parking

Fueling & Convenience                                      Shared Mobility

© 2020 ChargePoint, Inc.                                                                                                     20
One Network, Many Branding Opportunities

© 2020 ChargePoint, Inc.                   21
Market   Model   Moats      Growth

Lifetime Value

Proven Account Expansion
Fortune 50 Company
                                                                                                                      Top 25 Customers
Annual Spend                                                                  $3.1M
                                                                               $3,149      5.7X
                                                                                           Cumulative
                                                                 $2.3M
                                                                  $2,276                   Spend                                         14.0X
                                                                                                                                         Cumulative Spend
                                                   $1.8M
                                                    $1,779

                                      $1.5M
                                      $1,548
                                       $1,548

                                       FY2017        FY2018       FY2019        FY2020

Fortune 50 Company
Annual Spend
                                                                                           27.8X
                                                                              $3.4M
                                                                               $3,429
                                                                                           Cumulative
                                                                                           Spend
                                                                 $1.6M
                                                                  $1,579

                                      $0.2M        $1.3M
                                                    $1,252
                                        $234                                                                         Quarter                                                     Quarter
                                       FY2017        FY2018       FY2019        FY2020
Fortune 500 Company                                                                                                    1                                                           12
Annual Spend                                                                               24.1X
                                                                              $506K
                                                                                $506       Cumulative
                                                                                           Spend
                                                                                                                             Customer expansion reflects ongoing
                                                                 $108K
                                                                   $108
                                                                                                                             software and warranty subscriptions as
                                       $33K        $146K
                                                     $146
                                        $33                                                                                  well as increased hardware
                                       FY2017        FY2018       FY2019        FY2020
                                     Year 1        Year 2        Year 3        Year 4                                        purchases as EV penetration grows

Source: Management Data. Cumulative spend expansion rates calculated by dividing cumulative billings (FY2017 – FY2020) by FY2017 billings.
© 2020 ChargePoint, Inc.                                                                                                                                                                22
Market   Model       Moats   Growth

Revenue Ratio
                                                             ~1:1 Upfront and Recurring Revenue

                                                                                          13%

                                                                                                          Recurring
                                                                                          36%

                                                                                          51%             Upfront
                      Illustrative Unit Economics:
                      CT4000 Dual-Port Station
                      with Software and Assure

Source: Management data. Actual station lifetime can vary.
© 2020 ChargePoint, Inc.                                                                                                  23
Market          Model   Moats   Growth

Winning North America, Expanding in Europe
                      Market Share
               Networked L2 Charging*
         73%

                    7X
                    Closest
                    Competitor
                                                                                 #1 Brand in North America, A Blueprint for Growth
                                                                                + De facto North America leadership in all-purpose AC charging
                   10%         8%                                                    – Operating across all verticals
                                         4%        3%         2%                     – Integrated into where people live, work, play
                                                                                + Operating in 16 European markets
        ChargePoint                        SemaConnect                               – Partnerships with energy retailers and leasing solution providers
        Blink                              EV Connect
                                                                                     – 133,868 ports accessible via roaming integrations
        Shell                              Volta

*Refers to connected charging of certain specifications (208–240 Volt, 40 Amp circuit. 6.2 – 7.6 kW), 4-5 hours to charge a 100mi range battery, typically serving 3+ drivers per day
Source: AFDC (North America). Excludes single-family residential charging ports.
© 2020 ChargePoint, Inc.                                                                                                                                                                                    24
Unparalleled Leadership Team

 PasqualeRomano
         Romano        RexJackson
                       Rex Jackson            Colleen Jansen Michael Hughes
                                                                Michael Hughes        Christopher
                                                                                        Chris Burghardt     Bill Loewenthal     Eric Sidle         Lawrence
                                                                                                                                                      Lawrence Lee
Pasquale
 President & CEO        Finance, HR, &
                       CFO                    CMO                 Commercial
                                                                   CRO       &         Burghardt
                                                                                        MD, Europe          SVP, Product        SVP, Engineering     Lee
                                                                                                                                                      SVP, Operations
                              IT                                    Revenue              Europe                                                    Operations &
                                                                                                                                                       & Services
                                                                                                                                                    Services

 + Seasoned leadership team with years of tech and category skills
 + 750+ employees including 40% technical staff
 + Diversified talent base with operations in US, NL, UK, DE, MX, CN

Board of               Roxanne Bowman
                       Operating Executive,
                                               Bruce Chizen
                                               Former CEO, Adobe
                                                                               Axel Harries
                                                                               Head of CASE/EVA,
                                                                                                      Jeffrey Harris
                                                                                                      Venture Partner,
                                                                                                                                Mark Leschly
                                                                                                                                Managing Partner, Rho Capital
Directors              NMS Capital             Senior Advisor, Permira Funds   Daimler AG             Quantum Energy Partners   Partners, Rho Ventures

                       Michael Linse           Richard Lowenthal               Pasquale Romano        Neil Suslak               Rick Wagoner
                       Managing Director,      Co-Founder, ChargePoint         President and CEO,     Managing Partner,         Former Chairman and CEO,
                       Linse Capital                                           ChargePoint            Braemar Energy Ventures   General Motors

© 2020 ChargePoint, Inc.                                                                                                                                            25
Financial Models

                           Site Host: Port of Stockton, With Yard Tractor Shown

© 2020 ChargePoint, Inc.
Scaling With EV Penetration
                     ChargePoint Ports Shipped                                                                  $M
                                                                                                                                       ChargePoint Revenue
                            (Annual)

                            COVID-19 Impact
                                                                                                                                     COVID-19 Impact

Notes
+ Port counts include Multi Family home charging (part of Commercial business) ports but exclude single family home charging ports
+ ChargePoint FY runs 2/1-1/31. CY reflected for simplicity; financials do not reflect CY adjustments.
+ Historical numbers are unaudited and subject to change
© 2020 ChargePoint, Inc.                                                                                                                                     27
Revenue Diversity
  $M

                       By Vertical                                                                By Type              By Geography

                NA Commercial                                                           Networked Charging Stations   North America
                EU Commercial                                                           Subscriptions & Support       Europe
                Global Fleet & Other                                                    Other Services

Note: ChargePoint FY runs 2/1-1/31. CY reflected for simplicity; financials do not reflect CY adjustments.
© 2020 ChargePoint, Inc.                                                                                                              28
Gross Margin Improves as Product Releases
Stabilize and Software Revenue Grows

                                                                             Actuals
                                                                           Q1 ’20: 20%
                                                                           Q2 ’20: 24%

Notes
+ Historical numbers are based on GAAP. Forecast does not include stock-based compensation.
+ ChargePoint FY runs 2/1-1/31. CY reflected for simplicity; financials do not reflect CY adjustments.
+ Historical numbers are unaudited and subject to change.
© 2020 ChargePoint, Inc.                                                                                 29
Substantial OpEx Leverage Acceleration
                                                                                         Operating Expenses

                                                    $M

                                                                                             $140

                                                                                                                  Temporary COVID Cost Reductions*

                                                                                                              OpEx Incl. Cost Reductions
                                                                                                              OpEx Excl. Cost Reductions

Notes
+ *Temporary COVID cost reductions include salary cuts and bonus elimination.
+ Historical numbers are based on GAAP. Forecast does not include stock-based compensation.
+ ChargePoint FY runs 2/1-1/31. CY reflected for simplicity; financials do not reflect CY adjustments.
+ Historical numbers are unaudited and subject to change.

© 2020 ChargePoint, Inc.                                                                                                                             30
Long-term Financial Summary
Strong Growth and Long-term Profitability

 Fiscal Year                 FY21        FY22        FY23        FY24        FY25        FY26     FY27
 Approximate Calendar Year   2020        2021        2022        2023        2024        2025     2026

                                                                                                           ~60% revenue CAGR
 Revenue                      $135        $198        $346        $602        $984       $1,427   $2,069
                                                                                                           between 2021 and 2026
 YoY Growth                                 46%         75%         74%         63%         45%      45%

 Gross Profit                  $33         $62        $124        $225        $400        $591     $878

 Gross Margin %                 24%         31%         36%         37%         41%         41%      42%

 Total Operating Expenses     $140        $192        $226        $268        $321        $417     $542

                                                                                                           Contemplated transaction
 Adjusted EBITDA              $(97)       $(121)      $(93)       $(36)        $86        $178     $340
                                                                                                           expected to fully fund
                                                                                                           business model through cash
 Adjusted EBITDA Margin %           NM          NM          NM          NM          9%      12%      16%
                                                                                                           flow positive

Note: Dollars in millions
© 2020 ChargePoint, Inc.                                                                                                                 31
Transaction Summary

                           Site Host: Dealership, Fast Charging in Europe

© 2020 ChargePoint, Inc.                                                                          32
Detailed Transaction Overview
$2.4B Enterprise Value | $225M PIPE
                                                                                                                                                                                                            Sources and Uses
Transaction Highlights
                                                                                                                                         Sources                                                               $M          Uses                                                                  $M

                                       + Switchback has ~$317M in cash held in the                                                       SBE Shares (1)                                                      $ 2,450       Equity Consideration to ChargePoint Shareholders                    $ 2,450

    Cash Sources                         trust account                                                                                   SBE Cash in Trust                                                       317       Cash to Balance Sheet                                                   458

                                                                                                                                         PIPE                                                                    225       Debt Repayment                                                             35
                                       + PIPE size of $225M
                                                                                                                                                                                                                           Transaction Fees                                                           49
                                                                                                                                         Total Sources                                                       $ 2,992       Total Uses                                                          $ 2,992
                                       + $2.4B EV with strong balance sheet
         Valuation
                                       + Attractive valuation versus EV ecosystem                                                                                                                      Pro Forma Capitalization
                                                                                                                                         Cash and Cash Equivalents (from de-SPAC)                                                                                                                $ 458
                                       + ~$650M in cash on balance sheet (assuming                                                       (+) ChargePoint Cash on Balance Sheet                                                                                                                     190
  Capital Structure
                                         no redemptions) to fund growth and expansion                                                    Net Cash                                                                                                                                                $ 648

                                                                                                                                         Equity Value                                                                                                                                          $ 3,049
                                                                        PIPE Investors                  Founders' Shares                 Enterprise Value                                                                                                                                      $ 2,401
                                                                            7.4 %                            2.0 %
                                                                      SBE Investors
                                                                        10.3 %                                                                                                                           Pro Forma Ownership
                                                                                                                                                                                                                                                                                  Shares
Pro Forma Ownership                                                                                                                                  Ownership Breakdown                                                                                                           (M)            %

at $10.00 / Share (2)                                                                                                                    Existing ChargePoint Shareholders (1)

                                                                                                                                         SBE Investors
                                                                                                                                                                                                                                                                                    245.0

                                                                                                                                                                                                                                                                                      31.4
                                                                                                                                                                                                                                                                                                80.4 %

                                                                                                                                                                                                                                                                                                10.3
                                                                                      Existing ChargePoint
                                                                                          Shareholders                                   PIPE Investors                                                                                                                               22.5        7.4
                                                                                             80.4 %
                                                                                                                                         Founders' Shares (3)                                                                                                                          6.0        2.0
                                                                                                                                         Equity Ownership                                                                                                                           304.9      100.0 %

(1) Equity value to ChargePoint’s existing shareholders is calculated as 245.0 million Switchback shares, using a $10.00 pro forma share price, on a fully diluted basis (excluding unvested options and restricted stock, and assuming a net share settlement calculation for ChargePoint’s outstanding
    warrants and vested options). Certain ChargePoint equityholders also will receive an earnout at the closing of the transaction for shares that will vest upon the occurrence of certain triggers, including three separate share price achievements (9.0 million shares would be payable based on
    achievement of each of $15.00, $20.00, and $30.00 weighted average closing sale prices over a period of at least 10 days within any 20 consecutive trading day period in the 5 years following closing). At closing, Switchback will issue approximately 211.8 million shares and will assume (a)
    warrants to acquire approximately 39.2 million shares of its common stock, with a weighted average purchase price of $6.74, (b) approximately 21.6 million vested options, with a weighted average exercise price of $0.61 and (c) approximately 18.2 million unvested equity awards, with a weighted
    average exercise price of $0.72.
(2) Pro forma ownership structure based on PIPE of $225 million, assuming no redemptions. Excludes public and private warrants and ChargePoint unvested equity awards and restricted stock.
(3) Excludes 900 thousand founders’ shares subject to earnout based on achievement of $12.00 price per share over a period of at least 10 days within any 20 consecutive trading day period within 5 years of the closing of the transaction.

© 2020 ChargePoint, Inc.                                                                                                                                                                                                                                                                              33
Public Comparable Universe
                                                        EV Ecosystem

                                                                               + Pure-play EV exposure
                                                                               + CapEx heavy business model

                                                  Software Powered Solutions

                                                                               + Ecosystem player with defensible moats
                                                                               + Recurring revenue streams provide visibility

                                                      Energy Technology

                                                                               + ESG-friendly category
                                                                               + Attracts premium valuation

$40B+ Current Market Value of Recent Select SPAC Transactions1

(1) Market data as of 21-Sep-2020.

© 2020 ChargePoint, Inc.                                                                                                        34
Discounted Future Enterprise Value
Transaction Expected to Fully Fund to EBITDA Positive

                               Future             Discounted       Post-Money

                               $ 18,622

                                ~460 %
                            Midpoint Premium

                                                   $ 9,258

                                $ 8,276            ~180 %
                                               Midpoint Premium

                                                                      $ 2,400
                                                   $ 4,115

                              4.0x - 9.0x         Discounted      Enterprise Value
                            2026E Revenue      5 Periods at 15%

Note: Dollars in millions
© 2020 ChargePoint, Inc.                                                             35
Operational Benchmarking
                                                                                                                                 CY 2021E Financials
  EV Ecosystem
                                                                                                                        54 %                            51 %
                                                                                                                                                                  Median: 39 %
                    Revenue Growth
Software Powered                         45 %                        45 %
    Solutions                                                                                   39 %
Energy Technology
                                                                                                                                                                    23 %

                                                                                                                                         8%

                                        2025E                      2026E                        Tesla                  Peloton        Alarm.com        Enphase    SolarEdge

                                                                                                                                         66 %
                                                                                                                                                                  Median: 38 %
                    Gross Margin

                                         41 %                        42 %                                               43 %
                                                                                                                                                         38 %        33 %
                                                                                                 21 %

                                        2025E                       2026E                       Tesla                  Peloton         Alarm.com        Enphase    SolarEdge

                                                                                                                                                                  Median: 20 %
                    EBITDA Margin

                                                                                                                                                         26 %
                                                                                                                                         20 %                        21 %
                                                                     16 %                        17 %
                                         12 %
                                                                                                                         8%

                                        2025E                       2026E                       Tesla                  Peloton         Alarm.com       Enphase     SolarEdge

   © 2020 ChargePoint, Inc.          Source: Bloomberg, CapIQ and company disclosures; market data as of 21-Sep-2020                                                             36
Valuation Benchmarking                                                     1
                                                                                                                                                 CY 2021E Financials
  EV Ecosystem
                                                                                                          11.8 x
Software Powered                                                                                                                                                                  Median: 6.1 x
                     EV / Revenue
    Solutions
                                                                                                                                                                         8.1 x
Energy Technology                                                                                                                       6.1 x
                                                                                                                                                         4.5 x                       5.3 x

                                               1.7 x
                                                                             1.2 x

                                              2025E                        2026E                          Tesla                        Peloton        Alarm.com        Enphase    SolarEdge
                    EV / Revenue / Growth

                                                                                                                                                                                 Median: 0.28 x
                                                                                                                                                        0.60 x
                                                                                                         0.42 x
                                                                                                                                                                        0.24 x      0.28 x
                                                                                                                                       0.17 x
                                              0.05 x                        0.04 x

                                            2024-25E                     2025-26E                        Tesla                         Peloton        Alarm.com        Enphase    SolarEdge
                                                                                                         69.6 x
                                                                                                                                                                                 Median: 28.1 x
                    EV / EBITDA

                                                                                                                                                                        31.3 x
                                                                                                                                                       23.0 x                       24.9 x
                                              13.5 x
                                                                            7.1 x
                                                                                                                                        NM

                                              2025E                        2026E                         Tesla                         Peloton       Alarm.com         Enphase    SolarEdge

   © 2020 ChargePoint, Inc.                 Source: Bloomberg, CapIQ and company disclosures; market data as of 21-Sep-2020                                                                       37
                                            Note: Growth adjusted multiples reflect 2020E – 2021E financials unless noted otherwise.
                                            (1) Based on ChargePoint enterprise value of $2.4B
Switchback Investment Thesis

                                                      Criteria

                                                      High Growth

     Objective as energy specialists with deep        Dominant Market Share
     industry expertise to partner with a leading
     disruptive technology company, to fuel the
     company’s growth strategy and offer attractive   Megatrend Industry Tailwinds
     risk-adjusted returns

                                                      Validated Valuation Supported
                                                      by Operating Business

© 2020 ChargePoint, Inc.                                                              38
Early Market, Large Market
                           Leading Share
                           Attractive Model, Recurring
                           Revenue, Margin Expansion
                           Continued Capital-light
                           Growth Ahead

© 2020 ChargePoint, Inc.                                 39
Thank You
For further information, please contact

                           Rex Jackson                   Scott McNeill
                           CFO                           Director
                           rex.jackson@chargepoint.com   CEO & CFO
                                                         smcneill@switchback-energy.com

© 2020 ChargePoint, Inc.                                                                  40
Appendix

© 2020 ChargePoint, Inc.   41
Unaudited GAAP Income Statement
($ in thousands)
                                                                        Year Ended January 31,
                                                                                2020

                               Revenues                                 $             147,007
                               Cost of Revenue                                        127,696
                               Gross Profit                                            19,311

                               Operating expenses
                                  Research and development                             69,301
                                  Sales and marketing                                  56,862
                                  General and administrative                           25,411
                                             Total operating expenses                 151,574

                               Loss from operations                                   (132,263)
                               Interest income                                           3,268
                               Interest expense                                         (3,544)
                               Other income (expense), net                                (582)
                               Net loss before income taxes                           (133,121)

                               Provision for income taxes                                  188
                               Net loss                                 $             (133,309)

Numbers are unaudited and subject to change.
© 2020 ChargePoint, Inc.                                                                          42
Unaudited GAAP Balance Sheet
($ in thousands)                                                                                                                                                 As of January 31,
                                                                                                                                                                       2020
                                      Assets
                                      Current assets:
                                         Cash and cash equivalents                                                                                               $         120,190
                                         Accounts receivable, net                                                                                                           40,443
                                         Inventory                                                                                                                          22,619
                                         Prepaid expenses and other current assets                                                                                           6,902
                                                   Total current assets                                                                                                    190,154
                                      Property and equipment, net                                                                                                           27,941
                                      Operating lease right-of-use assets                                                                                                   10,269
                                      Goodwill                                                                                                                               1,215
                                      Other assets                                                                                                                           4,462
                                                   Total assets                                                                                                  $         234,041

                                      Liabilities, Convertible Preferred Stock and Stockholders' Deficit
                                      Current liabilities:
                                         Accounts payable                                                                                                        $          21,372
                                         Accrued liabilities                                                                                                                37,659
                                         Deferred revenue - short term                                                                                                      31,462
                                                     Total current liabilities                                                                                              90,493
                                         Deferred revenue - long term                                                                                                       37,966
                                         Term debt - long term                                                                                                              34,261
                                         Operating lease liabilities                                                                                                         8,230
                                         Other long term liabilities                                                                                                         1,838
                                                     Total liabilities                                                                                                     172,788

                                      Convertible preferred stock: $0.0001 par value; 163,384,703 shares authorized; 161,131,049 shares issued and outstanding             520,364
                                      Stockholders' deficit:
                                         Common stock: $0.0001 par value; 241,000,000 shares authorized; 11,958,349 shares issued and outstanding                                1
                                         Additional paid-in capital                                                                                                         19,779
                                         Accumulated deficit                                                                                                              (478,891)
                                                   Total stockholders' deficit                                                                                            (459,111)
                                                           Total liabilities, convertible preferred stock and stockholders' deficit                              $         234,041

Numbers are unaudited and subject to change.
© 2020 ChargePoint, Inc.                                                                                                                                                              43
Unaudited GAAP Cash Flow Statement
($ in thousands)

                                                                                                                Year Ended January 31,
                                                                                                                        2020
                               Cash flows from operating activities
                               Net loss                                                                         $             (133,309)
                               Adjustments to reconcile net loss to net cash                                                    14,571
                               Changes in operating assets and liabilities                                                      30,828
                                     Net cash used in operating activities                                                     (87,910)

                               Cash flows from investing activities
                                   Net cash used in investing activities                                                       (14,868)

                               Cash flows from financing activities
                                   Net cash provided by financing activities                                                   17,158

                               Effect of exchange rate changes on cash, cash equivalents, and restricted cash                     112

                                    Net increase (decrease) in cash, cash equivalents, and restricted cash                    (85,508)
                               Cash, cash equivalents, and restricted cash at beginning of period                             205,698
                               Cash, cash equivalents, and restricted cash at end of period                     $             120,190

Numbers are unaudited and subject to change.
© 2020 ChargePoint, Inc.                                                                                                                  44
Valuation Benchmarking
                                                          1
                                                                                                                                      CY 2024E Financials
   Recent EV
Ecosystem SPACs

                                                                             8.7 x
                                                                                                                                                                                           Median: 3.0 x
                  EV / Revenue

                                                                                                   5.8 x

                                                                                                                         3.6 x
                                                                                                                                              3.0 x
                                  1.7 x                1.2 x                                                                                                         1.6 x      0.8 x            0.4 x

                                 2025E                2026E                Luminar              Velodyne               Hyliion                Nikola                 Canoo    Lordstown          Fisker

                                                                            45.6 x
                                                                                                                                                                                          Median: 12.7 x
                  EV / EBITDA

                                                                                                  28.9 x                26.5 x

                                 13.5 x                                                                                                      12.7 x                  11.9 x
                                                       7.1 x
                                                                                                                                                                                7.2 x
                                                                                                                                                                                                 1.9 x

                                 2025E               2026E                  Nikola              Luminar              Velodyne                Hyliion                 Canoo    Lordstown         Fisker

   © 2020 ChargePoint, Inc.      Source: Bloomberg, CapIQ and company disclosures; market data as of 21-Sep-2020.                                                                                          45
                                 Note: Valuations pro forma of announced SPAC transactions. Multiples based on management projections at transaction announcement.
                                 (1) Based on ChargePoint enterprise value of $2.4B
2019 Impact

ESG: ChargePoint for Good
+ 2.4B Electric Miles Enabled to Date
      − 81M charges; drivers plug in every 2.0 seconds
      − Avoidance of 98M gallons of gas
      − Avoidance of 312M kgs of CO2 emissions
      − Avoidance of 329M kgs of GHG emissions
+ Selected Awards
      − 2019: Acterra Award for Environmental Innovation, and London
        Business Awards: Social Impact International
      − 2018: Global Cleantech Hall of Fame
      − 2017: Architizer Smart Home Category, and Electrek Best of CES
      − 2016: Edison Award, Climate Change Business Journal

Source: Management data, as of August 2020.
© 2020 ChargePoint, Inc.                                                               46
Software Powers Scale
                How Do Site Hosts…
                + Control who can use stations and when?
                + Ensure all vehicles get charged on time?
                + Allow multiple vehicles to share power?
                + Let drivers get in line when all ports are taken?
                + Track how much energy they’ve dispensed?
                + Diagnose issues proactively and remotely?
                + Report environmental savings?

                How Do Drivers…
                + Find and access public charging stations?
                + Roam across different charging networks?
                + Get preferential pricing/access based on
                  employment or loyalty programs?
                + View all charging activity and cost (for both
                  home and public charging) in one place?
                                                                      Software Solves All of This and More.
                + Track their environmental savings?

© 2020 ChargePoint, Inc.                                                                                      47
Case Study

Workplace: LinkedIn
+ Need: Address company’s carbon emissions
  associated with employee commutes                                “Our vendor partners are amazing. ChargePoint
+ Solution: 223 networked ports, automated                          gives us great sustainability reporting every month
  sustainability reporting                                          and we try to share that out with employees, so
                                                                    they understand their impact.”
       – Non-constrained parking powered by waitlist and idle
         time pricing features                                             Danielle Glaser
                                                                           Head of Bay Area Transportation, LinkedIn
       – Constrained parking powered by cord sharing, valet
         and power management features
       – Reporting to increase employee awareness of carbon
         footprint from transportation
+ Results: Avoided over 3,000 MT greenhouse gas
  (GHG) emissions, the equivalent of ~46,000 trees
  growing for 10 years
       – 27% increase in charging sessions
       – 54%* of ports highly utilized during work week
       – Recognized as 2019 Best Workplaces for Commuters

                                                                Watch the Video Testimonial >
*As reported by LinkedIn
© 2020 ChargePoint, Inc.                                                                                                  48
Case Study

Fleet: Alameda County
+ Need: Fuel and manage electric county fleet vehicles
  and measure progress toward published climate goals             “Having internet-connected charging stations has
+ Solution: 126 networked ports with Power                         been instrumental for us to track energy
  Management and automated sustainability reporting                consumption and utilization for grant compliance
                                                                   and internal fleet metrics.”
      – Software tools to manage charging needs across fleet
        drivers, county employees and visitors                            Phillip Kobernick
                                                                          Logistics Services, Alameda County
      – Power Management to increase charging capacity
        without infrastructure upgrades
      – Real-time data informs parameters to ensure that
        electrical demand doesn’t exceed capacity (avoiding
        demand charges)
+ Results: Avoided 464 MT greenhouse gas (GHG)
  emissions
      – 44% YoY session growth, 2018 - 2019
      – 35-54%* savings compared to gas vehicles

                                                               Watch the Video Testimonial >
*As reported by Alameda County
© 2020 ChargePoint, Inc.                                                                                              49
You can also read