Q4 2018 INVESTOR UPDATE - March 7, 2019 - NorthWest Healthcare Properties
←
→
Page content transcription
If your browser does not render page correctly, please read the page content below
Q4 2018
INVESTOR UPDATE
        March 7, 2019
DISCLAIMER

 This presentation provides a summary description of Northwest Healthcare Properties Real Estate Investment Trust (“NWH” or the “REIT”). This presentation should be read in conjunction with and
 is qualified in its entirety by reference to the REIT’s most recently filed financial statements, management’s discussion and analysis, management information circular (the “Circular”) and annual
 information form (the “AIF”).

 This presentation contains forward-looking statements. These statements generally can be identified by the use of words such as “expect”, “anticipate”, “believe”, “foresee”, “could”, “estimate”,
 “goal”, “intend”, “plan”, “seek”, “strive”, “will”, “may”, “would”, “might”, “potential”, “should”, “stabilized”, “contracted”, “guidance”, “normalized”, or “run rate” or variations of such words and
 phrases. Examples of such statements in this presentation may include statements concerning: (i) the REIT’s financial position and future performance, including, normalized financial results, in-
 place and contracted run rates, payout ratios and other metrics; (ii) the REIT’s property portfolio, cash flow and growth prospects, (iii) liquidity, leverage ratios, future refinancings, fees earned by
 the asset manager to Vital Trust, anticipated capital expenditures, future general and administrative expenses, including estimated synergies and contracted acquisition and development
 opportunities, and (iv) the REIT’s intention and ability to distribute available cash to security holders.

 Such forward-looking information reflects current beliefs of the REIT and is based on information currently available to the REIT. Other unknown or unpredictable factors could also have material
 adverse effects on future results, performance or achievements of the REIT. Forward-looking information involves significant risks and uncertainties should not be read as a guarantee of future
 performance or results and will not necessarily be an accurate indication of whether or not, or the times at which, or by which, such performance or results will be achieved, and readers are
 cautioned not to place undue reliance on such forward-looking statements. The forward-looking statements contained in this presentation are based on numerous assumptions which may prove
 incorrect and which could cause actual results or events to differ materially from the forward-looking statements. Although these forward-looking statements are based upon what the REIT believes
 are reasonable assumptions, the REIT cannot assure investors that actual results will be consistent with this forward-looking information. Such assumptions include, but are not limited to, the
 assumptions set forth in this presentation, as well as assumptions relating to (i) the REIT successfully realizing the operational and financial benefits described herein, including the realization of
 synergies, completion of anticipated acquisition and development opportunities, and generation of cash flow; and (ii) general economic and market factors, including exchange rates, local real
 estate conditions, interest rates and the availability of equity and debt financing to the REIT. These forward-looking statements may be affected by risks and uncertainties in the business of the REIT
 and market conditions, including that the assumptions upon which the forward-looking statements in this presentation may be incorrect in whole or in part, as well as risks related to increases or
 decreases in the prices of real estate; currency risk; project development, expansion targets and operational delays; marketability; additional funding requirements; governmental regulations,
 licenses and permits; environmental regulation and liability; competition; uninsured risks; contingent liabilities and guarantees, including the outcome of pending litigation; litigation; health and
 safety; trustees’ and officers’ conflicts of interest; the ability of the REIT to integrate the operations of NWI; the ability of the REIT to continue to develop and grow; and management of the REIT’s
 success in anticipating and managing the foregoing factors, as well as the risks described in the Circular and the AIF. The reader is cautioned that the foregoing list of factors is not exhaustive of the
 factors that may affect forward-looking statements. Other risks and uncertainties not presently known to the REIT or that the REIT presently believes are not material could also cause actual results
 or events to differ materially from those expressed in its forward-looking statements. Additional information on these and other factors that could affect the operations or financial results of the
 REIT are included in reports filed by the REIT with applicable securities regulatory authorities.

 These forward-looking statements, which reflect the REIT’s expectations only as of the date of this presentation. The REIT disclaims any obligation to update or revise any forward-looking
 statements, whether as a result of new information, future events or otherwise, except as required by law.

 Certain information concerning Vital Trust contained in this presentation has been taken from, or is based upon, publicly available documents and records on file with regulatory bodies. Although
 the REIT has no knowledge that would indicate that any of such information is untrue or incomplete, the REIT was not involved in the preparation of any such publicly available documents and
 neither the REIT, nor any of their officers or trustees, assumes any responsibility for the accuracy or completeness of such information or the failure by Vital Trust to disclose events which may have
 occurred or may affect the completeness or accuracy of such information but which are unknown to the REIT.

 Funds from operations (“FFO”), adjusted funds from operations (“AFFO”), net operating income (“NOI”) and net asset value (“NAV”) are not measures recognized under International Financial
 Reporting Standards (“IFRS”) and do not have standardized meanings prescribed by IFRS. FFO, AFFO, NOI, and NAV are supplemental measures of a real estate investment trust’s performance and
 the REIT believes that FFO, AFFO, NOI, and NAV are relevant measures of its ability to earn and distribute cash returns to unitholders. The IFRS measurement most directly comparable to FFO, AFFO
 and NOI is net income. The IFRS measurement most directly comparable to NAV is net equity. A reconciliation of NAV, NOI, FFO, AFFO and Normalized AFFO to net income is presented in the REIT’s
 management’s discussion and analysis of financial condition and results of operations of the REIT for the period ended December 31, 2018, as filed on SEDAR.

                                                                                                     1
CORE HEALTHCARE INFRASTRUCTURE IN MAJOR MARKETS

                                                                      TORONTO

NorthWest Healthcare Properties Real Estate                                                                  AUCKLAND
                                                                                 SÃO PAULO
Investment Trust (TSX: NWH.UN) is a
specialist healthcare real estate investor that
owns a high quality portfolio of medical
office and hospital properties located                                                                            MELBOURNE
                                                      B E R L I N                                SYDNEY
throughout major markets in Canada, Brazil,
Germany, Australia and New Zealand.
                                                                    ESTABLISHED RELATIONSHIPS WITH LEADING HEALTHCARE OPERATORS

NWH AT A GLANCE
                                                                                                NOI
                                                                                          DIVERSIFICATION
 11.2M               156              $5.1BN
 SQUARE FEET        PROPERTIES        TOTAL ASSETS

96.7%               12.6              6.2%
  OCCUPANCY          YEAR WALE        IFRS CAP RATE

$1.5BN             7.2%                90%
 MARKET   CAP)   DISTRIBUTION YIELD   PAYOUT RATIO

                                                             2
HIGHLIGHTS OF THE QUARTER
DELIVERING STABLE Delivering stable operating results
AND CONSISTENT Stable per unit AFFO and NAV per unit
RESULTS Source currency adjusted cash SPNOI growth of 4.3% YTD
Occupancy of 96.7%; International portfolio occupancy above 98%
PREVIOUSLY European platform continues to gain momentum
ANNOUNCED During the quarter, the REIT acquired 1 German MOB and 1 German rehab hospital for a combined purchase
price of $52.3M. Post quarter end, the REIT acquired 1 MOB for a purchase price of $32M in Germany
STRATEGIC PRIORITIES
YTD over $300M in European acquisitions, including the first acquisitions in The Netherlands and expansion
ACTIONED WITH NEW into the German rehab hospital sector
OPPORTUNITIES Executing on strategic investment pipeline
IDENTIFIED Post quarter end, the REIT entered into a definitive agreement to acquire a portfolio of 11 high quality, major
market Australian hospitals from Healthscope Limited (“HSO”) for a combined purchase price of A$1.25 BN
The REIT intends to leverage existing capital relationships and ultimately own 25%-30% of the portfolio
while retaining management of the entire portfolio and generating incremental third party management fee
income
The portfolio is highly complementary to the REIT’s existing assets in region and solidifies NorthWest as the
leader in Australian healthcare real estate
The initial cap rate is 5%, with 2.5% annual rent increases on an initial 20-year lease term on an absolute
(quadruple) net lease basis
Improved Capital Markets Presence
NWH meets all criteria for S&P/TSX Composite index inclusion and expects to be added in the March rebalance
Increase level of intuitional support
Completed $269M of capital markets financing (including a $144 million equity offering that closed post
quarter end)
3
DASHBOARD

                 GROSS BOOK VALUE                                 NORMALIZED AFFO / UNIT

     +8.3% YoY (8.9x increase since inception)                       +11.0% since inception

                                        $5,072m
                      $4,684m
                                                                             $0.93              $0.88
     $572m                                                $0.80

  At inception        Q4-2017           Q4-2018       At inception          Q4-2017            Q4-2018
                                                                           Annualized         Normalized

                   OCCUPANCY                              WEIGHTED AVERAGE LEASE EXPIRY

          International portfolio at 98.3%                                +0.5yr YoY

                        95.9%           96.7%                                 12.1               12.6
     90.7%                                                 4.0

  At inception        Q4-2017           Q4-2018       At inception          Q4-2017            Q4-2018

                                                  4
2018 YTD SUMMARY OF INVESTMENT ACTIVITY

                                                     Significant Transactional Activity in 2018

                                      Q1                                                                                           Q2

   Acquired an MOB in Berlin and two post-acute care clinics in Bad
   Kissingen and Wilhelmshaven, Germany, totaling $80M. Acquired the                     Acquired the 2nd largest MOB in Berlin, Germany and two high quality MOBs in
   remaining 50% interest in Epworth Clarendon Hospital in Melbourne,                    Brunssum and Rotterdam, the Netherlands totaling $182M. Acquired a 10%
   Australia for $55M and completed the $167M disposition of the                         strategic stake in Healthscope (ASX:HSO).
   Dundas Edward Centre in Toronto.

                                     Q3                                                                                          Q4
                                                                                         $115M of completed transactions in Q4 (Europe and Australasia), totaling ~$550M
   Acquired one AAA asset in São Paulo, Brazil for $92M.                                 of global acquisitions in 2018. The quarter’s acquisitions comprised two properties
   Acquired development land in Australia and New Zealand collectively                   in Germany, a 50/50 JV between Vital and NWH Australia of Elizabeth Vale in South
   for ~$12M.                                                                            Australia, NWH Australia’s Casey Swim School and exercising its option in acquire
   Disposed 70% of Galaxy assets worth $207M.                                            Epping Medical Centre.

                       Summary                              Acquisitions                  Developments Completed                 Dispositions
                                                                                         Construction    Stabilized
                       YTD Q4 2018                   Value               Cap rate                                          Value          Cap rate
                                                                                            Cost           Yield
                       Australasia                   $138M                 5.3%               -              -            $207M             5.2%

                       Brazil                        $92M                  7.0%               -              -               -                  -

                       Canada                           -                    -                -              -            $167M             4.0%

                       Europe                        $314M                 6.0%               -              -               -                  -

                       Total                        $544M                  6.0%               -              -            $374M             4.7%
                       Note: Value excludes transaction costs and stake in Healthscope

                                                                                             5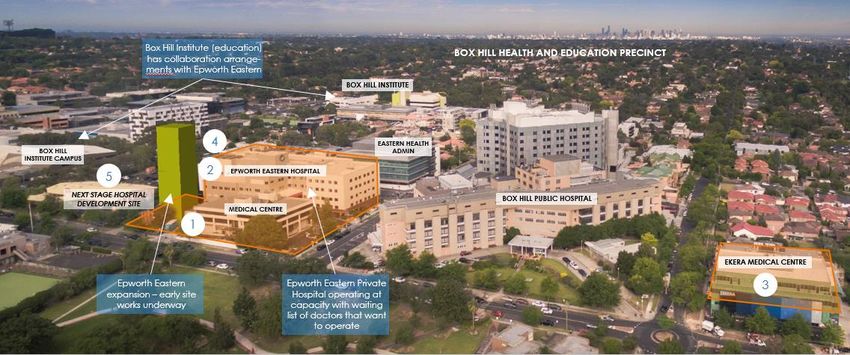
SIGNIFICANT VALUE CREATION IN ANZ MANAGER
PRO-FORMA THE
INSTITUTIONAL AUSTRALIAN
HEALTHSCOPE JV PLATFORM
ACQUISITION
NORTHWEST MANAGES AUM
(in $M) $491(*) $1,617 $2,000 $1,200 > $5,000
A$5.0BN AUSTRALASIAN
PLATFORM WITH A$3.5BN
NWH Ownership
OF FEE BEARING CAPITAL % 100% 24.9% 30% 25%-30% 34%
AND A 34% OWNERSHIP
INTEREST 3rd Party Fee
Nil $1,214 $1,400 $870 $3,484
Bearing Assets
FUNDING IN PLACE TO Market fees
LTM $35M Market fees
FACILITATE FULL Base fee Base fee To be finalized
Fees Internal Performance fee Performance fee based on ultimate $35M to $40M
INVESTMENT Activity fees Activity fees
ownership
Other fees Other fees structure
ANZ Manager $270M
Valuation Target 11x-13x
EBITDA multiple
Note (*): Net of the assets sold into the JV.
6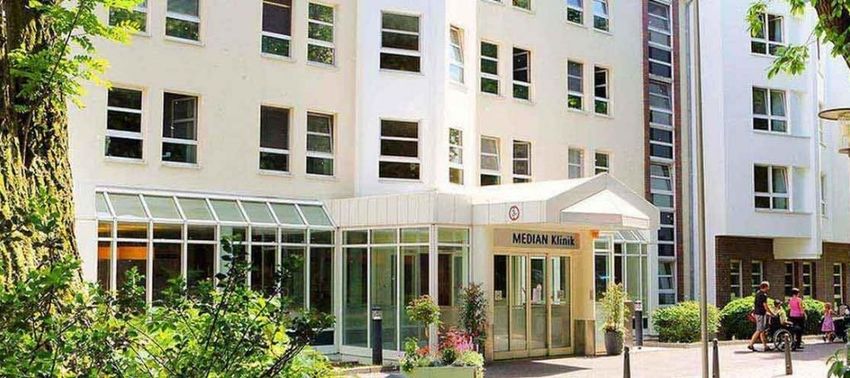
GROWTH THROUGH CAPITAL RELATIONSHIPS
OPPORTUNITY TO Healthcare real estate is an attractive investment for long-term institutional capital
LEVERAGE A Defensive healthcare fundamentals support high occupancy and long term indexed leases
DIFFERENTIATED High quality, new generation healthcare facilities in major global markets
HEALTHCARE REAL Significant consolidation opportunity driven by deep operator relationships
ESTATE PLATFORM TO
ATTRACT ADDITIONAL $2.8BN global pipeline provides an opportunity to scale capital relationships
FEE BEARING Australia: Significant strategic opportunity through Healthscope interest
INSTITUTIONAL
Brazil: “Triple A” major market strategy is well suited to growing institutional relationships
CAPITAL
Europe - Germany: Recent entry into the post-acute care rehabilitation clinic market
Europe - Netherlands: Highly fragmented market with consolidation opportunities
Leverage leading global platform and existing assets to drive meaningful fee growth
Pro-forma the HSO acquisition current stabilized fees of $35M - $40M underpinned by permanent
capital commitments
Highly scaleable and differentiated management platform to drive operating leverage
Target:
$1.0BN of incremental AUM
$10M - $15M of incremental fees
7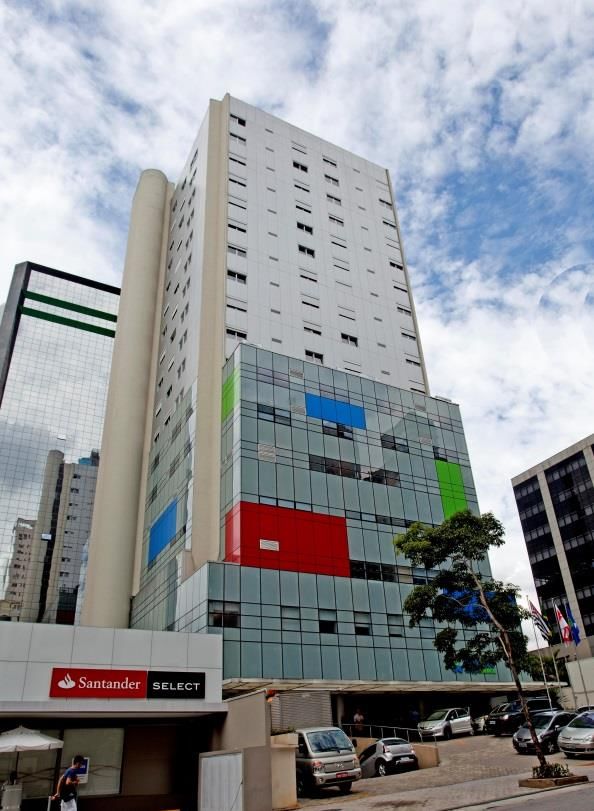
SOLIDIFYING AUSTRALASIAN LEADERSHIP

                                                  History and Key Accomplishments in Australia

                                  Developed local
            Initial investment    knowledge and                         Expansion and consolidation                          Integration and further expansion
                                  regional growth
                                                                        Generation Manager
                                       In Region:
              Vital Manager                                                 acquisition:                                  Full integration and rebranding of the
                                     strengthened
                acquisition:                                               acquired 100%      NWH completed            Australasian Management Platform to NWH
                                 relationship with key
              acquired 100%                                               interest in GHM     100% acquisition             Healthcare Properties Management
                                     operators and
             interest in VHML                                                                  of Generation
                                  improved portfolio
                                         metrics          Vital reached $1Bn in
                                                             assets; doubling                                                    Entered into an A$2.0Bn JV with a large
                                   NWH: Market
                                                             since the initial                                                            sovereign wealth fund
                                    and strategy
                                     assessment                 investment

                  2011                                   2012 - 2016                                  2017                            2018 and forward
                                   Vital delivered                                                    Exclusive RE
                                      excellent                                                        Partner of
                                   performance:                                                         Acurity
                                                                                                                        Acquisition of a 10%        Feb. 1, 2019 - entered into a
                                  Unit price +115%
                                                              Initial GHC Investment:               Completed           strategic interest in         definitive agreement to
   Initial Vital Investment:        (inception to
                                                                      acquired a                     $400M in         Healthscope; Australia's       acquire 11 properties from
acquired a 19.8% stake in NZX       DEC/15) and
                                                              19.8% stake in ASX listed           acquisitions and   2nd largest private hospital   Healthscope for A$1.25 Bn;
    listed Vital Healthcare        outperformed
                                                             Generation Healthcare REIT            developments       operator with a portfolio      the transaction is expected
Property Trust (founded early      benchmark by
                                                                 (founded in 2006)                    in 2017              of 45 hospitals                to close in Q2/19
             1990s)                    8,636 bp

                                                                                          8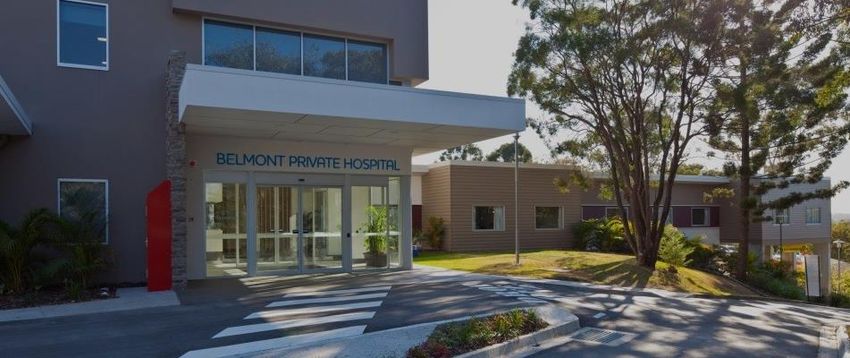
FINANCIAL OVERVIEW

        9
Q4-18 FINANCIAL DASHBOARD
As Reported Normalized Target
Deliver stable property operating Track to management run rate and
Completion of Project Galaxy guidance
performance, cash flow and including Seed portfolio sale.
distributions Completed the acquisition of Completion of the committed
Track to management run rate and Hospital Morumbi in Brazil development projects and
guidance over time refinancing initiatives
AFFO/unit (5) $0.81/unit $0.88/unit +$0.95/unit
LTV (6) 47.8% / 55.7% 45.3% / 53.3%FINANCIAL HIGHLIGHTS - PROFITABILITY
POSITIVE OPERATING Q4-18 Q4-18
RESULTS IN LINE WITH As Reported Normalized
MANAGEMENT NOI $66.8M $68.1M
GUIDANCE FFO $26.5M $31.6M
NORMALIZED RESULTS AFFO $24.5M $29.6M
HAVE BEEN ADJUSTED W.A Units
121,169 134,670
Outstanding
TO REFLECT THE
IMPACT OF RECENTLY Annualized AFFO / Unit (4) $0.81/unit $0.88/unit
COMPLETED AND Payout Ratio 99% 90%
COMMITTED
TRANSACTIONS NORMALIZATION ADJUSTMENTS
Normalization adjustments principally relate to:
- Full year effect of acquisitions and dispositions completed during the quarter;
- Full year effect of debt drawn during the quarter
- Debt optimization including initiatives executed during the quarter;
- Accrued rent to Q4-2018 based on contracted rent indexation;
- NWH Australia development completions; and
- Non-recurring and one time items.
11FINANCIAL HIGHLIGHTS - CAPITALIZATION
Q3-18 Q4-18
Q4 2018 NAV/UNIT WAS As Reported As Reported
POSITIVELY IMPACTED BY
Gross Book Value $4,679.6M $5,071.6
FAVOURABLE F/X
Debt $2,299.0M $2,423.1M
MOVEMENTS AND FV
Convertible
GAINS ACROSS THE REIT’S $295.3M $401.2M
Debentures
PORTFOLIO Other $564.0M $566.2M
Net Asset Value $1,523.8 $1,681.0
LTV (excl./incl.
49.4% / 55.7% 47.8% / 55.7%
converts)
NAV/Unit $11.09 $12.30 The Canadian dollar
depreciated by 5.9% QOQ vs.
the weighted basket of the
Quarterly NAV / Unit REIT’s foreign currency
exposure generating a gain on
foreign currency translation
FV gains following external
and desktop assessments
with corresponding cap rate
compressions
12BALANCE SHEET OPTIMIZATION AND REGIONAL DEBT STRATEGY
BALANCE SHEET OPTIMIZATION DEBT MATURITY PROFILE (11)
Debt Optimization Opportunities
Near-term debt maturities totaling ~$260M at 6.8% WAIR; offering
attractive interest rate saving opportunity
Extend debt maturity profile to align with long-term leases
Leverage global balance sheet to reduce regional borrowing
differentials
Path to Unsecured Credit Rating – Building an Unencumbered Pool
15.7% of debt is currently unsecured
Revolving warehouse facility strategy
LEVERAGE TRENDING LOWER REGIONAL DEBT STRATEGIES
LVR - consolidated incl. converts
60.0% Actuals Target
1
55.0%
Asset Level Bank Loans and Asset Level Asset Level
Type
50.0% Term Debt Securitization Term Debt Revolving Debt
1 2
LTV (13) ~45% ~25% ~55% ~40%
HSO Portfolio Acquisition:
45.0% - Represents impact of
acquisition at target 25%-
30% look through ownership
LTV temporarily elevated due to high Market
40.0%
2 transactional volume; expected to trend lower Interest ~3.7% ~7.3% ~2.2% ~4.5%
Deleveraging Plan
by executing on capital recycling initiatives Rates (14)
Capital recycling of
35.0% approximately $500 million
Typical
25 years 10 years 10 years Interest Only
Amortization
30.0%
13RISK MANAGEMENT – FOREIGN EXCHANGE
OVER A 10 YEAR NOI FX Rate - Spot Var. %
150 Weight 29-Dec-17 28-Sep-18 31-Dec-18 QoQ YoY 7-Feb-19 Var. %
PERIOD, PORTFOLIO
BRL:CAD 17.2% 0.3796 0.3188 0.3514 10.2% -7.4% 0.3581 1.9%
EUR:CAD 9.6% 1.5089 1.4979 1.5636 4.4% 3.6% 1.5091 -3.5%
140 NZD:CAD 42.4% 0.8913 0.8549 0.9163 7.2% 2.8% 0.8982 -2.0%
INDEX HAS REMAINED
AUD:CAD 10.3% 0.9820 0.9322 0.9614 3.1% -2.1% 0.9450 -1.7%
CAD:CAD 20.4% 1.0000 1.0000 1.0000 0.0% 0.0% 1.0000 0.0%
130 Portfolio Weighted Avg. 100.0% 5.5% 0.05% -1.0%
WITHIN A TIGHT BAND 120
110
RENTAL INDEXATION 100
ACTS AS NATURAL 90 97
CURRENCY HEDGE TO 80
70 74
FX MOVEMENTS
60
50
Dec-07
Dec-12
Dec-17
Jan-05
Nov-05
Apr-06
Jul-07
Oct-08
Jan-10
Nov-10
Apr-11
Jul-12
Oct-13
Jan-15
Nov-15
Apr-16
Jul-17
Oct-18
Sep-06
Feb-07
Mar-09
Sep-11
Feb-12
Mar-14
Sep-16
Feb-17
Aug-09
Aug-14
Jun-05
Jun-10
Jun-15
May-08
May-13
May-18
EUR/CAD BRL/CAD NZD/CAD AUD/CAD Portfolio Avg.
Brazil Equity Bridge Despite FX volatility, Brazil NAV has increased
primarily as a result of:
$700
$600
$162 $606 • Lease Structure: Triple net lease structure
-$32 • Structured lease review: Leases are annually
$500
$106 indexed to the IPCA index (the Brazilian equivalent
$400
$338 of the CPI Index)
$300
$200
$100
$0
14P O RT F O L I O O V E RV I E W
15PORTFOLIO OVERVIEW
$5.1Bn International Platform
C A N A D A B R A Z I L
LEADING MEDICAL STRONG RELATIONSHIPS
OFFICE BUILDING WITH LEADING
PLATFORM OPERATORS
56 PROPERTIES 8 PROPERTIES
SP NOI Growth (9) 0.4% SP NOI Growth (9) 3.1%
1,050 TENANTS 8 TENANTS
Occupancy 93.2% FITCH AAA+ RATED Occupancy 100%
TENANT
WALE 5.1YRs WALE 20.4YRs
AUSTRALASIA E U R O P E
LEADING REAL ESTATE CONSOLIDATION OF
PLATFORMS MEDICAL OFFICE
BUILDINGS
45 PROPETIES IN AUS SP NOI Growth (9) 5.5% 32 PROPERTIES SP NOI Growth (9) 4.0%
11 PROPERTIES IN NZD 666 TENANTS
Occupancy 98.5% Occupancy 96.4%
7 DEVELOPMENTS
WALE 16.6YRs WALE 10.8YRs
16PORTFOLIO DIVERSIFICATION
NOI DIVERSIFICATION TOP 10 TENANTS BY PERCENTAGE OF GROSS RENT (12)
GEOGRAPHICALLY
BY GEOGRAPHY (4)
DIVERSIFIED
% of Gross
Tenant Region
PORTFOLIO OF CORE Rent
1
HEALTHCARE REAL Rede D'Or 14.3%
ESTATE ASSETS IN 2
Healthe Care 12.8%
STABLE AND GROWING REGIONS
3
INTERNATIONAL Epworth Foundation 3.2%
MARKETS 4
Acurity Group 1.9%
HIGH QUALITY AND 5
CISSS / CIUSSS 1.5%
DIVERSIFIED TENANT NOI DIVERSIFICATION 6
ROSTER; STRATEGIC BY ASSET MIX (4) Hall & Prior 1.2%
7
RELATIONSHIPS WITH
Bolton Clarke 1.1%
LEADING HEALTHCARE 8
OPERATORS Hospital Sabara 1.1%
9
ASSET MIX
Sportsmed SA 1.0%
10
Mercy Ascot 1.0%
Top 10 Tenants 23.9%
17RECENT DEVELOPMENTS
Healthscope $2.0 BN Institutional Significant European
Transaction Hospital Morumbi Joint Venture Acquisition Pipeline
Complete Complete Compete Complete Ongoing
NWH has entered into a Size 233k Square Feet Size A$2.0Bn (debt and equity)
~€90M of near term
Transaction definitive agreement to
European investment
Description acquire 11 high quality
Size transactions to close over the
hospital assets for $1.2B Seed Portfolio ~A$410M as complete
Tenants Rede D’Or next 3-6 months, with ~€35M
closed in Q4 2018
HSO is a leading Australian
private healthcare provider, 30% NWH /
Healthscope Cap Rate ~7.5% Ownership 70% Institutional Partner
operating 45 Australian Cap Rate ~4.5%-6.4%
Description
hospitals, 48 medical centers
and 63 pathology labs.
Occupancy 100% Management Market base fees and
Fee activity fees
Occupancy 90%+
NWH intends to leverage its Lease Term ~25 Years JV will allow NWH to
Objective capital partners to ultimately accelerate its ANZ
retain a 25%-30% ownership Rationale consolidation plan through Rental
Annual Inflation Index
stake in the portfolio Rental better access to lower cost Increase
Annual Inflation Index
Increase capital
Acquisition Acquisition Completion Acquisition Completed and Pending
Expected Q2-2019 Q3-2018 Q3-2018 Date Completion
Date Date Date
18HEALTHSCOPE INVESTMENT HIGHLIGHTS
CORE HEALTHCARE INFRASTRUCTURE IN MAJOR MARKETS
Transformational 11 property, $1.2BN transaction solidifies
the REIT as the leader in Australian healthcare real estate NORWEST
Highly complimentary to NWH’s existing portfolio
Deepens relationship with Australia’s 2nd largest private
BRISBANE
operator PRIV ATE
Excellent risk adjusted returns from long term “absolute
quadruple net” lease structure, 2.5% annual fixed rent
increases strong 2.2x EBITDAR coverage on new 20 year
leases
~$525M pipeline of brownfield developments and capital
projects with attractive development spreads of 100 bps Newcastle Private
MELBOURNE CLINIC
Expected to be immediately accretive to reported
annualized AFFOPU DEEPENS EXISTING RELATIONSHIP
ACQUISITION METRICS
REGIONS
NOI
ASSET MIX
$1.2BN 5.0% $60M DIVERSIFICATION2
ACQUISITION PRICE CAP RATE1 INITIAL RENT
4% 4% 15%
13% NT SA Psychiatric
QLD
57 1,539 11 15% Rehabilitation
OPERATING BEDS PROPERTIES VIC NSW General
59%
THEATRES ACQUIRED 20%
Surgical
71%
100% 20 2.5% 100%
ANNUAL RENT 100%
OCCUPANCY YEAR WALE
INDEXATION Hospital
Australia
Notes: 19
(1) Based on purchase price excluding transaction costs
(2) Based on base rent at completionCASE STUDY #1 - EPWORTH EASTERN HOSPITAL, MELBOURNE
Development of a Healthcare Precinct
Co-located private hospital Epworth Eastern Private
Public hospital initial Public and private hospitals
development attracts Hospital announces major
demand catalyst drive health precinct
specialists expansion
20CASE STUDY #1 – EPWORTH EASTERN HOSPITAL, MELBOURNE
Development of a Healthcare Precinct
Epworth Eastern Private
Public hospital initial Private hospital development Public and private hospitals
Hospital announces major
demand catalyst leads to formation of precinct drive health precinct
expansion
1999 2003-05 2014-17 2017-2021
NorthWest has supported Epworth over 15+ years with expansion opportunities, advice and capital
Acquisition of adjacent Medical Development of Epworth Eastern Acquisition of Ekera Medical $125m expansion of Epworth
Centre housing specialists Hospital (private) Centre increases NorthWest Eastern Hospital
operating at Box Hill Public Establishes operator relationship assets in precinct Acquisition of Ekera Medical
Hospital with Victoria’s largest not-for- Strategic acquisition of adjacent Centre by NorthWest
profit private healthcare group site for private hospital expansion Adjacent site available for next
stage expansion
Developments have added to the quality & value of assets,
driving operational benefits & efficiencies that attract practitioners
Large site area creates potential Public and private hospital co- Public hospital major expansion Epworth Eastern Hospital at
for future expansion location further attracts specialists Council designated ‘Education capacity for 3 years
Begins to drive early stage and Health precinct’ – targeted New 30-year lease term over
precinct formation as a high growth area with entire expanded hospital
increased density Total 286 beds and $334m
value on completion in 2021
21CASE STUDY #2 – MEDIAN, GERMANY
SCALED EUROPEAN
PLATFORM PROVIDED Market ~230,000
ACCESS TO PARTICIPATE Leader Patients p.a.
IN RECENT
~€940 M 120
CONSOLIDATION Revenue Facilities
TRENDS
~18,200 ~15,000
Beds/Places Employees
German Fragmented Private Equity NorthWest
Rehabilitation Market Leads to Acquisition of Partnership
Market Consolidation Operator Opportunity
Germany is world-leading in Market fragmentation In 2014 MEDIAN was First NorthWest real estate
post-acute rehabilitation Strong operators acquisitive acquired by a private equity acquisition in 2017
Large market with 3% to achieve economies of group Total investment €75m with
German healthcare spend scale Now the clear market pipeline of €100m+
(€9.5 bn in 2016) Creates opportunity for real leader and largest private Supporting MEDIAN’s
estate portfolios operator through expansion under Master
acquisition strategy Lease Agreement
22CASE STUDY #2 – MEDIAN, GERMANY
Supporting ongoing Partnership is foundation
MEDIAN seeking reliable real
MEDIAN expansion with for continuous acquisition
estate partners
Who is MEDIAN? SLB transactions pipeline
Largest private
rehabilitation provider 2017 Present Future
with 120+ facilities
across Germany NorthWest bought the first MEDIAN is continuously MEDIAN’s growth strategy and
clinics from MEDIAN growing through acquiring their existing assets ensure a strong
new clinics and operators pipeline (forecast 5+ clinics per
In 2014 MEDIAN was The SLB transaction is based annum (€100m+))
acquired by Waterland on a master lease with NorthWest has bought the
Private Equity institutional market standards underlying real estate at the International expansion
time of MEDIAN‘s acquisition opportunities likely
Total market value of current
After several MEDIAN clinics: €75m Agreed key terms (master lease
acquisitions MEDIAN agreement) ensures competitive
has become the clear advantage and efficiency in
market leader in the transactions
German post-acute and
rehabilitation market
23CASE STUDY #3 – REDE D’OR, BRAZIL
PLATFORM GROWTH HAS Top 5 Global Healthcare Market NorthWest's Brazilian Portfolio has
Scaled Significantly
ALLOWED NWH TO Third largest private healthcare market: $180BN
REMAIN A KEY CAPITAL p.a. healthcare spending (9% of GDP)
NorthWest owns 8 hospitals totaling R$2.1
Population over 200M, rapidly ageing, with a
PARTNER AND EXPAND growing middle class
billion (C$750m)
Ongoing collaboration with partner for win-
ALONGSIDE OUR KEY Many old / obsolete private hospitals, with
win opportunities
unsophisticated operators
OPERATING PARTNERS Brazil coming out of recession
Top Facilities ‘AAA‘ Strategy
Major acute-care assets
Leading cities
Highly capable operator
A-typical lease structures – no rent reviews,
inflation escalation
R$M +36% p.a.
2,124
1,796
Best-in-Class Private Hospital Operator
1,578
851 885 1,009
Largest private hospital operator in Brazil: 39 340
hospitals, 5,900 beds
AAA Fitch national rating
Backed by global investors GIC (26%) and Carlyle 2012 2013 2014 2015 2016 2017 2018
Group (12%)
24Case study #4 – Healthe Care, Australia
Driving growth through relationships
2019
Third largest for-profit
private hospital operator
2006 2016 2017 in Australia
Commenced healthcare
operations with the
Acquired by pan-Asian health
services group that is exploring
Acquired portfolios of
18 hospitals and day
2,500
acquisition of 6 hospitals growth in Australia and Asia surgeries, funded through 36
Operator private equity
7,000
Continued acquisition and partnering
2010 2011 - 2018 2019
Acquisition of Healthe Care Acquisition of additional Significant capital partner on
hospitals Healthe Care hospitals brownfield developments
Real estate partner
8 facilities, 18 facilities,
~$100M across facilities ~$850M gross value
25ACCRETIVE DEVELOPMENT & EXPANSION PIPELINE
~$344M ($157M proportionate) of committed low risk development & expansions in
WITH A TRACK Australasia, Brazil, and Canada to be funded through a combination of existing resources
RECORD OF and property financing
$275M ($87M proportional) of Australasian hospital and MOB expansions at Vital and NWAUS
COMPLETING MORE –
– $51M of Brazilian hospital expansions
THAN $500M OF – $19M of Canadian MOB development
DEVELOPMENTS AND ~$17.4M of stabilized value accretion on a proportionate basis
EXPANSIONS, THE REIT – Potential to generate up to an incremental ~$0.15 of NAV/Unit
IS LEVERAGING ITS
Potential
Est. Project Cost to Pre-Leased Project Project
EXPERIENCE TO Country (15) Projects
Completion Cost Complete Occupancy Yield NOI
Value
Accretion
DELIVER AN
Q2 2019 to Q4
ADDITIONAL $344M 7
2022
87 74 100% ~6.2% 5.4 10.7
OF VALUE ENHANCING
PROJECTS TO ITS 2 Q4 2019 51 51 100% ~7.5% 3.8 3.6
PORTFOLIO
1 Q1 2020 19 15 60% ~7.0% 1.3 3.1
10 157 140 ~6.7% 10.5 17.4
26COMMITTED ACCRETIVE DEVELOPMENT & EXPANSIONS – AUSTRALASIA
SEVEN DEVELOPMENT $275M ($87M proportional) of committed development at a weighted yield of 6.3% (6.2%
PROJECTS TOTALLING proportional).
~C$275M ARE $17M of stabilized net operating income (at 100% interest)
CURRENTLY Project Cost Cost to Complete
Million of C$ Projects Est. Completion
(Proportionate) (Proportionate)
ONGOING
Maitland Private Hospital Q3 2019 0.7 0.2
BROWNFIELD
REDEVELOPMENTS
Lingard Day Surgery Q4 2019 5.9 5.0
REMAIN CORE TO
NWH‘S AUSTRALASIAN Epworth - GSC & Carpark
Q2 2019 24.8 16.1
STRATEGY AND A KEY
DRIVER OF NOI AND Epworth Eastern -
Q1 2021 30.3 28.6
Nelson Road Flats
NAV GROWTH
Royston Hospital Q3 2020 3.0 2.6
Wakefield Hospital Q4 2022 21.5 20.3
Bowen Hospital Q1 2019 1.1 1.1
7 87.3 73.9
27S T R AT E G Y & O U T L O O K
28RELATIVE VALUATION
THE REIT IS TRADING AFFO Multiple
22.0x
AT A SIGNIFICANT $18.15
DISCOUNT TO ITS 17.0x $14.86
20.6x
PEERS ON AN AFFO $11.10 16.9x
$13.24
12.0x 15.0x
MULTIPLE BASIS 12.6x
7.0x
2.0x
NWH.UN Canadian REITS Internationally Focused US Healthcare REITS
-3.0x
(EV > $1BN) Canadian REITS (Top 5)
15.0%
Implied unit price $13.57
10.0%
10.3%
$11.72 $11.66
5.0% $11.10
0.0%
-4.7% -5.2%
(5.0%)
-9.8%
(10.0%)
(15.0%)
Premium(Discount) to NAV
- Based on NWH.UN’s closing unit price of $11.10/unit as of February 28, 2019 and normalized AFFO/Unit of $0.88 per year; NWH.UN’s NAV is based on Q4 2018 of
$12.30.
29INVESTOR FACTSHEET
Ticker NWH.UN
Listed Exchange TSX
Distribution Payable Monthly
55% Return of Capital /
Distribution Type
45% Capital Gains
Unit Price (Dec 31, 2018) $9.48
Market Capitalization ~$1.5Bn
Distribution Yield ~7.2%
52-Week Trading Range $9.10- $11.70
Volume Weighted Avg. Price (VWAP) (20-day) $9.92
Average Daily Volume (90-days) 325,000
NAV (Q4-2018) (7) $12.30
30A P P E N D I X 1
INVESTMENT THESIS
31INVESTMENT HIGHLIGHTS
FOCUSED
Healthcare Real Estate Management Deep
Specialists Expertise Relationships
Pure play healthcare real estate Aligned leadership with a team of Leading tenant relationships and
and infrastructure healthcare real estate experts operational understanding
DIFFERENTIATED
96%+ 12.6 yrs. 70%+ High Portfolio
Occupancy WALE Indexed Quality
International portfolio Cash flow stability; among the NOI indexed to inflation Major markets; core
occupancy of 98%+ longest term leases in the industry drives consistent organic growth healthcare infrastructure
SCALED
180+ $4.0Bn Australasian $1.5Bn MOB $1.5Bn
Professionals Platform Platform Market Cap
Operating in 3 of the largest global With strategic investment in Leading MOB platforms in Enhanced capital markets profile
private healthcare markets Vital Trust and capital from Canada and Germany with proven access to capital
institutional JV deployed
32HEALTHCARE REAL ESTATE THESIS
• Favourable demographics and industry trends
Supportive
• Aging populations
Fundamentals • Rising healthcare expenditures
• Defensive core healthcare infrastructure
Attractive
• Global gateway cities
Asset Class • Leading healthcare operators
• Significant internal and external growth opportunities
Growth Opportunities • Inflation indexed leases
• Accretive expansions + industry consolidation
Value • Healthcare real estate fundamentals support premium valuations
Opportunity • Currently trading at a discount to Canadian REIT peers
Proven & • 10+ year public company track record
Aligned • Highly aligned founder and management
DEFENSIVE, HIGH YIELDING SECURITY WITH GROWTH POTENTIAL
33KEY DRIVERS OF HEALTH CARE REAL ESTATE
Aging Population
>65 population cohort growing rapidly
in developed countries
> 656mm people worldwide over 65
by 2021, ~11.5% of global population
Consolidation & Cost Increased Healthcare The Rise of Private
Savings Spending Healthcare
Scale required for efficiency and $8.7 trillion global healthcare spending Budget pressures affecting the
quality by 2020 sustainability of public healthcare
10.6% of global GDP funding
Rise of Public Private partnerships
Growing at 4.3% per annum Governments mandating lower costs
and improved quality
Growing Populations and
Wealth Creation
Emerging economies demanding
better access to quality care
Patients seeking more choice and
control
Source: Deloitte 2018 Global Healthcare sector outlook
COMPELLING NEED FOR CAPITAL, FACILITIES AND REAL ESTATE SOLUTIONS
34HEALTHCARE REAL ESTATE OPPORTUNITIES
• NWH’s markets comprise a total population of ~350 million, slightly larger than
the United States
NWH’s Market • Total healthcare real estate opportunity estimated to be comparable to the US
Opportunity (~$1 Trillion) across NWH’s markets
• Significant potential consolidation opportunity with NWH’s platform currently
comprising ~$3.7 billion
• Estimated U.S. healthcare real estate market exceeds $1 Trillion
• Largest healthcare REITs acquired over $100 Billion over last 10 years; still own
U.S. Healthcare
less than 15% of the market
Opportunity • Large U.S Healthcare REITs historically generated better returns with lower
volatility
HISTORICAL NOI GROWTH OF “BIG 3 HEALTHCARE REITS (1)
Source: Green Street Advisors (January 2017)
35A P P E N D I X 2
FINANCIAL METRICS
36TRANSFORMATIONAL GROWTH CONTINUES
NWI Investment and
Canadian Medical Office Building (MOB) Consolidation
International Growth
Defensive High Improved Positioned for
Quality Portfolio Market Profile Growth
Core Healthcare Focus Increased Market Capitalization Aligned & Integrated Global Platform
Major Global Markets Reduced Payout Ratio Leverage Institutional Relationships
Asset & Capital Diversification Reduced Leverage Identified Expansions and Developments
Improved Portfolio Metrics Increased NAV Actionable Acquisition Pipeline
37FINANCIAL AND OPERATIONAL METRICS
GROSS BOOK VALUE PORTFOLIO QUALITY
GBV has increased from $4.8N to $5.1BN, a ~6.7% increase Portfolio quality improved – occupancy up to 96.7% with WALE
increasing to 12.6 years.
Normalized GBV YoY + 6.7% Occupancy % YoY + 0.5 years Wale
4.9 5.1 96.7%
4.8 4.8 4.7 97.0% 96.4% 13.3
5.0 96.3% 96.3%
95.9% 13.1
96.0%
4.0 12.9
95.0% 12.7
3.0 94.0% 12.7 12.5
12.6 12.3
2.0 93.0% 12.5
12.3 12.1
92.0% 12.1 11.9
1.0 11.7
91.0%
11.5
-
90.0% 11.3
Q4-17 Q1-18 Q2-18 Q3-18 Q4-18
Q4-17 Q1-18 Q2-18 Q3-18 Q4-18
SP NOI NAV
Cash SP NOI in source currency increased 3.2% YOY in Q4 18. In CAD, SP NOI NAV increased from $11.09 to $12.30 QoQ (+11%) due to
was highly impacted by the BRL, which depreciated 11.4% YoY vs. CAD. favourable FX movements and FV gains
SP NOI Growth YoY NAVPU
% in C$ % in Source $ 12.60
12.32 12.30
7% 12.40
12.20 12.00
5.0% 12.00
5% 4.4… 11.80
4.0% 11.50
11.60
3.2%
11.40
3% 11.20 11.09
1.8%
1.2% 11.00
10.80
1% 0.4%
10.60
10.40
Q4-17 Q1-18 Q2-18 Q3-18 Q4-18
-1% -0.5% -0.3%
Q4-17 Q1-18 Q2-18 Q3-18 Q4-18
38FINANCIAL AND OPERATIONAL METRICS
FINANCIAL PROFILE CAPITALIZATION
Q4 Normalized AFFOPU of $0.88 results in a ~90% payout ratio Consolidated LTV (Incl. Converts) is 55.7% (flat QoQ)
60%
Normalized AFFOPU AFFO payout ratio 56.1% 55.7% 55.7%
1.10 100% 55% 53.1% 53.1%
1.00 0.93 0.92 50.2%
0.90 0.88 0.88 49.4%
0.90 50% 47.8%
46.8% 46.9%
0.80 89% 90% 90%
87% 45%
0.70 86% 80%
0.60 40%
0.50
0.40 35%
Q4-17 Q1-18 Q2-18 Q3-18 Q4-18
0.30 60%
Q4-17 Q1-18 Q2-18 Q3-18 Q4-18 Debt to GBV (ex. converts) Debt to GBV (incl. converts)
CAPITAL RAISING CAPITAL MARKETS AND LIQUIDITY
Total capital issuance of ~$269M including completed Q1/19 Volume Price TSX REIT Index
equity offering 4.000
$11.50 3.600
3.200
Equity
$10.50
2.800
Convertible Debenture
Volume (millions)
Unit Price (C$)
2.400
$9.50
2.000
1.600
$8.50
1.200
125
$7.50 0.800
144 144 0.400
125
- - $6.50 --
DEC-17
Dec-17 MAR-18
Apr-18 JUN-18
Jul-18 SEP-18
Oct-18 DEC-18
Q1-18 Q2-18 Q3-18 Q4-18 Q1-19 LTM
39A P P E N D I X 3
REGIONAL PORTFOLIO
OVERVIEWS
40PORTFOLIO PROFILE
PORTFOLIO GLOBAL HEALTHCARE REAL ESTATE INFRASTRUCTURE
COMPRISES 156
PROPERTIES
Q4 2018 Canada Brazil Europe Vital Trust NWAUS Platform (1)
TOTALING 11.2M
SQUARE FEET OF GLA
IN SIX COUNTRIES Number of
56 8 32 45 15 156
Properties
STRONG OPERATING ~94% MOB & /
~24% MOB & /
~76% Hospital
~40% MOB & /
48% MOB /
52% Hospital
100% ~6% Hospital and ~60% Hospital and
FUNDAMENTALS WITH Asset Mix by GLA 100% MOB
Hospital other Healthcare
and Other
Other Healthcare
and Other
Healthcare Healthcare
Facilities Facilities
Facilities Facilities
OCCUPANCY OF
GLA (Million
3.5 1.7 2.1 2.6 1.3 11.2
96.7%, WALE OF 12.6 Square Feet)
YEARS AND 48% MOB
Gross Assets $1,113 $768 $618 $1,717 $749 $5.1B
52% HOSPITAL AND
OTHER HEALTHCARE Occupancy 93.2% 100.0% 96.4% 99.4% 96.7% 96.7%
FACILITIES MIX
WALE (Years) 5.1 20.4 10.8 18.5 13.0 12.6
Avg. Building
~30 ~14 ~25 ~21 ~11 ~23
(Years)
Weighted Cap
6.5% 7.5% 5.8% 5.7% 5.8% 6.2%
Rate
1. All metrics are shown on a 100% consolidated basis and excludes non-real estate metrics: Corporate and Vital Manager
41CANADA: LARGEST PORTFOLIO OF MOB ASSETS
INVESTMENT AND MARKET OVERVIEW
Canada’s largest non-government owner/manager of MOBs and
healthcare related facilities
YT
Portfolio of 56 properties comprising GLA of 3.5 million sf and
NT
1,050 tenants
NU
93.2% occupancy and ~5.1 year WALE
High quality real estate with stable cash flow underpinned by
AB
BC
SK
NL
tenancies supported by the Canadian publicly funded healthcare
system
Spruce Grove (1) Edmonton (4) MB QC
Airdrie (1)
Provides stability and diversification to a broader international
Calgary (7) ON
Winnipeg (2)
NB
PE
healthcare real estate portfolio
NS
QC CANADA NB PE
ON
Quebec City (3)
Moncton (1)
Fredericton (1)
New Glasgow (1) Queensway Professional Center
Levis (1)
Lower Sackville (1)
Halifax (2)
Mississauga, ON
Joliette (1)
Laval (1) Lachenaie (1) NS
Longueuil (2)
Ottawa (1) Richelieu (1)
Saint Hubert (1)
Montreal (1)
Vaudreuil-Dorion (1)
Collingwood (1) Barrie (1)
Whitby (1)
Mississauga (1)
Guelph (2) Toronto (10)
Cambridge (1) Oakville (1)
London (2) Hamilton (3)
Hys Centre
Edmonton, AB
Springbank Medical Centre
London, ON
42BRAZIL: NEWLY BUILT PRIVATE PAY HOSPITAL ASSETS
INVESTMENT AND MARKET OVERVIEW
Institutional quality, core healthcare infrastructure assets in strategic
markets including São Paulo, Brasilia and Rio de Janeiro
RORAIMA
100.0% occupancy and ~20.4 year WALE
AMAPÁ
Stable cash flow with long-term, triple-net, inflation-indexed leases,
Manaus
Bele
m Fortaleza
providing consistent organic growth
AMAZONAS PARA MARANHÃO CEARA
RIO GRANDE
Long-term relationship with one of the country’s leading hospital
operators Rede D’Or São Luiz S.A. (Fitch National Rating: AAA)
DO NORTE
Natal
PIAUI
PERNAMBUCO Recife
ACRE
ALAGOAS
Macieo
RONDÔNIA TOCANTINS
BAHIA
Salvador
FEDERAL Hospital Santa Helena
DISTRICT
Brasilia
Hospital Santa Luzia
Hospital Coração
GOIAS
Existing Assets MINAS GERAIS
MATO GROSSO
DO SUL
SÃO PAULO RIO DE JANEIRO
Hospital Sabará Hospital Caxias
Rio De Janeiro
Hospital Brasil São Paulo
Hospital São Luiz Morumbi Hospital Ifor
PARANÁ SANTA
CATARINA
RIO GRANDE
DO SUL
Port Alegre
Hospital Infantil Sabará Hospital Caxias D’Or
São Paulo Rio de Janeiro
43EUROPE: STRATEGICALLY LOCATED MOB ASSETS
INVESTMENT AND MARKET OVERVIEW
High quality MOB assets located in the major markets including Berlin,
The Netherlands SCHLESWIG- Hamburg, Frankfurt, Ingolstadt, Leipzig and Rotterdam
2 HOLSTEIN
96.4% occupancy and ~10.8 year WALE
MECKLENBURG-VORPOMMERN
Wilhelmshaven
1
2
Expansion into rehabilitation clinics presents a unique opportunity to
BREMEN Hamburg acquire assets with infrastructure-like characteristics.
NIEDERSACHSEN
BERLIN
Fully integrated property management and asset management
Berlin Assets
12
capabilities allow efficient operation and deal sourcing
BRANDENBURG
SAXONY-ASPHALT
NORDRHEIN-WESTFALEN
HESSEN SACHSEN
Fulda 11
2 THURINGIA
Leipzig Portfolio
Bad Kissingen
Bernkastel-Kues Frankfurt 1
1
RHINELAND-PFALZ Adlershof 1 Medimall
Berlin Rotterdam
SAARLAND
BAYERN
Ingolstadt
BADEN-WÜRTTEMBERG
1
Munich
Berlin Neukolln Hollis Centre
Berlin Ingolstadt
44AUSTRALASIA (1): MAJOR MARKET HOSPITAL AND MOB PORTFOLIO
PORTFOLIO OVERVIEW
Northwest Healthcare Properties Australia REIT “NWHP AUS” owns a
leading Australian healthcare real estate portfolio with over $600M in
existing assets
Portfolio of 15 Properties of ~1.3M Square Feet
Epworth Victoria Parade Hospital Epworth Freemasons Private Hospital 6 hospitals, 6 medical centers, 3 residential aged care
Melbourne CBD, Victoria Melbourne CBD, Victoria
Strong occupancy and long-term lease expiry profile
96.8% occupancy and ~13.0 year WALE
STRATEGIC FIT
Australian Red Cross Blood Clinic Casey Specialist Centre
Brisbane, Queensland Melbourne Suburb, Victoria Major Market Focus
− The portfolio is centered around Australia’s three largest cities:
Sydney (pop: ~4.9m), Melbourne (pop: 4.5m), and Brisbane
(pop: ~2.3m)
NORTHERN
Stable, Growing & Accretive Cashflow
TERRITORY
− Long-term inflation indexed leases to some of the region’s
QUEENSLAND largest hospital operators
WESTERN AUSTRALIA
5 − Track record of earnings growth through accretive acquisitions,
expansions, and developments
SOUTH AUSTRALIA
Core Healthcare Strategy
NEW SOUTH WALES
3 − 10+ years of dedicated healthcare focus
VICTORIA − Strong healthcare operator relationships Healthscope,
7
Epworth Foundation, and St. John of God
TASMANIA
45AUSTRALASIA (2): STRATEGIC INVESTMENT IN VITAL TRUST
INVESTMENT AND MARKET OVERVIEW
Manager and 24.9% strategic shareholder of Vital Trust (NZX:VHP),
AUSTRALIA
Australasia’s listed healthcare real estate owner with 26 private hospitals,
10 MOBs, 5 aged care assets and 4 development lots
99.4% occupancy and ~18.5 year WALE
NORTHERN Stable and growing cash flows underpinned by tenancies of high quality
TERRITORY
hospital and healthcare operators with long-term, inflation-indexed
QUEENSLAND leases
5
WESTERN AUSTRALIA
4
SOUTH AUSTRALIA
3
NEW SOUTH WALES
14
VICTORIA
6
NEW ZEALAND
TASMANIA Epworth Eastern Medical Centre Marian Centre
1 Melbourne, AU Perth, AU
12
Epworth Eastern Hospital Ascot Hospital
Melbourne, AU Auckland, NZ
46A P P E N D I X 4
MANAGEMENT
BIOGRAPHIES
47GLOBAL PLATFORM WITH REGIONAL CAPABILITY AND EXPERTISE
FULLY ESTABLISHED, MANAGEMENT REGIONAL OPERATING PLATFORM AND EXPERTISE
SCALABLE REGIONAL
TEAMS WITH EXPERTISE IN Paul Dalla Lana Gerson Amado Leads NWH’s Brazilian
Founder of NWH & NWI REITs
Chairman & Managing platform
HEALTHCARE PROPERTY Largest unitholder of REIT
CEO Director – Brazil Office in Sao Paulo
OPERATIONS,
ACQUISITIONS AND
DEVELOPMENT Global governance oversight
and business development Jan Krizan Leads NHW’s European
Bernard Crotty
Managing platform
LOCAL MARKET President Representative on NWH’s and
Director – Office in Berlin
Vital Trust’s board
KNOWLEDGE AND Germany
STRONG RELATIONSHIPS
WITH LEADING
Peter Riggin Leads NWH’s real estate Craig Mitchell Leads NWH’s Australasian
HEALTHCARE PROVIDERS COO & MD operations and global MOB CEO – ANZ platform
Canada platform Management Office in Melbourne
Platform
OVER 180 PROFESSIONALS
ACROSS 9 OFFICES IN 5
Responsible for financial
COUNTRIES
strategy & reporting, and Co-leads NWH’s
Shailen Chande capital market & corporate Australasian platform
David Carr
CFO finance activities CEO - Vital Trust Office in Auckland
Chartered Accountant
EVP, General Counsel and
Mike Brady Secretary to NWH REIT
Executive Vice
Transaction management and
President
leadership
48NOTES
1. Based on NWH.UN’s closing unit price of $11.10/unit as of February 28, 2019.
2. Based on the REIT’s distribution policy of $0.80/unit per annum and normalized Q4-18 AFFO of $0.88/unit.
3. Based on total assets of NWH, Vital Trust on a fully consolidated basis including post-quarter acquisitions. NHW owns a 24.9% interest in Vital Trust.
4. The pie charts above reflect proportionate NOI and include i) the REIT’s 24.9% proportionate ownership of Vital Trust and ii) ANZ fee income.
5. Reported AFFO/Unit represents quarterly AFFO annualized for the three month period ending December 31, 2018. Normalized AFFO/unit is based on Q4-18 Reported AFFO/unit and adjusted
for completed acquisitions, and financings as presented in the REIT’s Q4-18 MD&A PART III.
6. LTV excludes/includes convertible debentures and is shown on a fully consolidated basis (Vital Trust at 100%). On a proportionate ownership basis Reported LTV is 50.6% / 61.2%.
7. NAV is based on unitholder’s equity plus add-backs as set out in Part XII in the REIT’s Q4-18 MD&A. Normalized NAV is equal to the reported NAV adjusted for the impact of FX changes post
quarter end.
8. At inception represents metrics for NorthWest Healthcare Properties based on the IPO prospectus dated of March 25, 2010.
9. Represents same property NOI growth YoY (“SPNOI”) in source currency for the three months ended December 31, 2018 and excludes non-cash amortization and non-recurring transactions. In
the current quarter the SP NOI Growth does not include NW Australia.
10. Represents Financial Statements as of December 31, 2018 adjusted for normalization adjustments, presented in the REIT’s Q4-18 MD&A PART III.
11. Reflects the debt maturity profile as per the REIT’s Q4-18 MD&A and does not include deferred consideration.
12. Gross rent on a fully consolidated basis
13. LTV’s are excluding corporate debt (ie. convertible debentures and revolving credit lines) and are shown on a regional basis.
14. Represent estimate of current market rates.
15. Assuming projects are 100% debt funded at the existing region’s financing costs and is for indicative purposes only. Does not include development pipeline from announced acquisitions
49CONTACT INFORMATION
NORTHWEST HEALTHCARE PROPERTIES REIT
Paul Dalla Lana, Chairman & CEO
416-366-2000 Ext. 1001
Shailen Chande, CFO
416-366-2000 Ext. 1002
50You can also read