SHAPING THE FACE OF RETAIL IN POLAND - Echo Polska Properties
←
→
Page content transcription
If your browser does not render page correctly, please read the page content below

SHAPING THE FACE OF RETAIL IN POLAND

Introduction                                                                                                                                                              1
                                                          EPP Management

                                                                    EPP Executive Team

        Hadley Dean                     Jacek Baginski                  Michał Świerczyński               Wojciech Knawa                     Rafal Kwiatkowski
           CEO                               CFO                            Head of AM                      Head of PM                              COO

 •   More than 20 years of real   •   Senior financial executive    •    Over 20 years of real       •   17 years of experience in       •   Over 15 years of real
     estate experience                with over 20 years of              estate experience across        commercial real estate              estate experience gained
                                      experience across CEE              Poland, Russia and                                                  at, among others, Echo
 •   Most recently served as                                             Germany                     •   Most recently served as             Investment
     the CEO of Compass           •   Member of a number of                                              the Managing Director at
     Offices’ EMEA operations         Management Boards and         •    Most recently served as a       Echo Investment Property        •   Most recently served as
                                      CFO in companies listed            Venture Partner and the         Management, where he                the Chief Legal Officer at
 •   Prior to Compass, served         on the Warsaw Stock                Head of Retail at Griffin       managed all retail and              Echo Investment, being
     as a Managing Partner of         Exchange and those                 Real Estate                     office assets                       directly involved in
     Eastern Europe at Colliers       controlled by large private                                                                            financing, leasing, sales
     International, where he          equity funds in CEE           •    In 2004-2007 Associate      •   Prior to joining EPP,               and acquisitions
     managed business across                                             Director at JLL Russia          worked in the hotel and
     12 countries, 16 offices     •   Recently, Member of the                                            office sectors, selling hotel   •   In 2005-2007 Member of
     and more than 1,000              Management Board and          •    In 1997-2004 Head of            projects and                        the Supervisory Board at
     employees                        CFO of Empik Media &               Leasing and Development         commercialising office              Barlinek and Opoczno
                                      Fashion, one of the                at ECE                          assets
 •   In 2017 received the             largest retail groups in           Projektmanagement
     EuroBuild Real Estate            Poland
     Personality of the Year
     (2017) award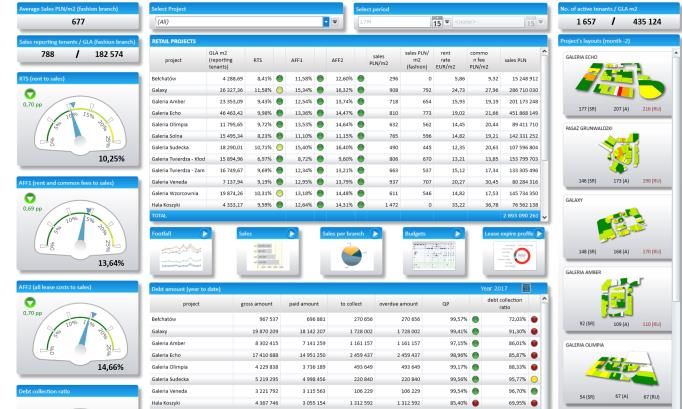
Introduction                                           2
                                  Agenda

 1   Company at a glance

 2   Key investment highlights

 3   Poland – attractive investment destination

 4   M1 portfolio update , Marcelin and Developments

 5   Update on the office disposal process

 6   Historical Financials

 7   Conclusion
Section 1                3

   Company at a glance

Section 1                                                                                                                                                                                 4
                                                              EPP at a glance

                                  Overview                               Key performance indicators                              EPP’s geographical footprint

•    EPP is the leading retail property group in Poland with c.€2bn
     of investment properties                                           Occupancy
                                                                                        98.6           96.0
                                                                           (%)
•    One of the most experienced retail property and asset                                                            Szczecin
     management team in Central & Eastern Europe (CEE)                                                                                                              Lomza
                                                                           WALT
•    Presence in the majority of key cities throughout Poland with                      5.3              3.8                        Inowroclaw
                                                                          (years)                                                                Wloclawek
     coverage of 40% of the national catchment area                                                                           Poznan
                                                                                                                                                           Warsaw
•    Experienced Executive Board
                                                                           LTV                47.4
•    Strong institutional shareholders: Redefine (36.2% stake),            (%)           (target of 45)
                                                                                                                                       Kalisz
                                                                                                                                                      Lodz
     Oaktree & PIMCO (shareholders in Echo Prime which holds a
     6.4% stake in EPP)                                                                                                                               Bełchatow
                                                                        Debt WAM                                    Jelenia Gora
                                                                                                                                       Wrocław
•    Raised c.€360m of new equity post IPO                               (years)
                                                                                                 3.9                                                           Kielce
                                                                                                                                                                                     Zamosc
                                                                                                                                                 Czeladz
                                Business model                                                                         Klodzko       Zabrze
                                                                      EBITDA interest                                                                      Krakow
                                                                                                 4.2
                                                                         coverage
    1•    Pure Polish play, with retail focus                                                  (2017A)                                                                        Przemysl
                                                                            (x)
    2•    Each asset must be dominant, defensible and sustainable     Occupancy cost
                                                                                                 13.5
    3•                                                                    ratio
          Organic and inorganic growth to obtain scale                                         (2017A)
                                                                           (%)                                                                                      Retail development
    4•    Highly proactive asset and property management                                                       18            Retail assets                 2              projects
                                                                       Rent to sales
    5•    Long-standing tenant relationships                                                    10.3
                                                                           (%)                                 6             Office assets             18                   Cities
    6•    Continued deleveraging

Source:   Company information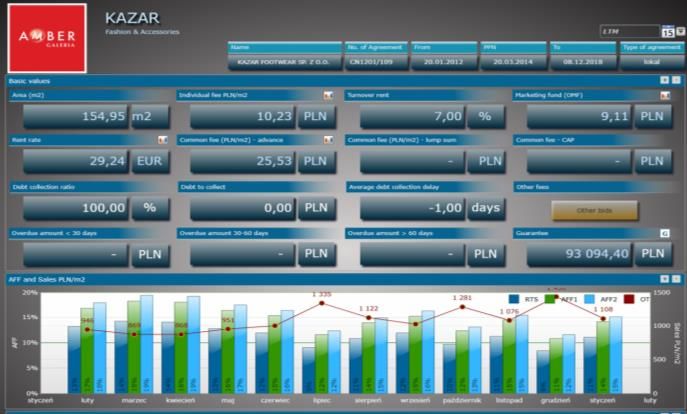
Section 1                                                                                                                                                                                                                                             5
                                                                                              EPP at a glance

                                                                                                                             Key corporate events

      Jan-16:                                                                                 Aug-16:                                                                          Apr-17:                               Jan-18:
      Incorporation of EPP in the                                                             EPP converted to                                                                 Equity raise of                       Equity raise of €113m through
      Netherlands as a private                                                                a public company                                                                 €149m through                         a private placement to finance
      limited liability company                                                                                                                                                a private                             acquisition of M1 tranche I
                                                                                                                                                                               placement

                                                   Jun-16:                                                                                     Aug/Sep-16:
                                                   Acquisition of 75% stake by Redefine                                                        Listing on the Luxembourg Stock Exchange
                                                   and subsequent decrease of stake to                                                         (Aug-16) and conducted a private placement
                                                   50% by on-sale of shares to a                                                               listing (€96m) on Johannesburg Stock
                                                   consortium of investors                                                                     Exchange (Sep-16)

                                                                                                                      Developments since listing1,2

                                                               €805m increase in portfolio value                                   339k sqm increase in                 Signing of the agreement to                  Galaxy extension opened in
                      11
                                                                     since incorporation                                                retail GLA                    acquire M1 portfolio consisting of                       Nov-17
                  acquisitions
                                                                          (Jun-16)4                                                  (since Q2 2016)                             12 assets                                (€3.1m NOI uplift)

                                                                                                                                                                     153
     Outlet Park extension opened in Sep-17                                                                                                                                                                192k GLA sqm of retail developments in
                                                                                              1,428 retail leases3                                                employees
                (€1.0m NOI uplift)                                                                                                                                                                                       Warsaw
                                                                                                                                                                   currently

Source:      EPP, 2017 Financial Results Presentation
1 As of March 2018                         3 Excluding leases of tranche I of M1 portfolio which are secured by a master lease until 2024
2 Incl. M1 tranche I acquisition           4 Excluding JVs
Section 1 6
EPP at a glance
Investment journey since listing to position EPP as the leading retail landlord in Poland
Recent portfolio transactions
Retail Retail Retail Office Office Office
Acquisition of Acquisition of Acquisition of Sale of A4 Business Sale of Sale of Tryton
Zakopianka Galeria Mlociny1 Galeria Solna Park (I, II, III) West Gate Business House
Date: May-17 Date: Jun-17 Date: Jul-17 Date: Dec-17 Date: Dec-17 Date: Dec-17
Location: Krakow Location: Warsaw Location: Inowroclaw Location: Katowice Location: Wroclaw Location: Gdansk
GLA: 26,142 GLA: 81,900 GLA: 23,627 GLA: 29,959 GLA: 16,533 GLA: 23,8752
+252k
sqm
Oct Nov Dec 2017 Jan Feb Mar Apr May Jun Jul Aug Sep Oct Nov Dec 2018 Jan of M1
retail
space3
Office Retail Office Retail Office Retail
Acquisition of ROFO office portfolio Development of A4 Business Park Acquisition of Blackstone portfolio O3 Business Campus Acquisition of M1 portfolio (tranche I)
Date: Dec-16 Towarowa 221 (III) Date: Jun-17 (II) Date: Jan-18
Date: Dec-16 Date: Apr-17 Date: Dec-17
O3 Business Campus (I) Wzorcownia Location: Czeladz
Completion: 2022/2023 Location: Katowice Location: Krakow
Location: Krakow Location: Wloclawek GLA: 53,600
Location: Warsaw GLA: 11,900 GLA: 18,950
GLA: 18,755 GLA: 25,455
GLA: 110,000
Location: Zabrze
GLA: 52,800
Tryton Business House Twierdza Zamosc
Location: Gdansk Location: Zamosc
GLA: 23,5372 GLA: 23,806 Location: Krakow
GLA: 49,600
Symetris (I) Twierdza Klodzko Location: Lodz
Location: Lodz Location: Klodzko GLA: 38,400
GLA: 9,595 GLA: 23,039
Source: EPP
1 30% owned by Echo Investment S.A. until development phase completion 3 Tranche II and III of M1 portfolio
2 Tryton Business House GLA increased from 23,537 sqm in Q4 2016 to 23,875 sqm in Q3 2017
Acquisitions Disposals
Section 1 7
EPP at a glance
Value of portfolio Key operating metrics
(€m) GLA (sqm) Footfall and sales No. of units
1,822 LFL (%)
638 7.0 1,4284
116
Retail
359 4.6 968
972 194
299 3.0 3.0
1,347 444
2016 2017 2016 2017 2016 2017 2016 2017
Standing value M1 tranche I Developments Footfall Sales
(€m) GLA (sqm) Occupancy (%) No. of tenants
95.8 96.0
Office
387 176 110
309 137 94
2016 2017 2016 2017 2016 2017 2016 2017
Portfolio breakdown1,2 Tenant mix1,3
WAULT: 3.8 years WAULT: 5.3 years
15% 6%
48%
5%
18% Fair value Total
income
41% 54%
GLA GLA
82%
46%
85%
International Polish chain Local
Retail Office
tenants tenants tenants
Source: EPP, 2017 Financial Results Presentation
1 As of January 2018 3 M1 tranche I not included due to existing masterlease agreement
2 Incl. M1 tranche I acquisition concluded in January 2018 4 Excluding leases of tranche I of M1 portfolio which are secured by a master lease until 2024
Section 1                                                                                                                                                                                                                                                 8
                                                                                 Why focus on retail in Poland?
Lack of high-street retail proposition prior to transformation enabled rapid growth in the number of shopping centres in Poland, which
remain the dominant format with 71% of market share, and makes the EPP portfolio particularly attractive
     Prior to transformation:                        1989-1995:                            1995-2000:                                                           2000-2005:                                    2005 onwards:
     •    95% of retailing controlled by             •   Strong reliance on outdoor        •   First hypermarkets opened by Auchan, Real, Carrefour             •    Large foreign real estate players        •    Multi-level urban schemes
          government owned entities                      market places                         and Geant                                                             invest in large malls in Poland
                                                                                                                                                                                                              •    Introduction of new formats:
                                                                                                                                                                     (e.g. Klepierre, Unibail-Rodamco)
     •    Only other formats were temporary          •   Emergence of small isolated       •   First three shopping malls built in Warsaw (Panorama,                                                               discounters, convenience
          and improvised selling points                  stores in sporadic                    Promenada, Bogusz Centre) to cater to the needs of               •    Hypermarkets complemented with                stores, outlet parks
                                                         unconnected locations                 wealthier clients                                                     large fashion offering
                                                                                                                                                                                                              •    Development of shopping
                                                                                           •   Other formats included a few department stores                                                                      centres in smaller cities
                                                                                               (Domy Towarowe: Wars, Sawa & Junior, Smyk)
                                                                                                                                                                                                              •    Starting from 2015, development
                                                                                           •   Opening of the first M1 in 1997                                                                                     of mixed-use schemes

Prior                                             1989                                  1995                                                                 2000                                          2005

                                              Limited new supply                                                                                                          Decreasing prime yields
New supply of shopping centres stock (000s sqm)                                                                                  Prime retail yields in major regional Polish cities (%)

   743

                                                                                                                                    8.0
                         615                607                612                                                                                                        7.5
                                                                                                                                                                                   7.0
                                                                                                                                                               6.8
                                   475                                                    459
               452                                                      443                                                                 6.3
                                                     425                                                                                               6.0                                  6.0      6.0    6.0      6.0
                                                                                  399
                                                                                                                                                                                                                               5.5
                                                                                                                                                                                                                                        5.3
                                                                                                                                                                                                                                                   5.0
                                                                                                    253       250

  2009A      2010A      2011A     2012A    2013A   2014A     2015A     2016A    2017A    2018F     2019F     2020F                2005A    2006    2007A       2008     2009A     2010    2011A     2012   2013A    2014     2015A     2016       2017A

Source:    CBRE, JLL, Savills
Section 1                                                                                                                                               9
                                                       EPP strategy

                 1     Create an income-generating retail champion                      2       Utilise strategic relationships

          • Leading Polish retail landlord focused on income generation             • Leverages relationships with tenants by exploiting economies of
                                                                                      scale
          • Dominant, defensible and sustainable portfolio
                                                                                    • Strong relationships in the international capital markets,
          • Consolidation of key retail assets in strategic locations                 particularly in South Africa

                 3     Maintain efficient operations through expertise                  4       Develop scale with prudent leverage

          • Experienced in-house asset and property management teams                • Growth has been primarily driven by acquisitions of
                                                                                      hand-picked retail assets and extensions
          • Excellent staff retention facilitating intellectual capital and long-
            term value generation                                                   • Going forward we expect to grow organically and inorganically
                                                                                      through extensions and acquisitions.

                                                                                    • Steady deleveraging towards the long-term LTV target of 45%

                                                                                    • Cautious liquidity management

Source:    EPP
Section 1 10
… Resulting in the largest retail portfolio in Poland …
One of the largest portfolio of retail assets in Poland… … widely recognized with prominent awards
GLA of retail assets in Poland (000s sqm)2
No. of properties2
18 21 9 12 6 8 11 6 2 3
2017 2017 2016 2016
Additional GLA following the
+489 acquistion of M1 tranche II, III, CIJ Awards Poland CEE Retail Awards Eurobuild Awards Eurobuild Awards
Marcelin and completion of Galeria Best Asset Management Property Management Shopping Centre of the Year – Shopping Centre Manager
Mlociny and Towarowa 22 Company of the Year Company Galeria Echo of the Year – Grzegorz Czekaj
639 596
428 412 412 2017 2017 2017
250
162 128 114 87
Eurobuild Awards 7th CEE Investment Awards 2006–2016 Deal of the
EPP¹ Atrium ECE NEPI Unibail Cromwell Immo- Klepierre GTC Global- The Real Estate Personality of Core+/Value Add Decade Awards
Rockcastle finanz worth³ the Year – Hadley Dean Investor Winner: Newcomer
… consisting of modern and well-invested buildings
Year of completion split by GLA (000s sqm)
Galaxy refurbishment and extension
Undergone refurbishment / extension since M1 tranche I assets • Opened in 2003 and fully refurbished in 2013
• Extension in 2017 resulted in additional 15,150 sqm GLA and €3.1m NOI uplift
91
Refurbishment usually carried Galeria Echo Kielce
out within 9-10 years from • Opened in 2002 and extended in 2011 to create one of the biggest shopping-entertainment
69 72
completion centers in Poland with almost 300 stores
54 57
50 48 Outlet Park
39 • Opened in 2012 and extended in 2015 and 2017
34
26 25 28
23 24 – 2017 extension resulted in additional 3,800 sqm GLA and €1.0m NOI uplift
Galeria Sudecka
• Opened in 2000 and redeveloped in 2015
1997 1998 1999 2000 2001 2002 2003 2007 2009 2010 2011 2012 2013 2014
Source: EPP, company information
1 Includes tranche I of M1 portfolio acquisition which closed in January 2018 3 Griffin portfolio acquired by Globalworth
2 Latest available data as of March 2018Section 1 11
… Outperforming the competition …
Retail assets sales performance EPP outperforming the competition
Footfall increase Polish Council of SC – turnover index (yoy change)
Footfall (million)
PLN/sqm
Footfall 2016 Footfall 2017
2.1% 2.2%
7.1% 1.8%
12 8.8% 2.3%
6.4%
8 8.1% (1.1%)
4.8% 6.2% 3.1% 4.5%
(0.1%) 2.0% (2.5%)
4
0
CH Veneda
Zakopianka
Galeria Solna
Olimpia
Grunwaldzki
Galeria
Galeria Amber
Galaxy
Outlet Park
Twierdza
Twierdza
Wzorcownia
Sudecka
Galeria
Zamość
Galeria
kłodzko
Włocławek
Echo
(2.6%)
Pasaż
2014 2015 2016 2017
Sales increase EPP turnover growth (yoy change)
Average monthly sales (PLN/sqm)
Average 2016 Average 2017 7.0%
6.7% 4.1% 0.5%
1,000 9.7% 3.3% 6.3% 7.1% 12.5% 6.0%
800 8.9% 5.9% 7.9%
10.2% 2.8% 3.0%
600 2.5%
400
200
0
Zakopianka
Veneda
Galeria
Galeria Amber
Olimpia
Galaxy
Galaeria
Outlet Park
Grunwaldzki
Wzorcownia
Twierdza
Twierdza
Sudecka
Galeria
Galeria
2014 2015 2016 2017
Zamość
kłodzko
Galeria
Echo
Solna
Galeria
Pasaż
Source: EPP, SavillsSection 1 12
… And well-positioned to take advantage
of e-commerce
Shopping centres in Poland are a social destination, making e-commerce channels far less of a substitute
1 Stores are expected to drive most of the retail sales growth … 2 … while online retail penetration should remain at moderate levels
Retail sales 2016A vs. 2022E (indexed to 100)
• In Poland retail is expected to remain resilient to online shopping – Poles associate visiting
Online retail as percentage of total retail In-store sales Online sales shopping centre with leisure
4.3 15.1 17.8 10.0 9.5 • There is a strong drive to focus on the development of the social aspects of social centres,
150 75% of growth which should further limit on-line shopping threat
125 coming from
in-store sales
“
100 Once gastronomy and leisure units occupied approx. 5-7% of shopping space, now this ratio
75 has increased to approximately to 10-15% with a few examples exceeding 20%. This ratio is
50 expected to grow even further in the future
25
0
Poland Germany UK France Netherlands
3 EPP's properties respond to customer needs … 4 … leveraging e-commerce to enhance shopping experience
GLA split by categories Speciality Electronics • Customers engage anywhere and at anytime via integrated, seamless experiences
3% Services
Goods
Household 1% • Showroom effect enhances the customer experience
4%
appliances & • Flagship stores increases the desirability of the brand
Accessories
5% • Omni-channelling increases brands’ recognition and appeal to widest range of customers
Health & • Click-n-collect provides an opportunity for the consumer to further interact with the brand
Beauty
6% and may lead to further in store sales
Food Court, Fashion & • Convenience of location and desirability of the shopping centre drives willingness of the
Restaurants & Accessories consumer to engage with retailer
Cafe 49%
3%
16% Traditional retail e-commerce
Entertainment
13%
Click-n-collect
Food /
Supermarkets
14%
Source: EPP, JLLSection 2 13
Key investment highlightsSection 2 14
Key investment highlights
1 Creating scale through organic and inorganic growth
2 Successful acquisition strategy supported by prudent financial management
3 Dominant and defensible portfolio of well-located shopping centres
4 Strong relationships with high quality tenants
5 Efficient, reliable and integrated operations platformSection 2 15
1 Creating scale through organic and inorganic growth
Organic growth Inorganic growth
NOI growth GLA extensions Developments External acquisitions
• Turnover increase • Extensions of 2 best-performing retail assets • 2 Warsaw projects under development with • Excellent access to additional opportunities
• CPI-indexing (Galaxy and Outlet Park) – full NOI impact yet to (GLA of 192k sqm) • Strong sourcing capabilities
• Tenant mix improvement initiatives be reflected • Galeria Mlociny to open in April 2019 • Plan to acquire King Cross Marcelin located in
• 3 other assets identified for future extension • Further upside from Towarowa 22, zoning Poznan and M1 tranche 2 and 3
• Upside for M1 assets expected to take place in 2018/2019 • Recycling of assets
Substantial NOI growth in 2016A-17A (54%), with further expansion expected between 2018E and 2020E
Value of EPP's portfolio (€m)1
No. of investments
9 9 93 93 6
– – – – 4
92 92 132 142 142
2,0144
1,623 1,693 309
1,359 1,367 359
420 422
387 392
1,203 1,271 1,347
972 975
Q4 2016 Q1 2017 Q2 2017 Q3 2017 Q4 2017
Retail M1 tranche I (retail) Office
Source: EPP
1 Defined as investment property value 3 Acquisition of A4 Business Park III; treated as one project together with A4 Business Park I/II
2 Galeria Olimpia and Centrum Echo Belchatow treated as one project 4 Pro forma for M1 tranche I acquisition completed in January 2018Section 2 16
2
Successful acquisition strategy supported by
prudent financial management
Reducing LTV Long debt maturity dates
LTV (%) (€m)
Average maturity: 3.9
83% hedged1
years
434
55.4%
47.4%
45%
179
151
102
81
11
FY FY Long-term 2018 2019 2020 2021 2022 >2022
2016 2017 target
Financial management guidelines
•
1 Leverage: sustain a sound balance sheet that is well within covenants and credit metrics 4• Operational costs: robust approval system and periodic monitoring of costs versus the
with a long-term target of 45% budget on a monthly (at properties and HQ level) and quarterly (overall for EPP) basis
•
2 Hedging: target to hedge 100% of interest rate exposure; currency of rental income 5• Dividend policy: intention to distribute 100% of distributable earnings to the shareholders;
matching the currency of EPP funding shareholders have the option to reinvest through DRIP programme
•
3 Credit risk: require tenants to pay rentals in advance and present security of the liabilities
resulting from lease agreements
Source: EPP
1 100% of the debt is assumed to be hedged in line with EPP policy; the remaining portion is unhedged due to one loan maturing in 2018Section 2 17
3
Dominant and defensible portfolio of
well-located shopping centres
EPP's geographically diversified portfolio encompasses three asset types targeting diverse customer groups
EPP retail assets Large urban shopping centres
• EPP's largest assets with a GLA of 48,000-72,000 sqm
• Located in Poland's largest and most affluent cities, very close to the city centres,
in densely populated areas
Szczecin • Strong fashion offering complemented by food, entertainment and F&B
Lomza • Usually competing with a handful of other malls in their vicinity
Inowroclaw
Wloclawek
Dominant regional shopping centres
Warsaw1
Kalisz • EPP's smaller format with a GLA of 15,000-55,000 sqm
Lodz
• Located in strong regional cities
Belchatow • Critical mass enhanced by entertainment
Jelenia Gora Wroclaw Zamosc • Very limited competition, usually limited to much smaller formats
Kielce (e.g. hypermarkets or smaller retail parks)
Czeladz
Zabrze
Klodzko Krakow
Przemysl Outlet parks / stand-alone retail schemes
• Category includes Outlet Park Szczecin (GLA of c.28,300 sqm) and Centrum
Handlowe Przemysl (GLA of c.6,000 sqm)
• Located in either smaller cities or outskirts of larger cities in less densely populated
Urban shopping centres areas
Regional shopping centres • Competition mainly from other nearby hypermarkets or larger malls in city centres
Outlet parks / stand-alone retail schemes but usually catering mainly to the population living in its close vicinity
Source: EPP
1 Including development projects (Towarowa 22 and Galeria Mlociny)Section 2 18
4 Strong relationships with high quality tenants
A diversified portfolio with blue chip and international tenant base Top 10 retail tenants
• Portfolio diversified in terms of footfall and NOI which creates a strong negotiating position No. Tenant name Rental income (€/month) % share in total
• In 2017, retail accounted for 82% of GLA and 85% of fair value, while office for 18% and 15% respectively 1 542,712 8.1%
• Retail assets are let out to leading retailers with international brands and mature, strong Polish retail chains (e.g. LPP 2 352,648 5.3%
with a market cap. of €4.0bn, CCC with a market cap. of €2.7bn), diversifying EPP's macro exposure 3 154,096 2.3%
• Cumulative top 10 retail and office tenants represent only 32% of total rental income 4 147,368 2.2%
• Office space leased to blue chip tenants 5 131,509 2.0%
Split by types – retail tenants1 Split by types – office tenants1 6 128,400 1.9%
7 125,599 1.9%
8 125,371 1.9%
7% 2%
9 108,395 1.6%
43% 10 103,344 1.5%
5% 2%
GLA 30% Leading CEE retailers
66%
44% 51%
Total income 32% 68%
Top 10 office tenants
50%
No. Tenant name Rental income (€/month) % share in total
1 154,013 9.1%
2 138,781 8.3%
3 103,103 6.1%
4 61,156 3.6%
International tenants Polish chain tenants Local tenants
5 61,148 3.6%
6 57,037 3.4%
Other tenants 7 51,590 3.1%
8 49,419 2.9%
9 48,152 2.9%
10 47,355 2.8%
Source: EPP, Factset as of 24 May 2018
1 As of FY 2017Section 2 19
6 Efficient, reliable and integrated operations
platform—proprietary management system
Main functions
1 2
Asset portfolio monitoring Immediate identification of potential tenants' issues
• Performance overview at asset-level incl. sales density, footfall, RTS and • Drill down option – macro to micro perspective, using the tenant panel and
OCR and debt collection ratios for each EPP property all in one dashboard heat maps
• Allows effective decision-making process based on real-time data • Overview of key KPIs at tenant-level: RTS, OCR, debt collection ratios, SC
rates, rent reductions, sales density and sales, footfall and opex reports
Dashboard with a
Visualisations and key facts Macro and micro level
holistic and handy heat maps and Key lease term and
overview of key efficiency levels of performance KPIs
metrics shopping galleries
EPP has developed internally a proprietary tool which enables it to control key property and tenants' KPIs
Source: EPPSection 2 20
6 Efficient, reliable and integrated operations
platform—EPP University
EPP University attracts both smaller and large tenants; offered sessions are also popular among sales assistants of established
international retail chains
1 2 3
Overview
Ability to identify potential
Improvement of performance of Attracting smaller tenants with
problems early and prevent
• EPP University platform was developed to clients leading to rental growth rents higher than larger tenants
long-term voids
support tenants in daily operations and is run
by a team of 4 professionals
• Tenants’ staff provided with professional Key EPP University personnel
training on most important performance factors
includes: • More than 18 years of experience, including creating and developing customer awareness
– effective sales techniques of recognized foreign and Polish brands such as Zara, Orsay, Motivi, Vero Moda, Camaieu,
Tatuum and Gino Rossi
– customers’ typology
• For the last 9 years Roksana held various managerial positions and joined EPP as a Retail
– building a receipt Roksana Bialecka Manager in June 2014
Head of University Retail • Roksana is an expert in training in areas such as sales, visual merchandising and business
– selling on the shop front Tenants Management
– business KPIs analysis
Tenants’ KPIs before and after EPP University training
• Units workshop with tenants’ staff includes:
– planning the optimum store layout, Sales density Sales density
positioning of the best sellers Tenants Project (€/sqm/p.a.) RTS OCR (€/sqm/p.a.) RTS OCR
Before After
– effective visual merchandising
implementation Specialist Store Pasaz Grunwaldzki 805 27.2% 42.2% 2,014 10.9% 18.9%
– interior shop design and shop fronts Fashion retailer Galeria Echo 1,631 20.5% 29.8% 2,100 16.4% 23.8%
improvement
Jeweller Pasaz Grunwaldzki 3,887 20.1% 24.8% 5,925 12.9% 16.9%
Source: EPPSection 3 21
Poland – attractive investment destinationSection 3 22
Stable fiscal environment with low interest rates
and falling unemployment …
1 Low level of public debt 2 Falling unemployment rate
Public debt as percentage of GDP (%, 2017A); sovereign ratings (Moody's/S&P) Unemployment rate in Poland (%)
12.8
179 12.1 12.3
132 126 A2/BBB+
103 98 97 9.8
88 78 74 68 64 8.9
51 51
35 Unemployment is
historically low, below 6.8 6.6 6.5
natural level
Belgium
Portugal
France
Austria
Ireland
Italy
UK
Poland
Hungary
Germany
Slovakia
Spain
Czech Rep.
Greece
2008 2009 2010 2011 2012 2013 2014 2015 2016 2017 2018F 2019F 2020F 2021F 2022F
3 Rising real wages 4 Significant boost from consumer spending
Percentage change in hourly wages in local currency (%) Consumer spending in Poland (US$bn)
102.0
4.9 5.1 Consumer confidence index in Poland
4.7 4.7 4.7 (100=long-term average)
4.3 342
4.1
3.5
3.8
3.5 325
309
2.5 2.6 2.5 292
2.1 2.3 2.4 275
1.8 252 261 266
1.6 1.4 1.5 254
1.1
0.6
2012 2013 2014 2015 2016 2017 2018F 2019F 2020F 2021F 2022F 2012A 2013A 2014A 2015A 2016A 2017B 2018F 2019F 2020F
Western Europe¹ Poland
Source: Economist Intelligence Unit, Eurostat, Datastream, Moody's, S&P ratings, Analyst research, Factset as of 24 May 2018
1 Western Europe (EU15)—Austria, Belgium, Denmark, Finland, France, Germany, Greece, Ireland, Italy, Luxembourg, Netherlands, Portugal, Spain, Sweden, UKSection 3 23
… Making Poland a highly attractive retail investment destination
1 Impressive growth in retail sales 2 High future growth projections
Retail sales change between years 2004-2016 10-year growth forecast of retail spending per capita (2017-2027E)¹
95%
70% Tricity
Szczecin Olsztyn
45% Above 28.0%
Bydgoszcz Bialystok
20% Between 26.5% and 27.9%
Warsaw
(5%) Zielona Gora Poznan
Lodz Between 25.0% and 26.4%
(30%) Wroclaw Lublin
Opole Kielce
Poland
Hungary
Republic
Germany
France
Spain
Below 25.0%
Czech
Katowice
Krakow Rzeszow
3 Decreasing supply of new shopping centres stock 4 Saturation of shopping centres well below Western Europe and the US
Shopping centre pipeline in Poland (sqm) Existing shopping centre stock (GLA in sqm per 1,000 inhabitants)
600,000 N/A 31% 23% 29% 26% 42% 18% 24% 29% 32% 19% 49% 50% 66% 78% 37%
1,200
400,000
800
200,000
400
0 0
Poland
Finland
Portugal
Greece
Luxembourg
US
Ireland
Sweden
UK
Czech Rep.
Slovakia
Italy
Netherlands
Turkey
Spain
France
2009A
2010A
2011A
2012A
2013A
2014A
2015A
2016A
2017A
2018F
2019F
Supply yearly Under construction Planned
x% Proportion of the last 10 year completions of total existing stock (January 2017)
Source: Oxford Economics, JLL
1 Above analysis is based on the modern retail stock defined as retail schemes exceeding 5,000 sqm of gross leasable area (GLA), delivered or refurbished after 1990Section 4 24
M1 portfolio update, Marcelin and
DevelopmentsSection 4 25
M1 transaction rationale
Transaction rationale Assets highlights
Scale Location
40% of
Polish • Through the • Sites in large catchment areas, generally situated along the motorway at
population combined scale of major junctions (land base >200 ha)
is within a EPP and M1
30-min portfolio, the
drive time Tenants
company is able to
attract retail market • Master lease provided by Metro AG (rated BBB-/Ba1), supported by a
leaders and assist strong tenant mix including top brands: Auchan, OBI, MediaMarkt, TK
with their growth Maxx, H&M, C&A
120 million aspirations
Bespoke shopping centres
annual
footfall
• Food and DIY anchored with top international brands providing
combined
the greatest retail offer and best prices
Additional value potential
Active asset management Extensions
• Increase the F&B and entertainment offerings
• Right-size retail units • Potential to increase the GLA by 8-10% and NOI by 10-15%
• Boost the short-term leases income • Increase of the existing rents
• Optimise costs
Source: EPPSection 4 26
M1 portfolio overview
EPP agreed to acquire portfolio of twelve M1 assets in 3 tranches. Tranche I was closed in January 2018, tranche II and III to follow in
June 2019 and June 2020, respectively
Key portfolio statistics Tenants
Tenant mix (NRI) Tenant mix (GLA)
GLA (sqm): Sustainable NOI:
446,500 €49.0m
Auchan Other
tenants Auchan
Other 36%
30% 38%
tenants
43%
Entry yield¹: Vacancy:
7.1% 1.8%
Media Media
Markt OBI Markt OBI
8% 13% 10% 22%
RTS: WALT by GLA²:
8.9% 6.4 years
Further upside Development Auchan – no. 1 hypermarket OBI – the leading DIY operator with MediaMarkt – German-based
from GLA yield: operator in Poland and 5th largest over 50 stores in Poland and a leading consumer electronic retailer
extension 8–10% worldwide; a 20 year track record in 19 year track record in the Polish with over 60 stores in Poland and a
the Polish market; 7 year market; 15 existing lease 19-year track record on the Polish
agreements with Auchan agreements in place market; opportunity to decrease
space and re-rent at better rates
Selected other brands
Source: EPP
1 Acquisition
yield excluding transaction costs; 6.8% for the total portfolio including transaction costs
2 End of Master LeaseSection 4 27
Potential for further development of M1 assets
Improvement of entertainment and
Space available for extensions Tenants restructuring Refurbishments
food courts
• Following the preliminary internal audit • Adjustments to tenant mix to maximise • A way of increasing the assets' • Potential to include tenants providing
and modelling exercise to assess the NOI by replacing poorly performing attractiveness to customers by leisure services at 5 of the analysed 7
profitability of the potential projects, 7 tenants with new sought-after retailers adapting to the 'cross-channel' era assets
assets have been identified to have or service providers caused by growing online retail
extension potential penetration and hence recalibrating • Facilities to include modern food
• Ability to improve shopping experience the assets' positioning courts, fitness centres and cinemas
• Upside for total GLA increase of c.10% by widening the base of various tenant
and NOI of c.12-15% types and introducing new services • Energy-efficiency improvements • Increases the overall attractiveness of
the mall and time spent shopping,
• Detailed audit to be carried out in 2018 • Aligning the tenant mix to respond to • Resulting in better tenant retention and reducing substitutability of the
the shoppers' increasing spending higher footfall experience with e-commerce
power and changing preferences
Assessment of alternative use of land next to the existing M1 assets: residential, industrial purposes and big boxes
Source: EPPSection 4 28
Contractual growth pipeline in retail from M1
Pro-forma impact of the committed M1 portfolio acquisition1
Tranche I Tranche II Tranche III
2017YE
January 2018 June 2019 June 2020
Retail properties 14 +4 18 +6 24 +2 26
Retail GLA (000) 444 +194 639 +184 823 +68 891
Retail portfolio value (€m) 1,352 +359 1,710 +222 1,933 +111 2,044
Office Office Office Office
24% 18% 14% 13%
GLA split
Retail Retail
76% Retail Retail
82% 86% 87%
113 121
Retail NOI (€m) 97
72
Selected tenants
Source: EPP
1 Pro-forma as of FY 2017 assuming no retail / office acquisitions or disposals other than M1 portfolioSection 4 29
Marcelin transaction rationale
Assets highlights
Strong catchment area
• Located in the affluent western part of Poznan
• Isolated catchment area of approx. 350,000 within a 30 min drive
Tenants – Complimentary to current portfolio
Auchan, H&M, Reserved, Pepco, CCC, New Yorker, Jysk, Media Markt,
Empik, Super-Pharm
Dominant shopping centre in its catchment
• Food anchored with top international brands providing the greatest retail
offer and best prices
Additional value potential and growth
Active asset management Extensions and potential footfall increase
• Currently no F&B offering • Potential to extension on the first floor
• Right-size retail units • Project neighbouring a large office complex Business Garden
Poznan 135,000 m2 is currently under construction which will
• Significant demand from new tenants to improve mix attract an additional 12,000 people daily to the catchment area.
• Optimisation costs
Source: EPPSection 4 30
Strategic developments: large, well-integrated
developments in attractive locations in the capital city
Galeria Mlociny1 Towarowa 222
• Retail development located in the North-West part of Warsaw, conveniently • Last large retail development in Warsaw and the last to be built near the city-centre
located next to a rapidly growing residential area – Mlociny • The property is the biggest commercial area located in the centre of Warsaw (next
• Mlociny is the main public transport (incl. a metro line) hub used daily by to the metro line) with total area of c. 6.2ha
c. 40,000 people • Zoning process scheduled for 2018/2019
• 1.5 million people within 30 minutes drive • Potential for additional 45,000 sqm of mixed-use: residential, office, hotel
• Opening planned for April 2019 with construction ahead of the schedule • Strong interest from all main anchor tenants
• The largest retail construction site in Poland; 75% of GLA already leased
Planned total GLA 81,900 sqm Planned total GLA 110,000 sqm
Est. cost of Est. cost of
€300m €420m
development3 development3
Est. fully-let NOI €21m Est. fully-let NOI €34m
Est. yield on cost c. 7.0% Est. yield on cost c. 8%
Est. valuation yield Est. valuation
c. 5.75% c. 5%
on completion yield on completion
Est. value on Est. value on
€365m €680m
completion completion
Construction of one asset at a time
Q3 2016 March 2019 2020/2021
Start of construction of Completion of Start of construction
Galeria Mlociny Galeria Mlociny of Towarowa 22
2018/2019 April 2019
Source: EPP
1 70% owned by EPP, 30% by Echo Investment Zoning process for Opening of
2 Fair value reflects 54% of the value of the land plot Towarowa 22 Galeria Mlociny
2 Land includedSection 5 31
Update on the office disposal processSection 5 32
Flexible terms of ROFO agreements allow EPP
to realise profits on disposals of office and retail assets
EPP has options to buy, sell or waive all its ROFO assets
GLA NOI
Project name Location (000' sqm) (€m) Status
Symetris II Lodz 9.7 1.6 Authorized to acquire Symetris II until 30.09.2019
O3 Business Park III Krakow 18.9 3.3 Authorized to acquire O3 Business Park III until 30.09.2019
Sagittarius Wroclaw 24.9 4.5 Waived ROFO, we will participate in profit share
Libero Katowice 45.1 9.0 Waived ROFO, we will participate in profit share
Symetris II O3 Business Park III Sagittarius1 Libero1
Source: EPP
1 ROFO assets intended for sale (EPP owns 25% of the assets, with remaining 75% being ROFO) Retail OfficeSection 5 33
Disposals of office assets
• EPP invests in offices only on an Tranche sold in October 2017
opportunistic basis
Tryton Business West Gate
• Acquired office assets are intended to be A4 Business
Park House Wroclaw
disposed of at a profit Katowice Gdansk GLA: 16,532 sqm
GLA: 29,900 sqm GLA: 23,537 sqm
• EPP’s aim is to focus solely on retail assets
in the long-term and continue with the
stated disposal strategy of office real estate
Tranche being currently for sale
• In December 2017, EPP disposed of A4
Business Park, Tryton Business House and Malta Office Park Symetris (I & II)
West Gate for a total consideration of Poznan Lodz
€160m GLA: 28,270 sqm GLA: 19,000 sqm
• Sale process of O3 Business Park, Malta
and Symetris Business Park was initiated at
the beginning of the year and we currently
offers for all three assets put for sale
O3 Business
• Disposals on track for year end Park (I, II, III)
Krakow
GLA: 56,926 sqm
Source: EPPSection 6 34
Historical financialsSection 6 35
Key historical financial highlights
Historical development of financials LTV and ICR
NOI (€m) Net LTV1 (%) Total debt / Total assets (%)
+16%
• Significant increase on the
103 back of recent retail asset 55.0 54.1
89
67 acquisitions with an 47.4 45.0
additional retail GLA of
145k sqm
FY2016 FY2017 Target at IPO
(FY2017) 49.6
EBITDA excl. fair value gains (€m)
+7%
87 81 • EBITDA grew by 61% due 2016A 2017A Target 2016A 2017A
54 to acquisitions and
effective asset and Net debt / (Net debt + Equity)1 (%) EBITDA interest coverage (x)
property management
FY2016 FY2017 Target at IPO 56.5
4.2
(FY2017)
3.4
Distributable earnings (€m)
+20% • NOI increases and cost
stabilisation has resulted
50.6
in substantial distributable
77
64 earning growth of 126%
34 • Higher than forecasted
despite changes to CIT
FY2016 FY2017 Target at IPO
(FY2017) 2016A 2017A 2016A 2017A
Source: EPP
1 Net debt defined as Debt less cash available, excluding depositsSection 7 36
ConclusionSection 7 37
Key takeaways
1 We are the leading Polish retail landlord 2 Profitable and well positioned portfolio
• Retail landlord focused on income generation • Limited new supply and lack of high street alternative
• Dominant, defensible and sustainable portfolio • Footfall and tenants’ turnover has increase across the portfolio
• Cash generative assets in key strategic locations • Scale makes us the ‘go-to’ landlord for retail clients
• Coverage of 40% of the national catchment area post tranche III of • Positive Polish macro and real estate market backdrop
M1 transaction
• NOI and asset value growth
Leading operational platform delivers competitive
3 4 Prudent Financial & Corporate Management
advantage
• Experienced asset and property management delivering NOI • Debt materially reduced since IPO to LTV 47.4% at y/e 2017 and
growth long-run target 45%
• Excellent staff retention deepens relationships with tenants • Deep banking relationships enhanced by prospective bond issue
• Proprietary management information system & EPP University • Recycling of assets into higher value properties
enable proactive tenant management
• Strong culture of Corporate Governance
• Support of key institutional shareholders
Source: EPPAppendix A 38 Additional materials
Appendix A 39
Dominant and defensible portfolio of well-located shopping centres
EPP portfolio assets are located in the largest Polish cities and offer exposure to attractive local markets where competition is still
limited while consumer demand is growing rapidly
Properties located in prosperous regions List of EPP properties
Completion / latest Fair value GLA
Inowroclaw
Wloclawek Purchasing power per capita Property Location refurbishment (€m) (sqm)
Poznan index
Belchatow Retail
Szczecin
1 Galaxy (incl. extension) Szczecin 2003/2013/2017 275 56,627
Lowest
2 Pasaz Grunwaldzki Wroclaw 2007/20166 252 48,366
6
1 5 Lomza 3 Galeria Echo Kielce 2002/2011 223 71,650
12
4 Zakopianka Retail Park Krakow 1998 56 26,142
14 After the acquisition of all 5 Galeria Amber Kalisz 2014 88 33,599
8 Warsaw three M1 tranches, EPP’s 6 Outlet Park (incl. extension) Szczecin 2012/2015/2017 92 28,283
1 19 portfolio will cover 40% of 7 Galeria Sudecka Jelenia Gora 2000/2015 57 30,268
20 3 Average
5 18 Poland where the 8 Wzorcownia Wloclawek 2009 51 25,455
6 Lodz spending power is 25% 9 Twierdza Zamosc 2011 52 23,806
11 higher than Poland's
Kalisz 2 Zamosc 10 Twierdza Klodzko 2010 49 23,039
7 3 4 average5
9 11 Galeria Olimpia1 Belchatow 2000/2012 55 32,703
Jelenia Gora 12 Galeria Veneda Lomza 2013 39 15,026
10 16 15
Klodzko Highest 13 Centrum Handlowe Przemysl 2000/2012 5 5,759
17 4
2 13
Przemysl Retail properties 14 Galeria Solna Inowroclaw 2013 59 23,627
Wroclaw 15 M1 - Czeladz Czeladz 1997/2008 123 53,650
Zabrze Czeladz Office properties
Kielce 16 M1 - Zabrze Zabrze 1999 75 52,775
Krakow 17 M1 - Krakow Krakow 2001/2011 126 49,617
18 M1 - Lodz Lodz 1999 34 38,396
Yielding assets split (GLA split by city)3 Total Retail 1,710 638,788
Retail4 Office Retail – Developments
Szczecin Lodz 19 Towarowa 222 Warsaw 2022/2023 c. 420 110,000
Other 13% Szczecin 7% Galeria Mlociny2 Warsaw 2019 c. 295 81,900
20
23% 10% Krakow Total Retail (incl. Developments) 2,425 830,688
Krakow 28%
Office
12% Kielce
Belchatow 10% 1 Malta Office Park Poznan 2011 62 28,270
5% 2 O3 Business Campus (I, II) Krakow 2016/2018 93 37,846
Kalisz Kielce 3 Park Rozwoju (I, II) Warsaw 2014/2015 72 33,475
5% 11%
4 Astra Park Kielce 2007 31 14,269
Lodz Poznan Warsaw
Czeladz 5 Oxygen Szczecin 2010 28 13,902
6% 21% 24%
Wroclaw Zabrze 8% 6 Symetris I Lodz 2016 23 9,595
8% 8%
Total Office 309 137,357
Source: EPP, GfK Polonia 2017
1 Includes Galeria Olimpia and Centrum Handlowe Belchatow 3 As of January 2018 5 Based on catchment area within 30 minutes drive time
2 70% owned by EPP, 30% by Echo Investment 4 Incl. M1 tranche I acquisition concluded in January 2018 6 Partial refurbishment in Q1 2016Appendix A 40
Efficient, reliable and integrated operations platform
EPP has assembled a team of highly experienced professionals which offers comprehensive asset and property management
services of the highest quality
Experienced and recognised asset and property manager EPP AM/PM capabilities
• A highly experienced employee base recruited both externally and inherited
from Echo Investments prior to portfolio transfer to EPP, which ensured PM AM
continuity of management and experience with each asset and the tenants
Facility
Marketing
• Manages multiple shopping centres and offices across Poland Management Retail Leasing
Management Team
Team
Budgeting
Echo Investment
EPP
Reporting & Management
Property
1,428 retail University
Analysis Team
Total GLA units3 Office Leasing
124
c. 776k Team
94 office employees2 Integration Office
sqm
tenants Team 6 projects1
Office team Construction and
• EPP's property management can offer access to the entire real estate value Development Team
chain Echo Investment
Property
Property Management
• Unrivalled leasing capabilities resulting from well-established relationships Managers
with large, international tenants who trust EPP's expertise and expand Architecture
together in Poland Team
Retail team
• EPP’s in-house development and asset management team has been
recognized over the years with many awards Lease
Shopping Mall Retail
Administration
Directors 18 projects1 Legal
Managers
Department
Echo Investment
Marketing Technical
Property Management
2017 2017 2017 Managers Managers
Financial and
Financial & Accounting Managers Accounting
Europa Property Awards CIJ Awards Eurobuild Awards Department
Core+/Value Add Investor Best Asset Management Company Property Management Company
Source: EPP, press
1 As of January 2018 3 Excluding leases of tranche I of M1 portfolio which are secured by a master
2 Includes 9 employees of the Asset Management team and 115 employees of the Property Management team lease until 2024Appendix A 41
Case study: effectively leveraging existing tenant relationships
Sought-after locations with loyal tenants growing with EPP
• Founded in 1991, LPP, given its range of brands, is referred to as 'Polish Inditex' with • Founded in 1996, CCC is the biggest Polish shoe retailer
more than 1,700 stores worldwide, 1,000 of which are located in Poland • It operates 438 stores in Poland and more than 500 stores in other European
• Portfolio consists of 5 fashion brands: Reserved, Mohito, Cropp, House and Sinsay countries
• Market capitalisation of c.€4.0bn • Market capitalisation of c.€2.7bn
• Sells c. 140 million products every year • Over 263 million customers visited CCC stores in 2017
• Currently LPP has over 70 stores in EPP shopping centres • Currently CCC has 17 stores in EPP shopping centres
– further extensions of stores have already been planned – further extensions of stores have already been planned
LPP and CCC in EPP's shopping centres
Galaxy Szczecin Galeria Echo
First store
1,223 385 861 169
GLA (sqm):
2003: First CCC store opened (385 sqm) 2002: First LPP store opened (861 sqm)
2003: First LPP store opened (1,223 sqm) 2002: First CCC store opened (169 sqm)
2011: Reserved store extension in
a new, two-level format (1,430 sqm) 2011: Extension of the store in a new
2014: Stores with new brands introduced: format to 419 sqm
2013: Extension of the store to 552 sqm
Sinsay (580 sqm) and Cropp (590 sqm) 2013: Stores with new brands introduced:
Mohito and Sinsay (787 sqm)
2014: Further extension of the store to 668
sqm
2017: Opening of one of the biggest Reserved
2017: Opening of the latest concept 2018: House store extension in the latest
stores in Poland on two levels (2,613 sqm)
store on two levels (2,267 sqm) – the biggest format opened (550 sqm); further extension 2018: Planned opening of the latest
CCC store in Poland at that time of Reserved store (up to 2,500 sqm) concept store with 1,500 sqm (in talks)
Stores with new brands introduced:
already planned
House (480 sqm) and Mohito (442 sqm)
Current total
4,700 2,267 3,000 1,500
GLA (sqm):
Source: EPP, Factset as of 24 May 2018 LPP CCCAppendix A 42
Case study: extensions
Identifying new extensions Galaxy extension (completed 15 November 2017)
+15,150 sqm
GLA 41,477 56,627
• EPP identifies assets where it has the right to
construct an extension +€3.1m
NOI 11.4 14.5
• Internal audit is carried out by architects to
assess the feasibility of increasing GLA New tenants
• €3.1 million NOI uplift – €50 million uplift in value
• 1.1 million visitors in November – best month ever
• Once GLA extension size is estimated, the • 950k increase in number of visitors within 5 months (+20% LFL)
development department prepares the • 45 new stores in 15,150 sqm GLA
profitability model based on leasing and
construction data Outlet Park extension (completed September 2017)
+3,800 sqm
• Leasing team starts approaching potential GLA 24,483 28,283
tenants. Financing and FC secured
+€1.0m
NOI 4.5 5.5
• Construction starts when 75% of GLA leased
(based on conditional contracts with tenants) • 21 new stores totaling 3,800 sqm GLA New tenants
• €1.0 million NOI uplift – €17 million uplift in value
• Board decision based on positive outcome of • 42% sales increase since opening in 2012
the model, financing and FC availability and • 53% footfall increase since opening in 2012
minimum 75% of GLA being already leased • 140k increase in number of visitors during the first 4 months
Both extensions completed on time
Source: EPPAppendix A 43
New proposed changes to the Polish legislation
affecting commercial real estate sector
Tax on commercial real estate Sunday trading ban
• The tax is levied on owners of commercial and office real estate and came into • In November 2017, Poland's Lower House of Parliament passed a law
force on 1 January 2018 restricting Sunday sales to two Sundays per month
Proposed change
• It is a tax of 0.42% a year on real estate assets with value >PLN 10 million • Shopping restriction came into force in March 2018
(first PLN10m are tax exempt)
• The bill foresees limiting trading to one Sunday per month in 2019 and 7
• Assets value is based on their initial value, not depreciated but adjusted for capex Sundays a year from 2020 onwards
• Such assets include: shopping malls, departments stores, stand-alone shops or • Currently Austria, Belgium, Cyprus, France, Germany, Greece, Hungary,
boutiques, service/trade buildings, office buildings (office buildings for own use are Netherlands, Norway and Spain have restrictions on Sunday trading
excluded)
• Exemptions for F&B, entertainment, fitness, bakeries, flower shops and others
• The tax sets a minimum amount of tax that has to be paid even in the case of
company generating losses, however, it is not to be paid in addition to CIT
• Estimated increase of the effective tax rate in 2018 by c.2-3pp • According to UBS research, the loss in revenues should be to a large extent
offset by cost reductions and increased footfall and turnovers during other days
Impact on EPP
of the week
• The Hungarian example suggests that the distortions are likely
to be temporary – following the introduction of the restrictions, retail sales
momentum slowed down but returned to normal within two months
• Shopping centres are defining new operation principles e.g. prolonged opening
hours to help customers’ to change their shopping habits
Source: EPP, press releases, UBS researchYou can also read