Experimental and computational evaluation of cyclic solvent injection in fractured tight hydrocarbon reservoirs - Nature
←
→
Page content transcription
If your browser does not render page correctly, please read the page content below
www.nature.com/scientificreports
OPEN Experimental and computational
evaluation of cyclic solvent
injection in fractured tight
hydrocarbon reservoirs
Amin Ghanizadeh*, Chengyao Song, Hamidreza Hamdi & Christopher R. Clarkson
Multi-fractured horizontal wells have enabled commercial production from low-permeability (‘tight’)
hydrocarbon reservoirs but recoveries remain exceedingly small (< 5–10%). As a result, operators
have investigated the use of solvent (gas) injection schemes, such as huff-n-puff (HNP), to improve oil
recovery. Previous HNP laboratory approaches, classified primary as ‘flow-through-matrix’ and ‘flow-
around-matrix’ typically (1) are not fully representative of field conditions at near-fracture regions and
(2) require long test times, even when performed on fractured cores. The objectives of this proof-of-
concept study are to (1) design and implement a new experimental procedure that better reproduces
HNP schemes in near-fracture regions and (2) use the results, simulated with a compositional lab-
calibrated model, to explore the controls on enhanced hydrocarbon recovery in depleted tight oil
plays. Performing multiple CO2 and (simplified) lean gas HNP cycles, the integrated experimental and
simulation approach proposed herein achieves the ultimate recovery factors in a significantly shorter
time frame (25–50%) compared to previous studies. The integrated experimental and computational
approach proposed herein is valuable for core-based evaluation of cyclic solvent (CO2, CH4) injection
in tight hydrocarbon reservoirs for (1) hydrocarbon recovery and (2) subsurface greenhouse (CO2, CH4)
gas disposal/storage applications.
Hydrocarbon liquid-rich shale plays are currently the hottest unconventional reservoir targets in North America.
However, the majority of development has focused on primary depletion with multi-fractured horizontal wells,
and hydrocarbon liquid recovery is projected to be low (˂5–10%). Further, the current recovery process is
inefficient in the majority of tight oil plays, and does not offer a solution to reducing greenhouse gas emissions.
A potential solution is to inject CO2, or reinject produced (lean/rich) gas recovered from the reservoir, or a
combination of both, back into multi-fractured horizontal wells for the purpose of simultaneously increasing
liquid hydrocarbon recovery (condensate or oil), and reducing greenhouse gas ( CO2, CH4) emissions. The cyclic
solvent injection process, commonly referred to as huff-n-puff (HNP), with CO2 and/or lean gas as the ‘solvent’,
is a potentially attractive mechanism for co-optimization of greenhouse gas sequestration and enhanced oil
recovery (EOR) because, unlike solvent (e.g. C O2) flooding and water-alternating-gas flooding (e.g. C O2-WAG)
(dedicated injection and producing wells) scenarios, large expenditures on specialized facilities, in-field pipe-
lines and well conversions are unnecessary. Despite these advantages, industry requires critical data, evaluation
methods, and supporting simulation studies in order to make a decision on whether to invest capital in piloting
the HNP process in their operated wells/fields.
A summary of the theory behind the HNP process in tight hydrocarbon systems is provided in Supplementary
Appendix S1 online. There are now numerous studies of improved oil recovery in a variety of North American
tight oil reservoirs that have examined the feasibility of incremental oil recovery using gas injection1–6. These
studies have primarily focused on n umerical2,3,6 or laboratory-based a pproaches1,7–9. Laboratory-based studies
are important for assessing (1) the key mechanisms controlling injected gas transport into the reservoir, and
miscibility with the oil7,8,10 and (2) the influence of operational parameters including injection pressure/time,
soaking time, production pressure/time—among other factors (e.g. PVT)—on recovery p erformance7,11. Further,
laboratory-based analyses are required to (1) understand the underlying physics and (2) constrain simulation
models used for HNP schemes. By matching the laboratory results (e.g. recovery factors, oil/gas production)
using rigorous fine-scale numerical simulation models, critical parameters that can be used in evaluating field-
scale EOR pilots may be obtained.
Department of Geoscience, University of Calgary, Calgary, Canada. *email: aghaniza@ucalgary.ca
Scientific Reports | (2021) 11:9497 | https://doi.org/10.1038/s41598-021-88247-y 1
Vol.:(0123456789)
www.nature.com/scientificreports/
Figure 1. Use of biaxial coreholder to induce fractures in core plugs under stress and measure gas fracture
permeability (a); example of core plug sample (Duvernay Formation, western Canada) fractured under
differential stress in biaxial coreholder (b); example of unpropped fracture permeability measurements (c).
Modified after Ghanizadeh et al.23 and Zhang et al.24.
The experimental studies of cyclic solvent injection in tight hydrocarbon systems performed to date are
extensive, providing much insight into the fundamental mechanisms and controlling factors, but have some
limitations (Supplementary Table S1 online). The majority of previous laboratory studies have been performed
on core plug samples with permeability values down to the microdarcy/millidarcy r ange12,13 until now, very few
laboratory-based studies8,14–17 have been conducted on tight hydrocarbon systems with permeability values down
to the nanodarcy range (a common permeability range for unconventional hydrocarbon reservoirs). Further,
the laboratory methodologies are primarily focused on intact (‘unfractured’) core plug samples using either
the ‘flow-through-matrix’12,18,19 or ‘flow-around-matrix’1,20,21 schemes, which do not realistically represent the
fracture-matrix contact or sequences associated with a typical cyclic solvent injection (HNP) process. While
seminal works have been conducted to mimic HNP process on fractured c ores7,8, the fractures were created
outside of the coreholder either fully using saw7 or partially using drilling bits8 (combined with hydraulic fractur-
ing under stress inside coreholder). These approaches, though more representative, are prone to the creation of
stress-induced micro-fractures, particularly in organic-rich shales (the primary target plays for field-scale HNP
application). If present, these micro-fractures, the apertures of which may be below the detection limit of CT/
micro-CT scan particularly for larger cores, could act as ‘by-pass’ flow paths along and in between the primary
fractures, causing overlap between different mechanisms. The representative replication of HNP mechanism,
de-coupled from flooding mechanism, is a challenge in experimental HNP studies. Multi-fracture geometries,
though more representative of subsurface condition, may provide a combination of flooding and HNP mecha-
nisms under laboratory conditions with an elevated effective permeability due to the proximity between saw-cut
fractures or hydraulically-induced primary fracture and the artificially-induced micro-fractures. In addition,
previous laboratory-based HNP experiments were typically not simulated using a compositional (lab-calibrated)
model. More importantly, the experimental durations of previous laboratory techniques are extensively long,
even for fractured cores (typically 15–20 h per c ycle7,8). This limitation hinders the experimental throughput,
and the capacity for characterizing the HNP mechanisms/controls over diverse experimental conditions in a
timely fashion.
In order to represent the core-based HNP process at ‘near-fracture’ conditions from locally depleted tight oil
reservoirs, a new set of experiments are designed herein whereby core-flooding is performed on core plug samples
that have been artificially fractured in a process analogous to “in-situ” fracturing. In previous work by Ghani-
zadeh et al.22,23, it was demonstrated that (gas) fracture permeability could be measured on the intact core plug
samples after artificial fractures were created in the rock under stress through application of differential stress in
a conventional biaxial coreholder (Fig. 1). This method is designed to create the fracture inside the coreholder
under stress by gradually increasing the axial load while keeping the radial load constant, until an axial splitting
(i.e. fracture) is induced in the core plug (presumably) along the weakest plane (e.g., existing bedding lamination,
etc.). While this approach (biaxial rather than shear) does not fully capture the complexity of natural fractures
induced under sub-surface conditions, it is expected to mimic the “in-situ” fracturing conditions (i.e. fracturing
under stress) better compared to the conventional methods (e.g., Brazilian test) in which the fracture is created
artificially outside of the coreholder using uniaxial stress. This approach has enabled the measurement of tight
rock unpropped/propped fracture permeability/conductivity23, and fracture c ompressibility24 under “in-situ”
stress and as a function of effective stress.
In this work, a new workflow is proposed for core-based HNP experiments in fractured core plug samples
as follows (Supplementary Fig. S1 online): (1) an intact core plug sample is first fractured under stress through
application of differential stress inside the coreholder (no use of saw or drill bit); (2) the fractured core plug is
saturated with oil by re-injecting formation oil back into the sample using liquid pump; (3) gas (e.g. CO2, lean
gas) is injected into the sample and allowed to soak, to mimic the injection and soaking periods of a field-scale
HNP scheme; (4) the injected gas is then re-injected in the upstream end at high pressure, and the effluent is
Scientific Reports | (2021) 11:9497 | https://doi.org/10.1038/s41598-021-88247-y 2
Vol:.(1234567890)www.nature.com/scientificreports/
measured at the downstream end. This set of experiments is expected to be more representative of ‘near-fracture’
conditions because (1) gas and liquid flow occurs through an actual “induced” fracture along the core plug
sample, and (2) “in-situ” stress, and stress variation regimes during injection, soaking and flow is reproduced.
Core-flooding experiments require careful design in terms of the length of the injection, soaking and produc-
tion periods, injected fluid volumes and pressures, and frequency of effluent sampling, among other considera-
tions. Core-based simulation, when combined with actual measurements, has proven to be significantly helpful
in our previous studies for developing new fluid flow experimental t echniques25,26 and evaluating the impact of
micro-scale heterogeneities on lab-based petrophysical and geomechanical d ata27. One of the novelties of this
work is the optimization of the experimental HNP design by simulating the experiments using a compositional
numerical simulator, with the core plug as the reservoir, prior to the actual tests. The simulator takes into account
the various mechanisms (e.g. multi-phase advection through fracture, diffusion through matrix, oil solvation,
etc.) that are expected in a core-based HNP experiment. Simulation of the experiments beforehand “de-risks”
the tests, improving the chance of success (i.e. higher recovery). This aspect is beneficial for experimental design,
particularly considering the overwhelming number of possible operational combinations (e.g. injection/produc-
tion pressure/time, soaking time, gas type, etc.) that can be chosen for a given core-based HNP test. Apart from
experimental design optimization, compositional numerical simulation is used in this work to history-match each
cycle, enabling the fundamental controlling mechanisms to be explored after the experiments are completed. As
a continuation of a previous work focused on C O2 HNP28, the current study is the first to couple experimental
and modeling approaches for core-based comparison of C O2 and (simplified) lean gas HNP performance in
low-permeability fractured reservoirs.
Numerical simulation: prior to experiments
In order to assist with the experimental design prior to conducting the actual tests, and to select the optimum
experimental conditions (leading to highest recovery), numerical simulations were implemented to simulate the
expected oil recovery during the first four cycles of CO2 HNP experiments. Based on previous laboratory fluid
analysis results6, a 7-component equation of state (EOS) was developed using tNavigator (version 20.1: https://
rfdyn.c om/t navig ator/). The mole fractions of the fluid components in the model were obtained by performing a
two-phase flash to represent the dead oil sample used in the experiment. The composition of flashed oil at room
conditions (1 atm, 25 °C) indicates that the majority of components are C5 to C12 (Supplementary Table S2
online). The phase envelope of the (simulated) dead oil is shown in Supplementary Fig. S2 online.
A numerical model was built prior to the CO2 HNP experiment using the petrophysical properties of the
intact29 and f ractured24 twin core plug samples to represent the matrix and fracture system in the simulation
(Supplementary Fig. S3 online). This cuboid model was designed to have a similar surface area and pore volume
as the actual cylindrical core plug samples used in this study. The model included 20 × 1 × 18 global cells in the
x, y and z directions, respectively. The fracture-hosting cells were refined by logarithmic spacing to accurately
model the flow towards the surface of an embedded fracture with a width of ~ 0.003 cm. The simulations were
conducted using an effective gas diffusion coefficient (D) of 7 × 10⁻⁴ cm2/s for the C O2 component only30. The
oil effective diffusion coefficient was set to be an order of magnitude smaller than the gas diffusion coefficient.
Additionally, a uniform initial oil saturation = 100% and matrix porosity = 2.8% were assumed for the core plug
sample. The stress-dependent m atrix29 and fracture (formation oil) permeability (Supplementary Appendix S2
online), both derived from laboratory analysis, were employed to further constrain the flow simulations.
Nearly 1000 compositional simulation runs were performed to determine an optimal design for the CO2 HNP
experiment. The parameters were selected using manual sensitivity analysis with the objective of optimizing the
performance of core-based huff-n-puff process (i.e. higher oil production/recovery over shorter period). The
effective diffusion/dispersion coefficients and the fracture aperture were selected as the primary input parameters
for optimizing the experimental conditions because they were highly uncertain and the most impactful on oil
production/recovery. Matrix permeability was also adjusted slightly but only within the range previously reported
for other (Duvernay shale) twin core plug samples with similar porosity and organic/inorganic composition31.
Two-phase (gas/liquid) relative permeability data, obtained for tight siliceous s amples29 from the Western Cana-
dian Sedimentary Basin were also among the initial selected parameters to constrain the simulation. However,
for near-miscible scenarios (the case herein), its impact was determined to be insignificant based on repeated
simulations (CO2) using another set of relative permeability curves obtained for other tight formations32. The
numerical simulations were used to determine Minimum Miscibility Pressure (MMP) between C O2 and the
“in-situ” (dead) oil, as well as the duration of gas injection, injection pressure, soaking and production periods.
As for the simplified lean gas HNP tests, similar experimental conditions (i.e. injection time/pressure; soaking
time; and production time) were applied without performing the “prior to experiment” simulations, in order
to obtain a direct comparison between the two HNP EOR schemes ( CO2 vs. simplified lean gas). In addition to
experimental design, the simulation models used for experimental design were also used to history match the
experimental oil recovery data after the actual experiments with CO2 and simplified lean gas were completed.
While ideal, there are considerable numerical complexities/challenges associated with using small grid blocks
in the available commercial reservoir simulators for miscible/near-miscible scenarios where diffusion/dispersion
is included. Using a fully implicit scheme to include the effective diffusion/dispersion coefficient as an input,
precautions were taken when selecting the grid blocks to (1) ensure the gridding is small enough to effectively
capture the associated physics and avoid numerical dispersion as much as possible, and, (2) avoid simulation
failure due to very small grid blocks. The small explicit fracture in the numerical simulation model was rep-
resented by grid blocks as small as 0.003 cm that can be optimally simulated (i.e. without any failure) by the
available commercial reservoir simulators. The near-fracture grids were further refined to around 0.04 cm with
larger grids up to a maximum of ~ 0.18 cm in the regions far away from the fracture.
Scientific Reports | (2021) 11:9497 | https://doi.org/10.1038/s41598-021-88247-y 3
Vol.:(0123456789)www.nature.com/scientificreports/
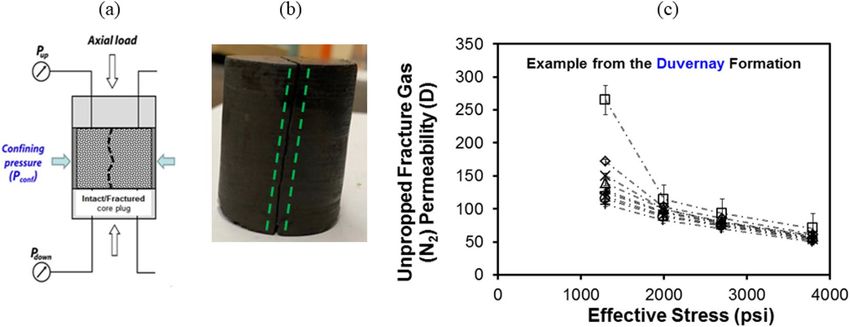
Figure 2. Schematic of the experimental setup designed and built in-house for the cyclic solvent (gas) injection
(HNP) experiments.
Experiments
Experimental setup. The experimental setup for the cyclic solvent (gas) injection includes a high-pressure
fluid injection pump, gas ( CO2, lean/rich gas) cylinder, fluid transfer cylinders, high-pressure coreholder, pres-
sure transducers, produced oil sample collector, gas flowmeter, gas sampling cylinders and various valves to
control the flow in and out of the coreholder (Fig. 2). The coreholder is capable of applying a confining pressure
up to 10,000 psi to mimic in-situ stress conditions. The confining pressure can be applied in radial and axial
directions, independently (i.e. biaxial coreholder). Using the high-pressure (5000 psi) pump, oil and liquefied
CO2 stored in the transfer cylinders can be injected into the coreholder at either constant flow rate or constant
pressure conditions to perform liquid permeability and HNP experiments. The injection pressure and produc-
tion pressure between two ends of the coreholder are monitored and recorded by two separate pressure trans-
ducers with an accuracy of ± 0.025% of full scale (0–6000 psi). The produced liquid and gas samples are separated
in the oil sample collector that consists of a measurement tube with graduated volume (0.01 cc). Cumulative oil
production is recorded using the sample collector while the gas production is measured using a gas flowmeter
(0–1,000 ml/min flow rate range). The produced gas samples are collected in a gas sampling cylinder (0–500
psi pressure range) during HNP experiments for compositional analysis. In this experimental setup, the down-
stream dead volume was comprised of the volume within a capillary tube (0.55–0.8 cc) and the dead volume
(~ 0.20 cc) associated with a needle valve (technically inevitable).
Experimental workflow and procedure. The key steps/experiments for core-based HNP, reproduced
from Song et al.28, were as follows:
1. The liquid permeability device used for steady-state liquid flow tests was calibrated using previously-
designed in-house permeability standards (micro-capillaries embedded into impermeable acrylic plugs,
references within Song et al.28). To pass the calibration, the measured permeability values should be
within ± 15% of the calculated permeability value.
2. A core plug sample with a cemented lamination occurring its entire length was selected (see “Rock sample
preparation: fracturing under stress”).
3. Helium porosity was measured on the core plug sample (using the helium pycnometry technique combined
with calipered dimensions).
4. The core plug sample is assembled into the core-holder and estimated “in-situ” stress is applied, followed
by a leak test at about 500 psi higher that the highest working pressure for HNP tests.
5. A fracture was created along the length of the cemented lamination artificially inside of the coreholder
by keeping the radial stress constant while increasing the axial stress stepwise—this approach is gener-
ally expected to result fracture creation under stress which is more similar to the subsurface conditions,
compared to creating fractures outside the coreholder, as discussed p reviously22,23.
6. Unpropped fracture permeability and compressibility with gas (N2, CH4) was measured under loading
(i.e. stepwise increase of effective stress; representative of primary depletion) and unloading (i.e. stepwise
decrease of effective stress; representative of injection) paths using the steady-state gas flow technique. The
gas permeability values were measured after each incremental increase in axial/radial stress conditions
Scientific Reports | (2021) 11:9497 | https://doi.org/10.1038/s41598-021-88247-y 4
Vol:.(1234567890)www.nature.com/scientificreports/
and repeated within 12-h time intervals under similar experimental conditions until a constant value
(within experimental error range) was achieved—the axial/radial stress should be increased (during load-
ing) or decreased (during unloading) only after constant permeability values are reached (as a result of
‘stress creep’). Details of unpropped/propped fracture permeability/conductivity23 and unpropped fracture
compressibility24 evaluations are provided elsewhere.
7. The fractured core plug sample was saturated with formation (dead) oil through application of a constant
oil pressure of 1500 psi for 5 days—the fractured core plug sample was evacuated for 48 h prior to oil
saturation to remove the air in the matrix and fracture.
8. The oil was thoroughly removed from the dead volumes and the fracture after oil saturation and before
the gas injection tests to minimize the error on the original oil-in-place (OOIP) calculations.
9. The core plug sample was removed from the coreholder and the mass was measured to allow the calcula-
tion of oil saturation and OOIP using helium porosity data obtained previously (step 3).
10. The unpropped fracture permeability (and compressibility) was measured with liquid (formation oil) under
loading and unloading paths using the steady-state liquid flow technique. The liquid permeability values
were measured after each incremental increase in axial/radial stress conditions and repeated within 12-h
time intervals under similar experimental conditions until a constant value (within experimental error
range) was reached. To examine the impact of flow rate on fractured oil permeability, oil was injected into
the fractured core plug sample at different flow rates (0.5–1.5 cc/min) under varying effective stress condi-
tions (500–3800 psi). Darcy’s law was used to determine the liquid (oil) permeability of the fractured core
plug under each flow rate and effective stress conditions.
11. CO2 or simplified lean gas were injected into the core plug sample at a constant pressure, followed by
a soaking period (1 h) for each cycle of the HNP process—during C O2 HNP cycles, liquefied C O2 was
injected into coreholder from the inlet end with a constant pressure of 1340 psi for 1 h until reaching the
miscible condition, while during the lean gas HNP cycles, simplified lean gas was injected into the core-
holder from the inlet end with a constant pressure of 1280 psi for 1 h. Prior to C O2 HNP experiment, the
minimum miscibility pressure (MMP) between the Duvernay (dead) oil and CO2 was estimated from the
slim tube simulation and found to be about 1028 psi. This MMP was also consistent with the values pre-
dicted from correlations. Using the slim tube simulation results, a constant C
O2 injection pressure of higher
than 1028 psi (i.e. 1340 psi) was employed in the C O2 HNP experiments to avoid immiscible conditions.
Similar experimental conditions were applied during the lean gas HNP process for better comparison of
the recovery performance.
12. The gas (e.g. CO2 or lean gas)/oil mixture was produced by decreasing downstream pressure to atmospheric
pressure for a specific period of time (0–4 h, depending on the cycle) until the point where recovery factor
was lower than 1–2% of OOIP.
13. Produced gas and oil were sub-sampled after selected steps for compositional analysis.
14. Steps 11–13 were repeated for multiple cycles, measuring oil and gas production for each step, and oil/
gas composition after selected steps—in total, six and four cycles of CO2 and lean gas HNP tests were
performed herein, respectively.
During the CO2 HNP process, initially, four cycles of HNP experiments were conducted under the experi-
mental conditions described herein. However, in order to evaluate the impact of varying experimental conditions
on the oil recovery, a cycle (#5) with shorter injection time (0.5 h), no soaking and a shorter production time
(1 h) was employed. Thereafter, keeping the injection and production conditions identical to those of cycle #5, an
additional cycle (#6) was conducted with 1 h of soaking to further evaluate the effect of soaking time on recovery
performance. During the simplified lean gas HNP process (cycle #1–4), similar experimental conditions were
applied as the first four cycles of CO2 HNP process described above (e.g. 1 h of gas injection, 1 h of soaking and
4 h of production) for direct comparison of the EOR performance using the two different gases.
Results
CO2 vs. simplified lean gas HNP. Based on the measured oil recovery after each cycle (Fig. 3a), it is evi-
dent that the majority of oil recovery (up to 80%) occurs during the first two cycles either for the CO2 or lean gas
HNP (4 cycles in total). Further, time-dependent pressure data (Figs. 3b, 4) indicate that there is a pressure drop
during each soaking period for CO2 HNP tests, likely due to C O2 dissolution into the formation oil. However, a
very minor pressure drop is evident for the lean gas HNP experiment. For cycles #1 to #4 of the CO2 HNP, which
were conducted under identical experimental conditions, the rate and magnitude of the observed pressure drop
decrease with each cycle. The impact of operational conditions on the performance of core-based HNP (with
CO2, as example) is discussed in Supplementary Appendix S3 online.
The observed pressure drops are partly controlled by the effective diffusion/dispersion process (next section),
which is a form of dissolution, as proposed before for other gas/liquid diffusion/dispersion models (e.g. Crank
197533). The substantial pressure drops for CO2 are due to larger C O2 effective diffusion/dispersion coefficient
according to the simulation results, that are generally in agreement with the orders of C O2 and lean gas (i.e. C
H4)
dissolution in typical dead oil samples (2–3 t imes34 higher for CO2 compared to CH4).
There are still considerable experimental challenges associated with the accurate determination of oil recov-
ery during cyclic gas injection in low-porosity rocks. The experimental error and uncertainty in recovered oil
volumes and recovery factors are discussed in detail in Supplementary Appendix S4.
History matching: post experiments. Several parameters were modified in the base simulation mod-
els to match the measured oil recovery profiles. History matching was conducted manually to achieve the
Scientific Reports | (2021) 11:9497 | https://doi.org/10.1038/s41598-021-88247-y 5
Vol.:(0123456789)www.nature.com/scientificreports/
Figure 3. (a,b) Oil recovery and injection/production pressures (4 cycles) as a function of (elapsed) time for
the CO2 and lean gas HNP cycles performed on twin core plug samples (a). CO2 data are adopted from Song
et al.28 while lean gas data are generated in this work. Pressure decay profiles for C
O2 and lean gas in an enlarged
view (b).
Figure 4. Cumulative gas production and injection/production pressures as a function of (elapsed) time for the
CO2 and lean gas HNP cycles performed on the twin core plug samples (4 cycles). C
O2 data are adopted from
Song et al.28 while lean gas data are generated in this work.
‘best-match’ because there were numerical challenges to complete the history matching using other assisted
approaches (e.g. Adaptive Differential E volution35 and Bayesian Optimization m ethods36). The latter observation
is attributed to (1) the small grid block thickness (as small as 0.003 cm), (2) the complexity of the compositional
simulation for near-miscible conditions, (3) large pore volumes and transmissibility differences between the
simulation cells (due to the presence of fracture), and (4) most importantly, including effective dispersion/diffu-
sion coefficient as an input parameter for simulations.
The preliminary (manual) history matching results indicate that a reasonable match can be achieved for
both CO2 and lean gas HNP processes (Fig. 5) by changing the effective diffusion/dispersion coefficients and
increasing the fracture width for both models (Supplementary Table S3 online). For the C O2 injection, it was
assumed that Doil = 0.1 Dgas.
For the CO2 HNP test (Fig. 5), the sharp increase in oil recovery observed during the first cycle can only be
matched with the simulator by allowing more CO2 to flow into the system. The sharp increase could be caused
by additional mixing of C O2 and the (dead) oil at the injection face of the core. An attempt was made to test this
hypothesis with the numerical model by adding an additional set of vertical grid blocks on the injection side of
Scientific Reports | (2021) 11:9497 | https://doi.org/10.1038/s41598-021-88247-y 6
Vol:.(1234567890)www.nature.com/scientificreports/
Figure 5. Comparison between experimental and simulated oil recovery as a function of time for the C O2 and
lean gas HNP cycles (#1 to #4). Note the last two cycles (#5 and #6; see Supplementary Appendix S3 online)
for CO2 HNP are not simulated because (1) they were not simulated before the experiments and (2) they did
not result in significant additional recovery. CO2 data are adopted from Song et al.28 while lean gas data are
generated in this work.
the core with large permeability and adjustable pore volumes. However, this approach resulted in instabilities in
the compositional simulations. A simpler approach was then tried, which involved increasing the fracture width
to permit enough C O2 to flow into the core plug sample.
For the lean gas HNP simulations (Fig. 5), the PVT model was re-constructed from 7 pseudo-components
(applied in CO2 HNP simulation) to 11 pseudo-components where C1 and C2 were considered to be separate
components in the simulation. The initial matrix permeability was slightly adjusted to about 30 nd due to the
high effective stress (1300 psi; 8.96 MPa) applied prior to the start of gas injection. Similar to the C
O2 HNP test
analysis, the fracture width of the core plug was also increased to allow more gas to flow into the system. For the
simulation results, it was found that the slope of the oil recovery curve was sensitive to the effective diffusion/
dispersion coefficients of other components. Therefore, the coefficients of a few other components were also
modified for both the C O2 and lean gas injection cases in order to achieve the “best-match” between experiments
and simulation model.
The history-matched model indicates that, while the oil recovery for cycle #1 can be matched reasonably
well, there is a slight mismatch between measured and simulated oil recoveries at the beginning of cycles #2 to
#4 for both CO2 and lean gas. The observed mismatch could be attributed to inherent differences between the
nature of experiment and the simulation. In numerical simulation, the produced oil contribution to improved
recovery is accounted for as soon as the oil is produced from the core in the simulation. During actual experi-
ments, however, the produced oil may become ‘trapped’ in the facture or dead volume of the experimental setup
instead of flowing out into the sample collector. The remaining oil content, that is associated with an earlier (i.e.
previous) cycle, may therefore become part of the produced oil in accompanying subsequent cycle, leading to a
sharp and sudden (as a result of abrupt pressure drop) increase in (experimental) recovery profiles at the begin-
ning of cycles #2 to #4 for C O2 and lean gas HNP processes.
Note using a ‘manual’ history matching process (as opposed to an ‘assisted’), it was not possible to achieve
the “best-match” for all pressure decay profiles for such small system including diffusion/dispersion process. As
such, the “best-match” model remains only an approximation. However, while an approximation, the simulated
pressure decay profiles (Fig. 6a,b) are capable of predicting higher pressure decay for CO2 than lean gas during
the soaking period (in agreement with the experimental data), highlighting the importance of the effective diffu-
sion/dispersion process on cyclic gas injection. Due to the possibility of gas compression in the system as a result
of the nature of the experiments (i.e. higher gas volumes injected/produced over larger drawdowns compared
to intact cores), the recorded gas volumes were treated with caution, and therefore, the cumulative gas recovery
was not considered in the history matching process.
Discussion
The previous laboratory studies represent a step change in the thinking around experimental evaluation of core-
based HNP process through suggesting alternative flow g eometries7,20, use of large-scale samples/fractures7 and
combining ‘outside-of-coreholder’ drilling and advanced core-based hydraulic fracturing under stress inside
the coreholder to induce f ractures8. However, the current work is unique due to (1) the proposed methodology
used for creating fractures under stress and (2) its integrated experimental and simulation approach in which
a compositional model is calibrated to laboratory data (porosity, matrix/relative permeability, etc.). To our
knowledge, this study is the first to fully couple fracturing under stress and EOR approaches with predictive
Scientific Reports | (2021) 11:9497 | https://doi.org/10.1038/s41598-021-88247-y 7
Vol.:(0123456789)www.nature.com/scientificreports/
Figure 6. Comparison between experimental and simulated pressure decay profiles for C
O2 (a) and lean gas
(b).
Formation Porosity (%) Permeability (md) Method Gas type Oil recovery (%) References
Lean gasa > 90
Middle Bakken (USA) 4.4–5.4 0.008–0.1 ”Flow-around”
CO2 > 90 37
Lean gasa 27
Lower Bakken (USA) 3.8 0.005 ”Flow-around”
CO2 32
CO2 65 14
Wolfcamp (USA) 8.5 0.0003–0.0005 ”Flow-around”
Lean gasb 30–40
CO2 ~ 95
Middle Bakken (USA) 4.5–8.1 0.002–0.04 ”Flow-around” Lean gasa ~ 95 38
Lean gasb 92
Table 1. Comparison of core-based HNP experiments with CO2 and lean gas in tight oil/gas formations.
a
Simplified lean gas (85% CH4 + 15% C2H6) is used in the tests. b Pure lean gas (100% CH4) is used in the tests.
fine-tuned simulation models for the purpose of comparing the cyclic gas injection performance of C O2 and lean
gas—two primary components of greenhouse gases—in fractured hydrocarbon systems. Compared to previous
experimental approaches, the method proposed herein reproduces ‘near-fracture’ conditions better because (1)
fractures are created under stress along the weakest mechanical plane, (2) the actual sequence associated with
a HNP cycle is mimicked (injection, soaking and production), (3) gas and liquid flow occur through an actual
induced fracture (analogous to a hydraulic fracture created ‘in-situ’ during a stimulation treatment), and (4) “in-
situ” stress, and stress variation regimes during injection, soaking and flow are reproduced. Recovery factors of
45% and 30% of OOIP were obtained after four cycles of HNP experiments performed on twin Duvernay Shale
core plug samples using C O2 and lean gas, respectively. While there may be discrepancies between laboratory-
and field-scale recovery factors due to differences between laboratory and field conditions (e.g. dead vs. live
oil8, reservoir heterogeneity, etc.), the observed difference between C O2 and lean gas recovery is in agreement
with those reported previously in the literature using “flow-through-matrix” or “flow-around-matrix” scenarios
(Table 1). Very importantly, however, in contrast to previous laboratory studies performed on intact/fractured
cores (Supplementary Table S1 online), these ultimate recovery factors could be achieved in only 24 h as a result
of 1) employing a fractured core plug (i.e. higher surface area) and 2) optimal simulation-aided experimental
design. Our integrated workflow therefore provides the opportunity for repeating multiple cycles over a relatively
short period of time on a given core plug sample in the laboratory. This in turn provides significant time/cost-
savings compared to previous approaches, allowing important results to be turned around much more quickly.
Note, using the simulations performed prior to the tests, the experimental time scales were selected with the
Scientific Reports | (2021) 11:9497 | https://doi.org/10.1038/s41598-021-88247-y 8
Vol:.(1234567890)www.nature.com/scientificreports/
criteria of achieving higher oil production/recovery while shortening the total duration of the injection-soaking-
production cycles (not achieving e.g. complete pressure equilibrium after each cycle, etc.).
Besides improved recovery, one of the advantages of using greenhouse gases (e.g. C O2 and lean gas) as sol-
vents is that a portion of the injected gas could be sequestered/trapped in the reservoir via dissolution in the
oil, adsorption on the rock surface, amongst other mechanisms. Optimizing the balance between improved
hydrocarbon liquid recovery and underground CO2 storage is among future challenges ahead of unconventional
hydrocarbon industry due to suppressed commodity prices and associated environmental concerns. Thanks to its
fast throughput, one of the advantages of the ‘flow-through-frac’ method, proposed herein, is that experimental
designs and conditions leading to this optimal balance, which in turn can be used to inform field testing, can
be determined quickly. For the CO2 HNP experiments performed herein, only a minor fraction (about 25 cc)
of CO2 was dissolved in the Duvernay (dead) oil under the prevailing conditions compared to the large amount
of injected CO2 (> 5000 cc). The small dissolution is primarily due to low production pressure (i.e. atmos-
pheric) used in the current experiments, leading to low C O2 solubility. Designs to achieve the optimal balance
of improved hydrocarbon recovery and underground greenhouse gas storage will be discussed in future studies.
Samples
Rock samples. The selected core plugs for this study were twin samples obtained from the same well and
depth. These samples (1.5″ diameter, 2″ length) were drilled parallel to bedding from a 2/3 slabbed core obtained
from a vertical well drilled into low-permeability intervals of the Duvernay Formation (Alberta, western Can-
ada). A comprehensive series of geochemical, petrophysical and geomechanical analyses were previously per-
formed on sample pieces and twin core plug samples obtained from the same well and d epth29,39, serving as
an important reference point for the current study. The analyzed samples have the following geochemical and
petrophysical properties based on the sub-samples taken from the vicinity of these two core plugs: total organic
carbon (TOC) content: 4.26 wt.%; clay content: 33.3%; quartz content: 44.7%; carbonate content: 12.4%; helium
porosity: 2.1–3.3%; slip-corrected gas ( N2) permeability (1.25·10–4 md; 900 psi effective stress). Detailed descrip-
tions of the experimental procedures for the determination of TOC content, mineralogical composition, helium
porosity, and slip-corrected gas (N2) permeability are provided elsewhere22.
The core plug samples used in this study were analyzed under “as-received” conditions. “As-received” in the
context of this work means that the sample was tested without any further treatment (e.g. cleaning/drying) in
the laboratory after drilling.
Rock sample preparation: fracturing under stress. The representativeness and repeatability of the
fracture creation procedure is one of the main challenges associated with experimental HNP studies. The
‘quality’ of the induced fractures is important for core-based HNP data evaluation and history-matching. The
assumption of the cubic geometry, that is the basis of the data evaluation and simulation for fractured cores,
can be violated depending on the roughness and orientation of the induced fractures. Larger errors in property
estimates are associated with deviated fractures (from the core axis) with rougher surfaces.
In this work, the fractures were created along cemented laminations (bedding planes) of core plugs. Cemented
laminations are commonly formed parallel to the bedding planes that are perpendicular to the direction of
sedimentation, creating planes of weakness. Unlike creating “smooth” saw-cut surfaces, the creation of fractures
along weak planes under stress ensures that the fracture conditions are representative of the subsurface fracturing
process and can be considered relatively repeatable.
To increase the representativeness and repeatability of the ‘flow-through-frac’ technique, preferentially, those
core plugs that contain a visible laminations and/or cemented micro-fracture should be drilled from the full
core (or 2/3 slabbed core) for the tests (Fig. 7). As an example, for Duv 1–1, a series of CT scans were collected
in a commercial laboratory to investigate the presence of laminations and/or pre-existing micro-fractures inside
the core plug. A primary micro-fracture was detected along the length of the core plug sample (Figs. 7a–c). This
micro-fracture, which extends from top to bottom of the core plug, occurs along a mechanically weak plane
which is prone to fracturing under differential stress.
Fluids. The formation (dead) oil sample was collected from an active producing field in the Duvernay For-
mation (western Canada). The formation oil was fully dewaxed with 0.1 micron filters at 25 °C in a commercial
laboratory prior to experiments. The analyzed oil sample has the following physical properties (25 °C, 14.7 psi):
density: 0.823; viscosity: 2.043 cP; and compressibility: 6.5·10–6 psi−1. The C O2 gas used in the C
O2 HNP experi-
ments was at research grade with a purity of 99.998%, and the simplified compositional lean gas (80% CH4 + 20%
C2H6) used in the lean gas HNP experiment was prepared by a commercial vendor in Calgary, Alberta, Canada.
The objective in this research was to evaluate the proof-of-concept experiments for cyclic gas injection at
‘near-fracture’ conditions in locally depleted tight oil reservoirs (i.e. with large drawdowns in near-fracture region)
that presumably completed the primary recovery process. As such, dead oil samples (as opposed to live oil) were
used for HNP experiments without performing any primary recovery tests prior to the HNP tests.
Scientific Reports | (2021) 11:9497 | https://doi.org/10.1038/s41598-021-88247-y 9
Vol.:(0123456789)www.nature.com/scientificreports/
Figure 7. CT scanning images of 2D and processed 3D views of Duv 1–1: (a) 2D, top to bottom; (b) 3D, top to
bottom; (c) 3D, bottom to top. A primary cemented lamination that is partly fractured is highlighted with the
red arrows (a–c). There is a secondary fracture close to the edge (a,b) that is not continuous along the core axis.
Drafted using ImageJ (version 1.53a, https://imagej.net/).
Received: 9 November 2020; Accepted: 5 April 2021
References
1. Hawthorne, S. B. et al. Hydrocarbon mobilization mechanisms using CO2 in an unconventional oil play. Energy Proc. 63 (2014).
2. Kanfar, M. S., Ghaderi, S. M., Clarkson, C. R., Reynolds, M. M. & Hetherington, C. A Modeling study of EOR potential for C O2
huff-n-puff in tight oil reservoirs—Example from the Bakken formation. In SPE Unconventional Resources Conference. https://doi.
org/10.2118/185026-MS (Society of Petroleum Engineers, 2017).
3. Kanfar, M. S. & Clarkson, C. R. Factors affecting huff-n-puff efficiency in hydraulically-fractured tight reservoirs. In SPE Uncon-
ventional Resources Conference. https://doi.org/10.2118/185062-MS (Society of Petroleum Engineers, 2017).
4. Sharma, S. & Sheng, J. J. A comparative study of huff-n-puff gas and solvent injection in a shale gas condensate core. J. Nat. Gas
Sci. Eng. 38 (2017).
5. Jacobs, T. Shale EOR delivers, so why won’t the sector go big? J. Petrol. Technol. 71 (2019).
6. Hamdi, H. et al. Huff-n-puff gas injection performance in shale reservoirs: A case study from Duvernay Shale in Alberta, Canada.
In Proceedings of the 6th Unconventional Resources Technology Conference. https://d oi.o rtec-2 018-2 90283 5 (American
rg/1 0.1 5530/u
Association of Petroleum Geologists, 2018).
7. Thomas, F. B. et al. Experimental measurements of Montney and Duvernay gas-cycling enhanced oil recovery GCEOR. In SPE
Canada Unconventional Resources Conference. https://doi.org/10.2118/199994-MS (Society of Petroleum Engineers, 2020).
8. Mahzari, P. et al. Novel laboratory investigation of huff-n-puff gas injection for shale oils under realistic reservoir conditions. Fuel
284 (2021).
9. Li, L., Sheng, J. J., Su, Y. & Zhan, S. Further investigation of effects of injection pressure and imbibition water on CO2 huff-n-puff
performance in liquid-rich shale reservoirs. Energy Fuels 32 (2018).
10. Du, D., Pu, W., Jin, F. & Liu, R. Experimental study on EOR by C O2 huff-n-puff and C O2 flooding in tight conglomerate reservoirs
with pore scale. Chem. Eng. Res. Des. 156 (2020).
11. Xue-wu, W. et al. Laboratory and field-scale parameter optimization of CO2 huff–n–puff with the staged-fracturing horizontal
well in tight oil reservoirs. J. Petrol. Sci. Eng. 186 (2020).
12. Pu, W. et al. Experimental investigation of CO2 huff-n-puff process for enhancing oil recovery in tight reservoirs. Chem. Eng. Res.
Des. 111 (2016).
13. Qian, K. et al. Experimental investigation on microscopic residual oil distribution during C O2 huff-and-puff process in tight oil
reservoirs. Energies 11 (2018).
14. Li, L., Sheng, J. J. & Xu, J. Gas selection for huff-n-puff EOR in shale oil reservoirs based upon experimental and numerical study.
In SPE Unconventional Resources Conference. https://doi.org/10.2118/185066-MS (Society of Petroleum Engineers, 2017).
15. Li, L., Zhang, Y. & Sheng, J. J. Effect of the injection pressure on enhancing oil recovery in shale cores during the CO2 huff-n-puff
process when it is above and below the minimum miscibility pressure. Energy Fuels 31 (2017).
16. Yu, Y. & Sheng, J. J. A comparative experimental study of IOR potential in fractured shale reservoirs by cyclic water and nitrogen
gas injection. J. Petrol. Sci. Eng. 149 (2017).
17. Wan, T., Yu, Y. & Sheng, J. J. Experimental and numerical study of the EOR potential in liquid-rich shales by cyclic gas injection.
J. Unconvent. Oil Gas Resour. 12 (2015).
18. Song, C. & Yang, D. Experimental and numerical evaluation of CO2 huff-n-puff processes in Bakken formation. Fuel 190 (2017).
19. Li, L. et al. A comparative study of C O2 and N2 huff-n-puff EOR performance in shale oil production. J. Petrol. Sci. Eng. 181 (2019).
Scientific Reports | (2021) 11:9497 | https://doi.org/10.1038/s41598-021-88247-y 10
Vol:.(1234567890)www.nature.com/scientificreports/
20. Hawthorne, S. B. et al. Measured crude oil MMPs with pure and mixed CO2, methane, and ethane, and their relevance to enhanced
oil recovery from middle Bakken and Bakken shales. In SPE Unconventional Resources Conference. https://d oi.o
rg/1 0.2 118/1 85072-
MS (Society of Petroleum Engineers, 2017).
21. Hawthorne, S. B. et al. Hydrocarbon mobilization mechanisms from upper, middle, and lower Bakken reservoir rocks exposed
to CO. In SPE Unconventional Resources Conference Canada. https://doi.org/10.2118/167200-MS (Society of Petroleum Engineers,
2013).
22. Ghanizadeh, A., Clarkson, C. R., Aquino, S., Ardakani, O. H. & Sanei, H. Petrophysical and geomechanical characteristics of
Canadian tight oil and liquid-rich gas reservoirs: I. Pore network and permeability characterization. Fuel 153 (2015).
23. Ghanizadeh, A. et al. Unpropped/propped fracture permeability and proppant embedment evaluation: A rigorous core-analysis/
imaging methodology. In Proceedings of the 4th Unconventional Resources Technology Conference. https://doi.org/10.15530/urtec-
2016-2459818 (American Association of Petroleum Geologists, 2016).
24. Zhang, Z., Clarkson, C. R., Williams-Kovacs, J. D., Yuan, B. & Ghanizadeh, A. Rigorous estimation of the initial conditions of
flowback using a coupled hydraulic-fracture/dynamic-drainage-area leakoff model constrained by laboratory geomechanical data.
SPE J. https://doi.org/10.2118/201095-PA (2020).
25. Clarkson, C. R., Nobakht, M., Kaviani, D. & Kantzas, A. Use of pressure- and rate-transient techniques for analyzing core per-
meability tests for unconventional reservoirs. In SPE Americas Unconventional Resources Conference. https://doi.org/10.2118/
154815-MS (Society of Petroleum Engineers, 2012).
26. Clarkson, C. R. & Qanbari, F. Use of pressure- and rate-transient techniques for analyzing core permeability tests for unconventional
reservoirs: Part 2. In SPE Unconventional Resources Conference Canada. https://doi.org/10.2118/167167-MS (Society of Petroleum
Engineers, 2013).
27. Solano, N. A., Soroush, M., Clarkson, C. R., Krause, F. F. & Jensen, J. L. Modeling core-scale permeability anisotropy in highly
bioturbated “tight oil” reservoir rocks. Comput. Geosci. 21 (2017).
28. Song, C., Clarkson, C. R., Hamdi, H. & Ghanizadeh, A. Evaluation of cyclic solvent injection (‘huff-n-puff ’) in artificially-fractured
shale core samples: Experiments & modeling. in Proceedings of the 8th Unconventional Resources Technology Conference. https://
doi.org/10.15530/urtec-2020-3038 (American Association of Petroleum Geologists, 2020).
29. Ghanizadeh, A., Song, C., Clarkson, C. R. & Younis, A. Relative permeability of tight hydrocarbon systems: An experimental study.
Fuel 294 119487 (2021).
30. Li, S., Qiao, C., Zhang, C. & Li, Z. Determination of diffusion coefficients of supercritical CO2 under tight oil reservoir conditions
with pressure-decay method. J. CO2 Utiliz. 24 (2018).
31. Ghanizadeh, A. et al. Effects of entrained hydrocarbon and organic-matter components on reservoir quality of organic-rich shales:
Implications for «sweet spot» identification and enhanced-oil-recovery applications in the Duvernay formation (Canada). SPE J.
25, 1351–1376 (2020).
32. Shen, Z. & Sheng, J. J. Experimental and numerical study of permeability reduction caused by asphaltene precipitation and deposi-
tion during CO2 huff and puff injection in Eagle Ford shale. Fuel 211, 432–445 (2018).
33. Crank J. The Mathematics of Diffusion. 2nd edn. (Oxford University Press Inc, 1975).
34. DeRuiter, R. A., Nash, L. J. & Singletary, M. S. Solubility and displacement behavior of a viscous crude with CO2 and hydrocarbon
gases. SPE Reserv. Eng. (Society of Petroleum Engineers) 9, 101–106 (1994).
35. Yi, W., Zhou, Y., Gao, L., Li, X. & Mou, J. An improved adaptive differential evolution algorithm for continuous optimization.
Expert Syst. Appl. 44, 1–12 (2016).
36. Hamdi, H., Couckuyt, I., Sousa, M. C. & Dhaene, T. Gaussian Processes for history-matching: application to an unconventional
gas reservoir. Comput. Geosci. 21, 267–287 (2017).
37. Jin, L. et al. Utilization of produced gas for improved oil recovery and reduced emissions from the Bakken formation. In SPE Health,
Safety, Security, Environment, & Social Responsibility Conference-North America. https://doi.org/10.2118/184414-MS (Society of
Petroleum Engineers, 2017).
38. Alharthy, N. et al. Enhanced oil recovery in liquid-rich shale reservoirs: Laboratory to field. SPE Reserv. Eval. Eng. 21 (2018).
39. Ghanizadeh, A. et al. Effects of entrained hydrocarbon and organic-matter components on reservoir quality of organic-rich shales:
Implications for ‘sweet spot’ identification and enhanced-oil-recovery applications in the Duvernay formation (Canada). SPE J.
25 (2020)
Acknowledgements
The authors gratefully thank the sponsors of the Tight Oil Consortium hosted at the Department of Geoscience,
University of Calgary. Chris Clarkson would like to acknowledge Ovintiv Inc. (former Encana Corporation) and
Shell for support of his Chair position in Unconventional Gas and Light Oil research at the University of Calgary,
Department of Geoscience. The authors further thank Natural Sciences and Engineering Research Council of
Canada (NSERC) for providing funding for this work through the Collaborative Research and Development
(CRDPJ 505339-16) and Alliance (ALLRP 548652-19) grants. Hamidreza Hamdi would like to thank Rock Flow
Dynamics Inc. (RFD) for supporting his independent research. An early version of this work, focused on C O 2,
was prepared for presentation at the Unconventional Resources Technology Conference held in Austin, Texas
(20-22 July, 2020) and published as a non-peer-reviewed conference contribution (URTeC 3038). The current
manuscript represents a significant update to this pre-cursor work by adding new sets of (1) experiments and (2)
simulation runs using lean gas to establish comparisons between C O2 and lean gas huff-n-puff performances. In
addition, this version includes new sections elaborating on (a) rock sample preparation and fracturing process,
(b) technical challenges associated with experiments and numerical simulations, (c) the sources and degrees of
uncertainty, and (d) complimentary ‘best-practices’ to perform HNP experiments and numerical simulations
more effectively for future interested readers. Approval by the Unconventional Resources Technology Conference
(URTeC) to publish the material reproduced from URTeC 3038 as a peer-reviewed article is greatly appreci-
ated. The authors thank RFD for the use of tNavigator.
Author contributions
A.G. is a Research Associate, who was in charge of supervision, conceptualization, investigation and writing/
editing of the manuscript. C.S. is a Research Assistant, who was in charge of conceptualization, investigation,
methodology and writing/editing of the manuscript. H.H. is a Research Associate, who was in charge of con-
ceptualization, investigation, methodology and writing/editing of the manuscript. C.R.C. is the principal inves-
tigator, who was in charge of funding acquisition, supervision, conceptualization and writing and editing of the
manuscript.
Scientific Reports | (2021) 11:9497 | https://doi.org/10.1038/s41598-021-88247-y 11
Vol.:(0123456789)www.nature.com/scientificreports/
Competing interests
The authors declare no competing interests.
Additional information
Supplementary Information The online version contains supplementary material available at https://doi.org/
10.1038/s41598-021-88247-y.
Correspondence and requests for materials should be addressed to A.G.
Reprints and permissions information is available at www.nature.com/reprints.
Publisher’s note Springer Nature remains neutral with regard to jurisdictional claims in published maps and
institutional affiliations.
Open Access This article is licensed under a Creative Commons Attribution 4.0 International
License, which permits use, sharing, adaptation, distribution and reproduction in any medium or
format, as long as you give appropriate credit to the original author(s) and the source, provide a link to the
Creative Commons licence, and indicate if changes were made. The images or other third party material in this
article are included in the article’s Creative Commons licence, unless indicated otherwise in a credit line to the
material. If material is not included in the article’s Creative Commons licence and your intended use is not
permitted by statutory regulation or exceeds the permitted use, you will need to obtain permission directly from
the copyright holder. To view a copy of this licence, visit http://creativecommons.org/licenses/by/4.0/.
© The Author(s) 2021
Scientific Reports | (2021) 11:9497 | https://doi.org/10.1038/s41598-021-88247-y 12
Vol:.(1234567890)You can also read