RESTI journal - Jurnal RESTI
←
→
Page content transcription
If your browser does not render page correctly, please read the page content below
Accredited by National Journal Accreditation (ARJUNA) Managed by
 Ministry of Research, Technology, and Higher Education, Republic Indonesia with Second Grade (Peringkat 2, Sinta 2)
 since year 2017 to 2021 according to the decree No. 10/E/KPT/2019.

 Published online on the journal’s webpage: http://jurnal.iaii.or.id

 RESTI journal
 (System Engineering and Information Technology)
 Vol. 5 No. 3 (2021) 584 - 593 ISSN Electronic Media: 2580-0760

 Identifying Emotion on Indonesian Tweets
 using Convolutional Neural Networks
 Naufal Hilmiaji1, Kemas M Lhaksmana2, Mahendra D Purbolaksono3
 1,2,3School of Computing, Telkom University
 1naufalhilmiaji@student.telkomuniversity.ac.id, 2kemasmuslim@telkomuniversity.ac.id,
 3mahendradp@telkomuniversity.ac.id

Abstract
Identifying emotion out of text has become a research interest in natural language processing and other related fields,
especially with the advancement of deep learning methods for text classification. Despite some effort to identify emotion on
Indonesian tweets, its performance evaluation results have not achieved acceptable numbers. To solve this problem, this paper
implements a classification model using a convolutional neural network (CNN), which has demonstrated expected performance
in text classification. To easily compare with the previous research, this classification is performed on the same dataset, which
consists of 4,403 tweets in Indonesian that were labeled using five different emotion classes: anger, fear, joy, love, and sadness.
The performance evaluation results achieve the precision, recall, and F1-score at respectively 90.1%, 90.3%, and 90.2%, while
the highest accuracy achieves 89.8%. These results outperform previous research that classifies the same classification on the
same dataset.
Keywords: emotion, text classification, twitter, CNN.

1. Introduction through user tweets. The information gained is about
 analyzing their sentiments, including their emotions.
The rise of social media allows humans to express their
emotions by sharing their moments with their fellows. Analyzing emotions is part of a psychology field,
Twitter is a social media with the highest user growth although, in natural language processing (NLP), emotion
each year. In Indonesia, Twitter has ranked fourth by the analysis or emotion mining has gone through years of
most popular social media with at least seven million research. Analyzing emotions can be done by learning
active users by the end of March 2021 [1]. It provides the humans’ nonverbal communication, such as facial
texts as their main feature to communicate, which are expressions, body gestures, eye contact, touch, space,
called tweets. As the media of expression, tweets can and voice [3]. Therefore, professional human resources
have various information, including human emotion. in the field of psychology are needed to avoid
Users often post tweets whenever they have something misinterpretation. Due to the demanding cost of hiring
emotional inside them. Likewise, Indonesian social psychologists, researchers are keen to find alternative
media users express themselves through Twitter [2]. ways. Machine learning is one of the most promising
After all, when compared to other social media that are approaches for identifying emotion through text
more concerned with visual images, on Twitter they can classification. It learns from the data (supervised) and
be more expressive because they only focus on text or predicts the corresponding classes of the text provided in
tweets. Also, they mentioned that Twitter users tend to the data. In addition, the ability of a machine or computer
be more open-minded. With these advantages, they will to understand emotions is critical to the success of
never feel that when they wanted to reveal themselves, several other applications. For instance, in the domain of
other users would respond carelessly or harshly to their customer service, Twitter gains prominence where
remarks. The form of self-expression they do is what customers are expected to have quick responses. Text
they feel at the time, such as anxiety and deep thoughts. emotion classification can be applied to monitor the
Apart from that, at the same time, the emotions felt by cyberbullying, depression, and desperation in social
the users were also expressed via tweets. These issues media and prevent them from hurting themselves. It also
led researchers to find ways of gaining knowledge helps companies to create an automated system of

 Accepted by editor: 18-05-2021 | Final Revision: 24-06-2021 | Online Publication: 26-06-2021
 584
Naufal Hilmiaji, Kemas M Lhaksmana, Mahendra D Purbolaksono
 RESTI Journal (System Engineering and Information Technology) Vol. 5 No. 3 (2021) 584 – 593

classifying applicants’ personalities through texts to dictionary. The parameters used for experiments are: (1)
seek talents who fit with their corporate culture in the Learning rate: 0.005 and 0.001, (2) Dropout: 0.25 and
talent recruitment process [4]. 0.5, (3) Optimizer: SGD and Adam’s. With the use of 50
 epochs and 100 batch size, precision, recall, and F1-
According to the past study of tweets emotion analysis,
 score were obtained respectively at 33%, 38%, and 35%.
using Multinomial Naïve Bayes (MNB) with Laplace
 The accuracy of the model is 46% [11].
Smoothing has obtained good performance results. It
combines MNB Classifier with multiple feature Based on the research by [10, 11], with the same dataset,
extraction methods, such as n-grams, POS Tag, and the Logistic Regression method leads the F1-score result
adjectives. Unigrams has the highest accuracy of 95% at 69.73%, significantly higher than the LSTM-GloVe
for the tweets and 67% for the SMS [5]. The same method. This may happen since deep learning methods
method was applied in another study of classifying are created to model the distribution that underlies the
sentiment based on movie review dataset by combining training data. All cases and possibilities are needed in the
TF-IDF as the feature extraction method. It produced the training process to achieve state-of-the-art accuracy.
best accuracy of 85.16%, meanwhile using SVM Therefore, deep learning methods often require a large
produced the best F1-Score of 84.9% [6, 7]. number of data, much more than conventional ones.
 Meanwhile, both studies only used 4.403 rows of data.
A study proposed the combination of two machine
 In addition, the architecture of the model can also affect
learning methods CNN and SVM to construct a text
 the training performance.
sentiment analysis model by using a Word2Vec as the
feature extraction. This study used the data from Considering this research is using the deep learning
NLPCC2014, an emotional analysis evaluation task data CNN method, our main reference is from [11]. However,
set based on the deep learning method. It consisted of their results are still far below the average. The authors
10000 rows of training data, with 50% labeled as stated that it is caused by underfitting. Although, it is
positive and 50% labeled as negative. The testing data unclear the reason they allowed the model to underfit
consisted of 2500 rows, with 50% labeled as positive and when the learning process is being done. Therefore, the
50% labeled as negative. The result shows positive purpose of this research is to optimize the deep learning
classes have an 89% F1-score, while negative classes CNN method by implementing some experiments on
have 88.6% [8]. model architecture (e.g., hyperparameter tuning) to get
 the highest possible performance results and to avoid
In 2019, a study proposed a CNN model architecture for
 overfits and underfits. The results will then be compared
text sentiment classification using the English Movie
 to [11] as the baseline of our model prediction.
Review dataset. The model consisted of two consecutive
convolution layers. The first layer stores the local
 2. Research Method
information to the second layer, while the second layer
extracts features from the contextual information. They
have produced relatively high-performance results on a
relatively long text. The accuracy of binary and ternary
classification respectively 81% and 68% [9].
Research on emotion classification on Indonesian
Twitter data compared multiple machine learning
methods, such as Logistic Regression, SVM, and
Random Forest then combined them with multiple
feature extraction methods, such as Bag-of-Words
(BOW), Word2Vec (WV), and FastText (FT). The result
is acceptable, getting an F1-score of 68.39%. Finally,
they considered adding three more methods, Emotion
Lexicons, Orthographic, and POS Tag. The result is
slightly higher than the previous one, getting an F1-score
of 69.73%. They also provided a dataset called
“Indonesian Twitter Emotion Dataset” as the result of
this study [10].
A later study reproposed the method used in the [10] by
using Deep Learning LSTM-GloVe. Tweets are
tokenized once it enters the input layer into a sequence
of integers. The padding of zeros is added to match the
length of each tweet. The system will then build an
embeddings index to retrieve the index from the GloVe Figure 1. System Flowchart

 DOI: https://doi.org/10.29207/resti.v5i3.3137
 Creative Commons Attribution 4.0 International License (CC BY 4.0)
 585
Naufal Hilmiaji, Kemas M Lhaksmana, Mahendra D Purbolaksono
 RESTI Journal (System Engineering and Information Technology) Vol. 5 No. 3 (2021) 584 – 593

In this research, the method used is Deep Learning unnecessary strings still need to remove completely from
Convolutional Neural Network (CNN). Figure 1 shows the data, because it can lower the performance produced
the flow of the system used in this research represented by the CNN model due to the learning complexity.
in a flowchart. The system received input data in CSV Table 1. Preprocessing Criteria
format and will first undergo preprocessing. Afterward, Tweets Preprocessed
the data will be split into 70% training data and 30% “Baca buku ini diawal “Baca buku ini diawal
testing data. The percentages of the data splitting are senyum, ditengah-tengah senyum, ditengah-tengah
determined through experiments, and these values are senyum miris, diakhir senyum miris, diakhir
considered to be the best for this research. However, senyum pasrah. Nuhun bung senyum pasrah. Nuhun
 @someone” bung [USERNAME]”
having an excessive amount of training data will overfit
 “sebagai supporter speak “sebagai supporter speak
the model performance. Meanwhile, the smaller the bola gue ga suka barca, tapi bola gue ga suka barca,
training data will be insufficient for the model to learn sebagai pecinta sepakbola tapi sebagai pecinta
through processes and will cause underfitting. gue suka ini film, keren sepakbola gue suka ini
 https://example-url.com/” film, keren [URL]”
After the data split, the system will continue to build the
 “Malam saya mau tanya “Malam saya mau tanya
CNN model architecture and do the training process. kenapa benefit saya kenapa benefit saya
Lastly, the CNN model will then predict the classes of dibatalkan, saya bukan dibatalkan, saya bukan
every tweet in the test data and evaluate its performance dropshiper dan saya rasa dropshiper dan saya rasa
results. The evaluation methods used are accuracy, tidak ada aturan yang saya tidak ada aturan yang
 langgar 1234xxx” saya langar [SENSITIVE-
precision, recall, and F1-Score. The CNN model will be NO]”
evaluated by comparing it to the baseline whether or not
it has surpassed them. If it failed to outperform them, the 2.2. Data Preprocessing
model needs to be reconstructed by tuning the learning
rate, the hyperparameters, or using grid search method
to find the optimal layer configurations until it has
successfully produced higher results than the baselines.
2.1. Dataset

 Dataset Class Distribution
 Figure 3. Data Preprocessing
 1200 1101
 1017 997 To enhance the data quality, data must be preprocessed
 1000
 before getting into the training process. Data
 800 649 637 preprocessing in Machine Learning refers to the data
 600 mining technique of cleaning and organizing the raw
 data to make it suitable for building and training machine
 400 learning models. It is used to transform raw data into an
 200 understandable and readable format. Figure 3 shows the
 flowchart of the data preprocessing. The method used for
 0 word-stemming is from [12]. PySastrawi is a simple
 anger happy sadness fear love
 Python library to reduce inflected words in Indonesian
 Figure 2. Dataset Class Distribution
 to their base form. Table 2 shows how PySastrawi
 applied to Indonesian terms.
The dataset used contains 4.403 rows of tweets that are
 Table 2. Indonesian Word Stemming
labeled using five emotion classes, anger, fear, joy, love,
and sadness provided by [10] in CSV format. 1 Each row Word Stemmed
consisted of a tweet and its respective emotion label memainkan (playing) main (play)
separated by a comma (,). The first row is a header. For bercanda (joking) canda (joke)
a tweet with a comma inside the text, there is a quote terkagum (amazed) kagum (amaze)
mark (" ") to avoid column separation. The tweets in this
dataset have been pre-processed using the following In this research, we use a powerful Python tool for
criteria based on Table 1. Mentions have been replaced developing and evaluating deep learning models called
with “[USERNAME]”, URLs have been replaced with Keras. Keras is a consistent and simple deep learning
“[URL]”, and Numbers like phone number, invoice API, running on top of TensorFlow – a flexible data
number, and a courier tracking number have been open-source flow-based programming model – designed
replaced with “[SENSITIVE-NO]”. However, these to minimize the number of user actions required for

1
 https://github.com/meisaputri21/Indonesian-Twitter-Emotion-Dataset

 DOI: https://doi.org/10.29207/resti.v5i3.3137
 Creative Commons Attribution 4.0 International License (CC BY 4.0)
 586
Naufal Hilmiaji, Kemas M Lhaksmana, Mahendra D Purbolaksono RESTI Journal (System Engineering and Information Technology) Vol. 5 No. 3 (2021) 584 – 593 Figure 4. CNN Model Architecture common use cases, and it provides clear and actionable size of m × n, where m is the output dimension. It error messages [13, 14]. In the preprocessing part of the consists of the correlation of each word index in every system, Tokenizer from Keras will be applied to get tweet to the whole document. The input dimension m word indexes by tokenizing words inside text should be equal to the number of unique vocabularies in documents, also to transform each text into a sequence the data and the output dimension m is the size of the of integers. This sequence will be used for computation vector space in which words will be embedded. It inside the neural network since they were not designed determines the size of the output vectors from this layer to understand the inputs that are in non-numeric format. for each word. In our CNN model, the embedding layer will learn along with the model itself rather than using 2.3. Convolutional Neural Network (CNN) pre-trained word embedding models (e.g., Word2Vec). This section provides the details of our model. CNN is a It is initialized with random weights and will learn an deep learning method that was initially used for embedding for every word in the previously analyzing and classifying digital images. Its purpose was preprocessed data. An embedding layer learns then tries to extract meaningful features of an image to find the optimal mapping of each of the unique words convolutionally by moving the kernel on the convolution to a vector of real numbers. layer through two-dimensional matrices [15]. Based on Table 3. Word Embedding this concept, it can also be applied for text through one- Sentence Embedding dimension matrices. Figure 4 shows an image “hope to see you soon” [1,2,3,4,5] representation of the proposed model architecture. It “Nice meeting you” [6,7,4,0,0] #zeros for padding consisted of an input layer consists of sequences of integers, an embedding layer, a one-dimensional Table 3 shows how word indexes are assigned to each convolutional layer, a pooling layer, a fully connected unique word by using a one-hot encoding method from layer, and an output layer consisted of five classes, Keras Tokenizer API. However, instead of using a large anger, fear, joy, love, and sadness. To get better amount of one-hot encoded vectors, an embedding layer understandings of CNN, we will go through the prefers to create an embedding matrix based on word definition and the usage of every component that indexes to keep the size of each vector much smaller as constructs CNN models. represented in Table 4. 2.3.1. Embedding Layer Table 4. Embedding Index Word Index Embedding Keras offers an embedding layer that can be used for text 0 [1.2, 3.1, 2.5] data on neural networks and it requires the data to be 1 [0.1, 4.2, 1.5] integer encoded. The embedding layer works similarly 2 [1.0, 3.1, 2.2] as a simple matrix multiplication that transforms words 3 [0.3, 2.1, 2.0] into their corresponding word embeddings or turns 4 [2.2, 1.4, 1.2] indexes into dense vectors of fixed size. Word 5 [0.7, 1.7, 0.5] embedding can be regarded as textual features so that it 6 [4.1, 2.0, 4.5] can be counted as a preprocessing step in more advanced 7 [3.1, 1.0, 4.0] NLP tasks [16]. This layer can only be used as the first Assuming we want to train a CNN model, and Table 4 is layer in a model. The input data will be padded for each sentence to create a fixed size of sequences. If the our training data, we should first specify our embedding layer. The number of unique vocabularies from the data sentence is too long, it will be trimmed to the maximum length, and if it is too short, it will be padded by zeros to is 8, so the input dimension m is 8, and 3 for the output match m. The embedding layer will receive these dimension n. During the training process of the CNN, sequences and create an embedding matrix within the embedded vectors are getting updated and expecting that similar meaning words will have similar representations DOI: https://doi.org/10.29207/resti.v5i3.3137 Creative Commons Attribution 4.0 International License (CC BY 4.0) 587
Naufal Hilmiaji, Kemas M Lhaksmana, Mahendra D Purbolaksono
 RESTI Journal (System Engineering and Information Technology) Vol. 5 No. 3 (2021) 584 – 593

in a multi-dimensional space as shown in Table 4. Once each setting of its posterior probability given the training
the training has finished, the embedding layer will data [18].
produce a matrix with the shape of (8, 3) as the output.
 Dropout can be applied with most layers in a neural
2.3.2. Convolution Layer network, whether it is a hidden or visible layer. During
 the training process, some layers are dropped
Convolution is a linear operation that performs the
 temporarily across the connections. Dropout can noise
multiplication of inputs with a set of weights. Therefore,
 the training process by forcing layers to drop their nodes.
a convolution layer was designed to have the ability to
 The dropout values are between 0 and 1. Assuming it is
apply such an operation to a sequence of input data and
 specified to 0.5, it will force layers to drop 50% of their
a filter or a kernel to produce a dot product. A dot
 nodes to reduce overfitting.
product is the sum of a product of two sequences of
numbers that correspond to each other and always 2.3.7. Regularization
resulting in a single value. As the layer convolves
 Regularization is a technique of modifying the model
through the m × n matrix with an arbitrary stride, it will
 such that the model generalizes better. This will penalize
calculate the dot products of this matrix and filters ( )
 the weight matrices of the nodes in the network. L1 and
to create a feature map f and pass it to the next layer.
 L2 are the most common types of regularization. It
During the convolution process of calculating the dot
 updates the general cost function by adding another term
products, the feature map will gain values from it as the
 known as the regularization term. As a result, the weight
process continues to the last filter. These values can vary
 matrix value decreases because it assumes that an
because the convolution layer naturally generates filters
 artificial neural network with a smaller weight matrix
as it trains the data, and they do not have fixed values.
 produces a simpler model. Hence, it will also reduce
2.3.3. Pooling Layer overfitting to a great extent. In this research, the
 regularizer used is the L2 type of regularization for the
A pooling layer is a layer that reduces input spatially by
 experiment. L2 norm is represented by the term below
using downsampling operations. The commonly used
 [15]:
method of a pooling layer is max pooling. This method
will take the maximum value for each patch of a feature 2
 Ω( ) = + × ∑|| || (1)
map resulted from the convolution layer. The result of 2
using a pooling layer is a summarized version of the
feature map. In Keras, there is another type of pooling Where the loss function used here is categorical cross-
that is sometimes used called global pooling. In this entropy, considering the model has five output classes,
research, the pooling method used is global max pooling. and the regularization parameter ( ) used is the
Instead of downsampling patches from the feature map, hyperparameter whose values are optimized for better
a global pooling layer downsamples the entire feature results and usually in logarithmic scale (10 , < 1).
map to a single value. This would be the same as setting L2 regularization is also known as weight decay as it
the pooling size to the size of the input feature map. forces the weights ( ) to decay towards zero, but not
2.3.5. Fully Connected Layer exactly zero. Intuitively, the smaller weight reduces the
 impact of hidden neurons. In this case, the hidden neuron
A fully connected layer is simply feed-forward neural becomes negligible and the overall complexity of the
networks which is an artificial neural network neural network is reduced. Less complex models usually
connection where the connection between nodes does avoid modeling noise in the data, and therefore, there is
not form a cycle [17]. The input to the fully connected no overfitting.
layer is the output from the pooling layer, which has
been flattened. After passing through the fully connected 2.3.8. Learning Rates
layers, the final layer will then get probabilities of the Learning rate is a hyperparameter that controls how
input being in an appropriate class. much the model should update the weights for every
2.3.6. Dropout epoch and often has a value in the range between 0.0 and
 1.0. The learning rate may be the most important
Small datasets have higher chances of causing overfits hyperparameter when configuring neural networks [19].
when using CNN models. This issue may also affect the It is required to analyze the appropriate value of learning
lower performance of the model when the training rates for better performance. The lower value of the
process has done. An approach is needed to reduce the learning rate resulting the training process being longer
overfitting of every network and to average the and have more epochs, while the higher value will faster
predictions of the model. A dropout comes to regularize the learning process. The model will adapt more quickly
a fixed-size model by averaging predictions of the to the problem to get less training time. If the learning
hyperparameters used in a certain layer by weighting rate is set too low, training will progress very slowly
 because the model will make very few updates on the

 DOI: https://doi.org/10.29207/resti.v5i3.3137
 Creative Commons Attribution 4.0 International License (CC BY 4.0)
 588
Naufal Hilmiaji, Kemas M Lhaksmana, Mahendra D Purbolaksono
 RESTI Journal (System Engineering and Information Technology) Vol. 5 No. 3 (2021) 584 – 593

weight on your network. However, a learning rate that is probability of positive labels labeled as positive. These
too high causes the model to obtain the solutions too methods can be calculated by using the following
quickly, so that it may skip the important features meant formulas:
to be acquired.
 ( ) = (3)
2.3.9. Adam Optimizer +
Adam Optimizer is an adaptive stochastic learning rate
 (4)
optimization algorithm designed for deep neural ( ) =
networks by computing individual learning rates for +
different parameters. It combined the Adaptive Gradient The last evaluation method is F-Measure. F-Measure
Algorithm and Root Mean Square Propagation. Both provides a single score that balances both the concerns
methods are using the same concept of stochastic of precision and recall in one number. It is the ratio of
optimization. Stochastic optimization is the process of the number of positive classes that are predicted to be
optimizing an objective function in the presence of correct with the number of all samples that should be
randomness. Adam optimizer handles the sparse predicted as positive. This method is commonly used for
gradients on noisy datasets efficiently by using a smaller evaluating many kinds of machine learning models. The
amount of memory and it can be an advantage for this F-Measure can be calculated by using the following
research, considering we use a small amount of data but formula.
with a more complex CNN model.
 2
2.4. Model Testing = (5)
 +
Ensuring the model has good performance is needed to From the formula above, the F-Measure was produced
get a better understanding of the problems. Therefore, it by having a trade-off between Precision and Recall. If
needs to be tested by doing predictions. The previously the model is optimized to increase one and disfavor the
trained model will predict the labels from the test data. other, the harmonic mean quickly decreases. However,
In this research, the methods used to evaluate the when both precision and recall are equal or have slightly
predictions are accuracy, precision, recall, and F- different values, the F-Measure will surely have a great
Measure. These methods are measured based on a result. With high precision but low recall, models are
confusion matrix represented in Table 5. extremely accurate, but it misses a significant number of
 Table 5. Confusion Matrix instances that are difficult to classify. This may not be
 Actual Actual very useful for the evaluation process.
 Class (+) Class (-)
 Predicted
 TP FP
 3. Result and Discussion
 Class (+)
 Predicted 3.1. Training Process
 FN TN
 Class (-)
 Based on Figure 4, the input layer receives a sequence of
Accuracy is a method that is often used in research integers from the previously preprocessed data. The data
related to binary classification and/or multiclass consists of 14,648 unique vocabularies and a maximum
classification [20]. Accuracy is the number of correctly of 83 words for a whole text document. The embedding
 layer takes every unique vocabulary as the input
predicted data points out of all the data points. It can be
calculated by dividing the number of correct predictions dimension, 128 output dimensions, and 83 maximum
by the number of total predictions as follows: input lengths. Since the embedding layer is the first layer
 + of the model, it needs to have more data from the input
 = (2) layer for the embedding matrix in terms of better
 + + + learning processes. As a result, the model will have more
 time to learn, but the performance results will be
On the formula above, TP is represented as True significantly higher. Therefore, the more input
Positives, where the model correctly predicts the dimension to have, the higher the performance of the
positive classes. TN means True Negatives, which means CNN model.
the model has correctly predicted negative classes.
Meanwhile, FP and FN stand for False Positives and Output from the embedding layer goes to the
False Negatives. These denote that the model has convolution layer. The convolution layer consists of 128
incorrectly predicted both positive and negative classes. filters as well as 5 kernel sizes. These numbers were
Precision is used to measure the positive class predicted determined by tuning them repeatedly over time and
upon the probability it is correct. When the model have produced the best performance results. The
predicts positive, precision will calculate how often it activation function used here is Rectified Linear Unit
predicted positive class correctly. Recall is the (ReLU) that will produce the output directly if it is
 positive, otherwise, it produces zeros. The usage of

 DOI: https://doi.org/10.29207/resti.v5i3.3137
 Creative Commons Attribution 4.0 International License (CC BY 4.0)
 589
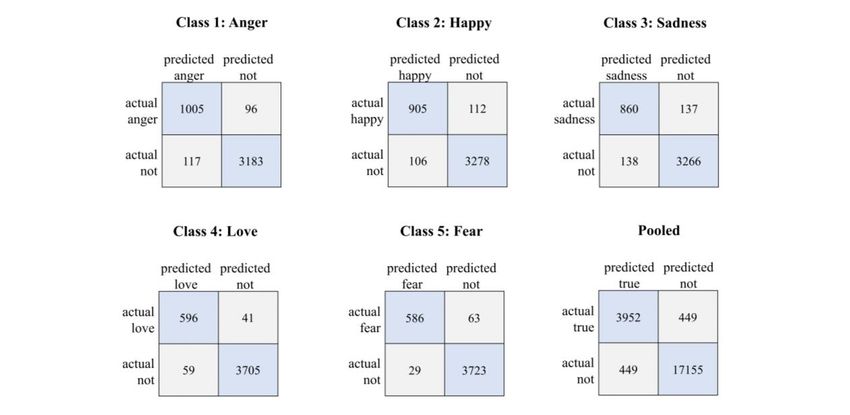
Naufal Hilmiaji, Kemas M Lhaksmana, Mahendra D Purbolaksono
 RESTI Journal (System Engineering and Information Technology) Vol. 5 No. 3 (2021) 584 – 593

ReLU helps to prevent the exponential growth in the fear class has the highest score of recall by 95.3%. The
computation requirements to the CNN operations. As the sadness class has the lowest results of all. It indicates the
CNN scales in size, the computational cost of adding system had more difficulties in classifying tweets to this
extra ReLUs increases linearly. class. It may be caused of the trends of tweets labeled as
 sadness are too complicated for the model to learn.
The output of the convolution layer will then undergo
 Nevertheless, the results are not significant in terms of
pooling. The commonly used pooling method is max
 score interval compared to the other classes, so the
pooling. In this CNN model, the global max-pooling
 model would still get high overall performance results.
layer downsamples the input representation by taking the
global maximum value over the time dimension. Before Table 6. Classification Report
getting into the fully connected layer, the dropout is classes precision recall f1-score
added to the network. In this layer, the data will then be anger 0.913 0.895 0.904
randomly dropped out 50% of the neurons during the happy 0.890 0.895 0.893
training process to reduce overfitting and improve sadness 0.863 0.862 0.893
generalization errors. love 0.936 0.910 0.923
 fear 0.903 0.953 0.927
The fully connected layer predicts whether the input data micro-avg 0.898 0.898 0.898
belongs to the appropriate class of the five emotion macro-avg 0.901 0.903 0.902
classes and it used the Softmax activation function. In
the training process, the CNN model will go through Table 7. Comparison of Previous Studies
epochs and set 0.0003 for the learning rate of Adam classes precision recall f1-score
Optimizer. The loss function used is categorical cross- Logistic
 0.720 0.682 0.697
entropy, considering our model classifies five emotion Regression [10]
classes. As the model fit, the early stopping with the LSTM-GloVe [11] 0.330 0.380 0.350
patience value of 2 will monitor the validation losses. Our CNN Model 0.901 0.903 0.902
Whenever the validation loss keeps improving, it will
 According to the definitions, precision calculates the
gain more epochs. Otherwise, it will stop the training
 number of positive predictions made correctly, and
right away.
 recall measures the number of correct positive
3.2. Text Emotion Classification predictions made from all potential positive predictions
 that could be made. The results show that the CNN
 model is more likely tends to identify a tweet as love of
 all tweets that have love class. Meanwhile, recall tells us
 that the model has the highest probability to correctly
 predict a tweet as fear over the other classes upon all
 tweets that had classified. These cases occur because of
 the dependency on keywords inside a tweet that help the
 CNN model to predict tweets to their appropriate classes.
 The ambiguity of keywords may affect the model to
 predict because the occurrences of them are rarely to be
 found in the whole document. People are often using
 autocorrection features on their devices before posting
 their tweets. The clearer a tweet is in terms of contexts,
 the easier the model recognizes it. However, assuming
 that the tweet consisted of unknown abbreviations or
 words, they may also affect the calculation. If they exist,
 Figure 5. Multiclass Confusion Matrix then the model will try to learn from the other correlated
The predictions are done by classifying tweets into five and the adjacent words to calculate the probability
classes. The confusion matrix in Figure 5 shows the instead of focusing on them. Table 8 shows how the
correctly predicted tweets among their classes. 22.8% of representation of the keywords of a tweet affecting the
the tweets are correctly classified as anger, 20.5% as predictions.
happy, 19.5% as sadness, 13.5% as love, and 13.3% as Based on Table 8, we may see that the first tweet has two
fear. The remaining 10.4% of tweets are misclassified. keywords, which are aman (safe) and nyaman (cozy).
Table 6 shows the evaluation results of each predicted Meanwhile, the second tweet has longer words to
class. These results are base on the confusion matrix in describe what emotion would fit the tweet. The term
Figure 5. The evaluation methods used are accuracy, “safe” and “cozy” are straightforward indicating love by
precision, recall, and F1-score. In Table 6, the highest their means.
precision score is love class, by 93.6%. Meanwhile, the

 DOI: https://doi.org/10.29207/resti.v5i3.3137
 Creative Commons Attribution 4.0 International License (CC BY 4.0)
 590
Naufal Hilmiaji, Kemas M Lhaksmana, Mahendra D Purbolaksono
 RESTI Journal (System Engineering and Information Technology) Vol. 5 No. 3 (2021) 584 – 593

 Figure 6. Pooled Confusion Matrix
 Table 8. Keywords Representation Figure 6 shows how the confusion matrix from Figure 5
 Tweets Keywords Class is pooled by splitting it into the matrix of each class. The
 "Setiap kesempatan yg micro-average method can be calculated by using the
 pernah hadir tuk dapat summed version of the multiclass confusion matrix in
 membuatmu selalu merasa Figure 5, called pooled confusion matrix (Figure 6) [22].
 aman dan nyaman, kini Meanwhile, the macro-average method is calculated by
 jadi suatu kehormatan yg
 pernah didapat." averaging precision, recall, and F1-score on every class.
 aman (safe), The micro-averaged precision, recall, and F1-score were
 Translated: nyaman love
 “Every opportunity that (cozy) obtained by the same value of 89.8%. Meanwhile, the
 has ever been present to macro-averaged precision, recall, and F1-score were
 always feel safe and obtained respectively 90.1%, 90.3%, and 90.2%. Since
 comfortable, has now the pooled confusion matrix has been created, the
 become an honor that has
 accuracy can be calculated by using the formula (2),
 been obtained before.”
 resulting in 89.8% accuracy.
 “Pulang udah H-4 lebaran
 dilema sekali. Seperti tidak In this research, the CNN model will learn the trends
 bisa melakukan apa2 di through the embedding layer. Since tweets are
 rumah sebelum lebaran.
 Buka puasa bareng cuman
 transformed into a sequence of integers, each vocabulary
 3 hari sama keluarga tidak bisa in every tweet will be paired based on their adjacent and
 begitu juga sahur” melakukan correlated word indexes and calculate the probability of
 apa2 di
 Translated:
 rumah sadness
 the occurrences of the whole document. It produces the
 “Going home on D-4 of (cannot do embedding matrix, which will then be used for the model
 Eid is such a dilemma. It is anything at to classify tweets based on their language structure in
 like I cannot do anything at home)
 home before D-day. To Indonesian.
 break my fast with family
 within only 3 days as well
 3.3. Discussion
 as having a pre-dawn A study by [10] using Logistic Regression tends to be
 meal”
 more suitable for classifying a small amount of data.
Hence, the precision score of love class is higher than Some experiments on feature extractions were applied to
other classes. Meanwhile, on the second tweet, there are the model. However, their results from the proposed
no individual keywords that can be observed. Preferably, classifier model are not quite enough to fully meet the
the model uses word phrases to recognize the research standard. In the other study by [11], they had
appropriate class. Referring to these cases, we as human obtained very low-performance results by using the
beings can be easily predicting both tweets to their LSTM-GloVe method. They have also attempted
classes. However, the system would need to learn from experiments by applying multiple hyperparameter
the trends of the whole document before predicting. The combinations, including lowering the learning rates,
same technique may also apply to fear class adding dropouts, and changing the optimizers, but still

 DOI: https://doi.org/10.29207/resti.v5i3.3137
 Creative Commons Attribution 4.0 International License (CC BY 4.0)
 591
Naufal Hilmiaji, Kemas M Lhaksmana, Mahendra D Purbolaksono
 RESTI Journal (System Engineering and Information Technology) Vol. 5 No. 3 (2021) 584 – 593

could not optimize the LSTM model performance F1-score were obtained respectively 90.1%, 90.3%, and
results. It may occur because of the incompleteness of 90.2%, while the accuracy is 89.8%. It is worth
data preprocessing on the raw data since it only mentioning that the parameter combinations played a
undergoes preprocessing inside the layers in the LSTM huge role in optimizing the model.
model that causes the lack of data quality. For instance,
 CNN works more effectively on a comprehensive user-
they had missed word-stemming, which is a necessary
 generated suite of tasks and datasets (e.g., user reviews)
part of data preprocessing. It converts every term into its
 in a much faster computation and has shown better
base form. In this research, word-stemming played an
 performance results compared to the LSTMs [23, 24].
immense role in the data preprocessing process that
 Therefore, CNN is more suitable and applicable for
helps the model to more easily recognize each term in
 datasets consist of tweets considering they are user-
base form.
 generated texts. In this research, the CNN method has
Based on the analysis, both researches had experienced shown significant differences in performance results that
difficulties in optimizing their models. In the first outperformed LSTM. Hence, it is concluded that CNN
research, the Logistic Regression method worked more has proven to be a better method to use for cases of text
effectively than the succeeding. However, despite classification.
having done some experiments on the model, the results
are still low. This issue may indicate that the base model Reference
classifier is the key to getting high-performance results. [1] Statcounter, "Statcounter GlobalStats," Statcounter, March
In the research by [11], the LSTM method encountered 2021. [Online]. Available: https://gs.statcounter.com/social-
very low performance. Since LSTMs are deep learning- media-stats/all/indonesia. [Accessed 22 April 2021].
based models, the quantity of the data matters. The more [2] M. Zaskya, A. Boham and L. J. H. Lotulung, "Twitter Sebagai
 Media Mengungkapkan Diri Pada Kalangan Milenial," ACTA
data used, the better the performance. Although, the data DIURNA KOMUNIKASI, vol. 3, 2021.
used only consisted of 4.403 rows of data which is [3] A. Mehrabian, Nonverbal communication, Routledge, 2017.
insufficient for deep learning models to learn. In another [4] N. Y. Hutama, K. M. Lhaksmana and I. Kurniawan, "Text
way, the model complexity can improve the learning Analysis of Applicants for Personality Classification Using
 Multinomial Naı̈ ve Bayes and Decision Tree," JURNAL
process despite having various amounts of data. For INFOTEL, vol. 12, p. 72–81, 2020.
instance, adding more nodes to the layers will help the [5] J. K. Rout, K.-K. R. Choo, A. K. Dash, S. Bakshi, S. K. Jena
model extracting more information from the data. This and K. L. Williams, "A model for sentiment and emotion
information is used as blueprints when the model starts analysis of unstructured social media text," Electronic
 Commerce Research, vol. 18, p. 181–199, 2018.
to predict. [6] J. W. Simanullang, A. Adiwijaya and S. Al Faraby, "Klasifikasi
This research compares the methods used in the previous Sentimen Pada Movie Review Dengan Metode Multinomial
 Naı̈ ve Bayes," eProceedings of Engineering, vol. 4, 2017.
studies to our CNN method using the same dataset [7] M. Yulietha, S. A. Faraby, W. C. Widyaningtyas and others,
provided by [10], as represented in Table 7. Due to the "An implementation of support vector machine on sentiment
limitations of the data used, it is necessary to add more classification of movie reviews," in Journal of Physics:
nodes within layers to gather more information from the Conference Series, 2018.
 [8] Y. Chen and Z. Zhang, "Research on text sentiment analysis
data through the networks. However, our CNN model based on CNNs and SVM," in 2018 13th IEEE Conference on
implements different feature extraction methods. The Industrial Electronics and Applications (ICIEA), 2018.
methods used are within the CNN layers, e.g., word [9] H. Kim and Y.-S. Jeong, "Sentiment classification using
embeddings in the embedding layer. The embedding convolutional neural networks," Applied Sciences, vol. 9, p.
 2347, 2019.
layer forms the data into the embedding matrix used for [10] M. S. Saputri, R. Mahendra and M. Adriani, "Emotion
the model to digest its contexts. In the training process, classification on indonesian twitter dataset," in 2018
the embedding matrix is used for calculating the International Conference on Asian Language Processing
adjacency and the correlation of each term in every tweet (IALP), 2018.
 [11] A. Larasati, B. Harijanto and F. Rahutomo, "Implementasi Deep
within a whole document. Once the training is done, the Learning Untuk Deteksi Ekspresi Emosi Pada Twitter," in
model predicts the data and evaluates the results. The Seminar Informatika Aplikatif Polinema, 2020.
model produced great final results and showed [12] H. A. Robbani, "PySastrawi," 28 September 2018. [Online].
significant differences in terms of model performance. Available: https://github.com/har07/PySastrawi.
 [13] F. Chollet and others, Keras, 2015.
 [14] M. Abadi and others, TensorFlow: Large-Scale Machine
4. Conclusion Learning on Heterogeneous Systems, 2015.
 [15] Goodfellow, Y. Bengio, A. Courville and Y. Bengio, Deep
In this research, the CNN method is implemented to learning, vol. 1, MIT press Cambridge, 2016.
identify emotion by classifying tweets in Indonesian by [16] Y. Li and T. Yang, "Word embedding for understanding natural
setting the parameter combinations, such as adding 50% language: a survey," in Guide to big data applications, Springer,
 2018, p. 83–104.
dropout, applying L2 regularization, and lowering the [17] A. Zell, N. Mache, R. Hübner, G. Mamier, M. Vogt, M.
Adam Optimizer’s learning rate to 0.0003. The Schmalzl and K.-U. Herrmann, "SNNS (stuttgart neural
performance results are pretty high, considering this network simulator)," in Neural network simulation
research used a small dataset. The precision, recall, and environments, Springer, 1994, p. 165–186.

 DOI: https://doi.org/10.29207/resti.v5i3.3137
 Creative Commons Attribution 4.0 International License (CC BY 4.0)
 592
Naufal Hilmiaji, Kemas M Lhaksmana, Mahendra D Purbolaksono
 RESTI Journal (System Engineering and Information Technology) Vol. 5 No. 3 (2021) 584 – 593

[18] N. Srivastava, G. Hinton, A. Krizhevsky, I. Sutskever and R. [21] Y. Sasaki, "The truth of the F-measure," Teach Tutor Mater, 1
 Salakhutdinov, "Dropout: a simple way to prevent neural 2007.
 networks from overfitting," The journal of machine learning [22] D. Jurafsky and J. Martin, "Naive bayes and sentiment
 research, vol. 15, p. 1929–1958, 2014. classification," Speech and language processing, p. 74–91,
[19] Y. Bengio, R. Ducharme, P. Vincent and C. Janvin, "A neural 2017.
 probabilistic language model," The journal of machine learning [23] X. Zhang, J. Zhao and Y. LeCun, "Character-level
 research, vol. 3, p. 1137–1155, 2003. convolutional networks for text classification," arXiv preprint
[20] M. Hossin, M. N. Sulaiman, A. Mustapha, N. Mustapha and R. arXiv:1509.01626, 2015.
 W. Rahmat, "A hybrid evaluation metric for optimizing [24] S. Bai, J. Z. Kolter and V. Koltun, "An empirical evaluation of
 classifier," in 2011 3rd Conference on Data Mining and generic convolutional and recurrent networks for sequence
 Optimization (DMO), 2011. modeling," arXiv preprint arXiv:1803.01271, 2018.

 DOI: https://doi.org/10.29207/resti.v5i3.3137
 Creative Commons Attribution 4.0 International License (CC BY 4.0)
 593
You can also read