Genome-Wide Analysis of Stowaway-Like MITEs in Wheat Reveals High Sequence Conservation, Gene Association, and Genomic Diversification1 C W
←
→
Page content transcription
If your browser does not render page correctly, please read the page content below
Genome-Wide Analysis of Stowaway-Like MITEs in
Wheat Reveals High Sequence Conservation, Gene
Association, and Genomic Diversification1[C][W]

Beery Yaakov 2, Smadar Ben-David 2, and Khalil Kashkush*
Department of Life Sciences, Ben-Gurion University, Beer-Sheva 84105, Israel

The diversity and evolution of wheat (Triticum-Aegilops group) genomes is determined, in part, by the activity of transposable
elements that constitute a large fraction of the genome (up to 90%). In this study, we retrieved sequences from publicly available
wheat databases, including a 454-pyrosequencing database, and analyzed 18,217 insertions of 18 Stowaway-like miniature
inverted-repeat transposable element (MITE) families previously characterized in wheat that together account for approximately
1.3 Mb of sequence. All 18 families showed high conservation in length, sequence, and target site preference. Furthermore,
approximately 55% of the elements were inserted in transcribed regions, into or near known wheat genes. Notably, we
observed significant correlation between the mean length of the MITEs and their copy number. In addition, the genomic
composition of nine MITE families was studied by real-time quantitative polymerase chain reaction analysis in 40 accessions
of Triticum spp. and Aegilops spp., including diploids, tetraploids, and hexaploids. The quantitative polymerase chain reaction
data showed massive and significant intraspecific and interspecific variation as well as genome-specific proliferation and
nonadditive quantities in the polyploids. We also observed significant differences in the methylation status of the insertion
sites among MITE families. Our data thus suggest a possible role for MITEs in generating genome diversification and in the
establishment of nascent polyploid species in wheat.

   Wheat (Triticum-Aegilops group) likely originated                           of wheat and their polyploid species as research
from a common ancestor some 4 million years ago and                            models allows for the tracking of those evolutionary
has since undergone multiple polyploidization events.                          changes that enabled diversification of the different
As such, this organism has been the subject of sub-                            genomes as well as their differentiation within the
stantial research into genomic evolution and diver-                            polyploid species. Past studies on phylogenetic rela-
sification. Beginning with three ancestral diploid                              tionships between members of the Triticum-Aegilops
species, two major allopolyploidization events subse-                          group employed nuclear (Mori et al., 1995; Sasanuma
quently occurred, resulting in the appearance of tet-                          et al., 1996; Wang et al., 2000a; Huang et al., 2002;
raploid (pasta) wheat (Triticum turgidum ssp. durum;                           Kudryavtsev et al., 2004; Sallares and Brown, 2004)
2n = 4x = 28; genome AABB) around 0.5 million years                            or organellar (Wang et al., 2000b; Haider and
ago and hexaploid (bread) wheat (Triticum aestivum;                            Nabulsi, 2008) DNA markers to cluster divergent
2n = 6x = 42; genome AABBDD) around 10,000 years                               species. At the same time, molecular markers have
ago (Feldman and Levy, 2005). Bread wheat harbors                              been developed to study wheat phylogeny resulting
three distinct, yet related, genomes, namely the Au                            from polymorphism in transposable element (TE)
genome originating from Triticum urartu, the B (or S)                          insertions (Queen et al., 2004; Kalendar et al., 2011;
genome originating from a section of Sitopsis species,                         Baruch and Kashkush, 2012), including miniature
most probably Aegilops speltoides or Aegilops searsii, and                     inverted-repeat transposable elements (MITEs; Yaakov
the D genome originating from Aegilops tauschii (Petersen                      et al., 2012).
et al., 2006). The availability of several diploid ancestors                      TEs are sequences of DNA that multiply indepen-
                                                                               dently of the cell cycle, with some sequences, termed
                                                                               retrotransposons, relying on transcription to “copy
   1
     This work was supported by the Israel Science Foundation (grant           and paste” themselves into new sites in the genome. A
no. 142/08 to K.K.).                                                           second group of sequences, termed DNA transposons,
   2
     These authors contributed equally to the article.                         employ a recombination-like mechanism to the same
   * Corresponding author; e-mail kashkush@bgu.ac.il.                          end (Wicker et al., 2007). The host genome combats the
   The author responsible for distribution of materials integral to the
                                                                               potential deleterious effects of TE activity by inhibiting
findings presented in this article in accordance with the policy de-
scribed in the Instructions for Authors (www.plantphysiol.org) is:             their transcription and transposition through epi-
Khalil Kashkush (kashkush@bgu.ac.il).                                          genetic mechanisms, such as cytosine methylation,
   [C]
       Some figures in this article are displayed in color online but in        chromatin modification, and RNA interference. MITEs
black and white in the print edition.                                          are nonautonomous DNA elements (i.e. sequences that
   [W]
       The online version of this article contains Web-only data.              rely on transposases expressed by autonomous ele-
   www.plantphysiol.org/cgi/doi/10.1104/pp.112.204404                          ments for their transposition) and are ubiquitous to
486       Plant PhysiologyÒ, January 2013, Vol. 161, pp. 486–496, www.plantphysiol.org Ó 2012 American Society of Plant Biologists. All Rights Reserved.

                                     Downloaded on May 11, 2021. - Published by https://plantphysiol.org
                                  Copyright (c) 2020 American Society of Plant Biologists. All rights reserved.
MITE Dynamics in Wheat
eukaryotic genomes. MITEs are very short in length, the publicly available sequence of a rice-unique MITE
containing up to a few hundred base pairs, and present family, termed mPing (Jiang et al., 2003), as a BLASTN
structural similarity, conserved terminal repeats, and query against the draft 454 wheat sequence database.
high copy numbers in some species (Wicker et al., As expected, no sequences were retrieved from the
2001; Jiang et al., 2004; Isidore et al., 2005; Miller et al., wheat genomic database in this case. It is important to
2006; Cloutier et al., 2007; Choulet et al., 2010). More- mention that because of the unassembled (53 cover-
over, MITEs have been shown to be active in rice age) reads and because of the quality of the sequence
(Oryza sativa; Jiang et al., 2003; Kikuchi et al., 2003; information, we used the following criteria in our
Nakazaki et al., 2003; Shan et al., 2005; Naito et al., analysis. (1) Output sequences from BLASTN with the
2006, 2009). same identifier number in the 454-pyrosequencing
Although several Stowaway-like MITE families have database were removed from the analysis, because in
been characterized in wheat, their structural similarity, some cases the MAK software-generated output file
level of activation, epigenetic regulation, and associa- included sequences from both positive and negative
tion with wheat genes are poorly understood. In this strands. We noticed this phenomenon for MITE fami-
study, we performed a detailed analysis of thousands lies that contain short internal sequences (such as
of MITE insertions belonging to 18 Stowaway-like ele- Athos; Table I), meaning that both positive and nega-
ments as found in publicly available wheat sequences, tive stands can pass the E-value used in the BLAST
including the 454-pyrosequencing draft of a hexaploid analysis. (2) The 454-pyrosequencing reads that con-
wheat ‘Chinese Spring’ genome. As was reported for tain nearly intact elements that significantly align with
MITEs in other fully sequenced plant genomes, we the query transposon sequence were included in our
noted high sequence conservation, most notably TA- analysis. It is important to note that we considered the
dinucleotide target site preference, and significant as- elements that were truncated at one of the terminal
sociation with transcribed regions in wheat. We also sequences as being nearly intact elements. (3) Dupli-
noticed a significant correlation between the average cated hits in the MAK output file, resulting from du-
length of a MITE family and its copy number in hexa- plicate reads in the 454-pyrosequencing database, were
ploid wheat. Furthermore, we assessed the genomic removed manually by BLAST-based sequence align-
composition of nine MITE families using real-time ment of the flanking sequences of all output MAK file
quantitative PCR (qPCR) in 40 different accessions of sequences to each other and subsequent exclusion of
wheat, including Triticum spp. and Aegilops spp., and similar sequences (see “Materials and Methods”).
predicted their copy numbers, based on the number of Thus, the number of retrieved elements could be an
elements for each family, estimated bioinformatically underestimation and might not represent the true copy
in the hexaploid, employing information from the 454- number of each family in hexaploid wheat. With this in
pyrosequencing database. The qPCR data revealed mind, we noted a massive difference in the number of
Triticum spp. or Aegilops spp. element specificity as retrieved insertions in each family, from 14 insertions
well as deviations from expected additive values in the for Phoebus and up to 2,604 and 4,855 insertions for
polyploid species. Hades and Athos, respectively (Table I). When consid-
ered together, the retrieved MITE sequences account
for approximately 1.3 Mb (calculated based on copy
RESULTS number and average element size) of the approxi-
mately 17,000 Mb that constitutes the wheat genome.
In Silico Analysis of MITEs
Retrieval of Stowaway-Like MITE Families from the Wheat High Level of Conservation of Stowaway-Like MITE
454-Pyrosequencing Database Families in Wheat
The availability of a 454 sequence draft for hexa- Detailed analysis using Galaxy software (see “Ma-
ploid wheat facilitated a genome-wide analysis of 18 terials and Methods”) of each MITE family showed a
characterized Stowaway-like MITE families (publicly high level of conservation in average element length
available at the Triticeae Repeat Sequence Database; (Supplemental Fig. S1). For all MITE families, we
http://wheat.pw.usda.gov/ITMI/Repeats/), given their noted very low variation in the length of the different
short length (Table I). Overall, 18,217 MITE insertions members of the same family, as the SD varied between
were retrieved in silico, using the MITE analysis kit 3.9 and 9.5 bases (Supplemental Fig. S1). This is despite
(MAK) software (kindly provided by Guojun Yang, the fact that truncated elements (nearly intact ele-
University of Toronto; Yang and Hall, 2003; Janicki ments; see above) were included in the analysis. In
et al., 2011). The publicly available sequence of each addition, we observed high sequence conservation for
of the 18 MITEs was used as a query in the MAK the 18 MITE families, as revealed by multiple sequence
program to perform BLASTN against the draft 454- alignment. The level of sequence similarity ranged
pyrosequencing database. Use of the MAK software from 61% for high-copy-number families, such as
also retrieved 100 bp of flanking sequence (59 and 39 Athos, Hades, and Thalos, and up to 99% for families with
flanking sequences) and indicated terminal duplica- low copy numbers, such as Jason, Phoebus, and Poly-
tions for each hit. As a negative control, we included phemus. Interestingly, sequence conservation at terminal
Plant Physiol. Vol. 161, 2013 487
Downloaded on May 11, 2021. - Published by https://plantphysiol.org
Copyright (c) 2020 American Society of Plant Biologists. All rights reserved.Yaakov et al.
Table I. In silico analysis of 18,217 Stowaway-like MITEs
TE BLAST Hitsa Flanking BLAST Hitsb
TE Copy No. Element Size TIR Size Target Site Preference
EST mRNA Total EST mRNA Total
bp % %
Athos 4,855 85 41 TA 38 129 167 (3.4) 1,488 1,071 2,559 (52.7)
Hades 2,604 96 22 TA 25 26 89 (3.4) 1,278 556 1,834 (70.4)
Thalos 2,031 162 61 TA 300 78 378 (18.6) 1,125 266 1,391 (68.4)
Icarus 1,663 112 28 TA 115 27 142 (8.5) 895 239 1,134 (68.1)
Xados 1,391 116 30 TA 79 10 41 (2.9) 595 271 866 (62.2)
Minos 1,132 236 25 TA 10 0 29 (2.5) 300 232 532 (46.9)
Pan 1,048 127 58 AC 37 4 51 (4.8) 782 219 1,001 (95.5)
Aison 775 219 45 TA 21 8 3 (0.3) 393 202 595 (76.7)
Eos 615 354 52 CTTAG 3 0 10 (1.6) 470 39 509 (82.7)
Stolos 538 259 21 TA 2 0 2 (0.3) 149 52 201 (37.3)
Oleus 489 150 30 TA 12 4 16 (3.2) 86 78 164 (33.5)
Antonio 415 108 25 TA 6 3 9 (2.1) 157 99 256 (61.6)
Minimus 335 55 26 TA 2 0 2 (0.5) 157 76 233 (69.5)
Fortuna 169 353 30 TA 2 0 2 (1.1) 118 49 167 (98.8)
Tantalos 112 257 30 TA 1 0 1 (0.8) 23 11 34 (30.3)
Polyphemus 16 241 73 TA 0 0 0 (0) 16 3 19 (118.7)
Jason 15 260 51 TA 0 1 1 (6.6) 0 1 1 (6.6)
Phoebus 14 319 15 CG 0 0 0 (0) 9 2 11 (78.5)
Total 18,217 – – – – – 943 (5.1) – – 11,507 (63.1)
a b
Number (and percentage of the overall number of TEs) of TEs containing EST hits. Number (and percentage of the overall number of TEs) of
TE-flanking sequences (within 100 bp downstream and/or upstream of a TE) containing EST hits.
inverted repeat (TIR) regions was very high for all the National Center for Biotechnology Information
MITE families (over 95%). It is important to note that (NCBI), we identified 943 unique chimeric transcripts
our analysis was unbiased toward highly conserved (653 unique ESTs and 290 unique transcripts contain-
elements, because an E value of e23 was used to re- ing mRNA characteristics) that contained MITE se-
trieve sequences with the MAK software. Recall that quences (Table I). As these 943 transcripts are unique,
we retrieved no mPing elements in the wheat database we assumed them to contain different MITE insertions
using the same E value, indicating that no artifacts and thus concluded that approximately 5.1% (943 of
were obtained in our analysis. 18,217) of the retrieved MITEs underwent transcrip-
The MAK software also retrieves short duplicated tion, most probably from adjacent promoters. We then
target site sequences based on the analysis of both tested the locations of the additional MITE insertions
flanking sequences of a MITE element. We described (18,217 – 934 = 17,283 elements) by annotating MITE-
target site preferences using the short duplicated out- flanking sequences that were retrieved by MAK, to-
put sequences created by MAK as an input file in the gether with the MITEs (see “Materials and Methods”).
WebLogo 3.0 package (Crooks et al., 2004). Briefly, However, because of the short read length (approxi-
WebLogo calculates the relative frequency of each mately 388 bp on average) of the 454-pyrosequencing
nucleotide at a given position and their relative database sequences, we were only able to retrieve
abundance at different positions (see “Materials and short flanking sequences (approximately 100 bp from
Methods”). The observed logos with significant prob- each side of the element). Surprisingly, we found that
abilities of certain nucleotides indicate target site approximately 63% of the MITE insertions (11,507 of
preference. This analysis revealed that the 18 MITE the 18,217 elements) are located adjacent (within 100
families possess notable target site preference (Table I; bp) to unique transcribed sequences (Table I). Detailed
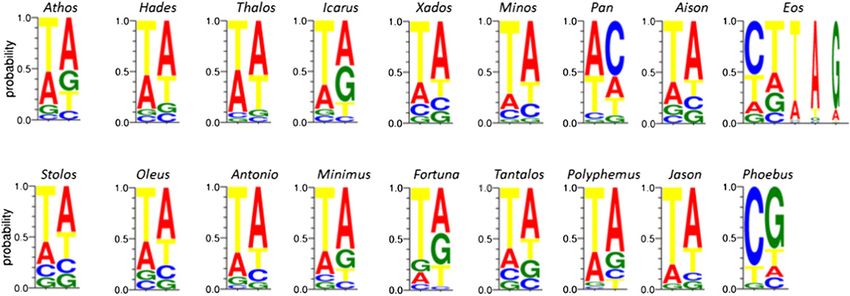
Fig. 1). In most cases, the target site preference was the analysis led to the identification of 76 MITE insertions
TA dinucleotide, in agreement with the literature on within introns or near well-characterized wheat genes
the preference of Stowaway-like MITEs (for review, see (Supplemental Table S1). Specifically, 20 MITE inser-
Jiang et al., 2004). tions (26.3%) were found in the introns of 11 genes
(Supplemental Fig. S2), 24 insertions (31.5%) were
Annotation of MITEs and Flanking Sequences found upstream of the 59 untranslated region of a gene,
and 32 insertions (42.1%) were found downstream of
Because MITEs are nonautonomous, namely lacking the 39 untranslated region of a gene (Supplemental
sequences that code for transposases and a promoter, it is Table S2). The MITE-containing genes included those
assumed that they are not transcribed. However, when involved in disease resistance, transport, cell division,
performing BLAST with MITE sequences against Triticum DNA repair, transcription, and other roles as well as a
spp. and Aegilops spp. EST and mRNA databases from glutenin precursor.
488 Plant Physiol. Vol. 161, 2013
Downloaded on May 11, 2021. - Published by https://plantphysiol.org
Copyright (c) 2020 American Society of Plant Biologists. All rights reserved.MITE Dynamics in Wheat
Figure 1. Target site preference of MITE insertions, as analyzed by WebLogo 3.0. Analysis was performed based on the se-
quence of target site duplications retrieved from wheat databases by MAK software. The name of each MITE family is indicated
on top of each logo. [See online article for color version of this figure.]
Massive Variation in MITE Composition in Triticum and The qPCR results further demonstrate the massive
Aegilops Species proliferation of some MITEs in the A genome (Fig. 2),
as all accessions of T. urartu and species containing the
To evaluate the contribution of MITEs to genomic
A genome (i.e. T. urartu, T. monococcum, T. dicoccoides,
diversification among wheat species, we performed
T. durum, and T. aestivum) showed some base level of
qPCR on genomic DNA from 40 accessions of Triticum
MITE copy number, with most showing high levels.
spp. and Aegilops spp. These included 10 different spe-
Furthermore, two MITE families (Minos and Fortuna)
cies (37 diploid and three polyploid; Supplemental
were specifically amplified in this genome (i.e. Triticum
Table S3), of which 19 contain B genomes, 10 contain D
spp.-specific amplification; Fig. 2, A and C). The other
genomes, eight contain A genomes, two contain AB ge-
nomes (tetraploids), and one contains an ABD genome A genome species, T. monococcum aegilopoides (genome
(hexaploid; Supplemental Table S3). Of the 18 MITEs Am), showed similar copy numbers to T. urartu (ge-
analyzed (Table I), only nine allowed efficient primer nome Au) for four of the nine MITEs (Aison, Oleus,
design for real-time PCR analysis (an example of quality Icarus, and Polyphemus; Fig. 2, B, D, E, and G).
control for qPCR experiments is shown in Supplemental In considering Aegilops spp., only A. speltoides
Fig. S3). By visualizing the PCR products on 1.5% aga- showed species-specific proliferation (for Aison; Fig.
rose gels, PCR amplification quality was further vali- 2B). In addition, copy numbers in A. speltoides and A.
dated (Supplemental Fig. S4). It is important to note that searsii were clearly distinguishable from one another
two different pairs of primers were designed for some (Fig. 2, B, C, and E–G) in five of nine MITEs (Aison,
MITE families so as to ensure reproducibility of the Fortuna, Icarus, Phoebus, and Polyphemus), while A.
qPCR results. The absolute copy number of each MITE sharonensis (accession TH02) and A. longissima (acces-
in each genome was calculated based on an estimated sion TL05) were similar to A. searsii and A. tauschii
copy number in T. aestivum (cv Chinese Spring wheat) (and different from A. speltoides) in three MITEs (Aison,
derived from the 454 database (Table I; see “Materials Icarus, and Polyphemus; Fig. 2, B, E, and G), yet they
and Methods”). Thus, the copy number of any genome is differed from A. searsii and A. tauschii in one MITE
the ratio of its relative quantity to the relative quantity of (Fortuna; Fig. 2C).
T. aestivum, multiplied by the estimated copy number for As expected, none of the analyzed MITEs had low
cv Chinese Spring wheat. Additional validation of the copy numbers in the polyploid species. In addition, of
relative quantification of MITEs in different wheat spe- the nine MITEs analyzed, only two (Minos and For-
cies was derived from our 454-pyrosequencing analy- tuna) showed a shift from the expected additive values
sis of transposon display (TD) products (Yaakov and of the parental species (Fig. 2, A and C) in the poly-
Kashkush, 2012). TD allows the amplification of ploid species (reflected as an increase in the tetraploid
multiple TE insertions using a TE-specific primer level and a reduction in the hexaploid level in Fortuna
together with an adaptor primer. We performed 454- and vice versa for Minos) that could not be explained
pyrosequencing of TD products of one MITE family by any combination of accessions of the parental spe-
called Minos in four wheat species: A. tauschii, A. cies. Interestingly, these two elements are the only
sharonensis, T. monococcum, and T. durum (Yaakov and ones specific to Triticum spp. Note that the nonadditive
Kashkush, 2012). The results show that the relative values that were observed in these two cases, of the
quantities of copy numbers, as provided by both qPCR nine cases considered, were derived from the available
analysis (this study) and 454-pyrosequencing of TD wheat accessions analyzed in this study.
products (Yaakov and Kashkush, 2012), in the four The combination of MITE copy numbers from
wheat species are very similar (Supplemental Fig. S5). A genomes and B genomes, as compared with the
Plant Physiol. Vol. 161, 2013 489
Downloaded on May 11, 2021. - Published by https://plantphysiol.org
Copyright (c) 2020 American Society of Plant Biologists. All rights reserved.Figure 2. (Figure continues on following page.)
490 Plant Physiol. Vol. 161, 2013
Downloaded on May 11, 2021. - Published by https://plantphysiol.org
Copyright (c) 2020 American Society of Plant Biologists. All rights reserved.MITE Dynamics in Wheat
Figure 2. Copy numbers of MITE families Minos (A), Aison (B), Fortuna (C), Oleus (D), Icarus (E), Phoebus (F), Polyphemus (G),
Stolos (H), and Eos (I) in various wheat accessions, based on qPCR and the 454-pyrosequencing database. The accession names
and plant identifiers or U.S. Department of Agriculture inventory numbers (Supplemental Table S3), as well as respective
species names and genome composition, are indicated. SD is indicated based on three replicates. [See online article for color
version of this figure.]
tetraploid genomes, was best explained when T. urartu Examination of the intraspecific coefficient of varia-
was combined with A. speltoides for two elements tion of MITE copy numbers in different accessions of
(Aison and Icarus) or with A. searsii for one element each species revealed that A. speltoides presents the
(Stolos). For the remaining MITEs, this difference could most variation in MITE copy number, specifically
be explained by combining either both or neither of showing high and significant variation in three ele-
these species. ments (Oleus, Eos, and Stolos). T. urartu accessions
Plant Physiol. Vol. 161, 2013 491
Downloaded on May 11, 2021. - Published by https://plantphysiol.org
Copyright (c) 2020 American Society of Plant Biologists. All rights reserved.Yaakov et al.
showed high and significant variation in two elements different methylation environments. It is important to
(Minos and Icarus). For example, the copy number of mention that for most elements, CNG hemimethy-
Minos in TMU38 was approximately 5-fold higher than lation was predominant, except for Thalos-flanking
in the other T. urartu accessions (Fig. 2A). This value CCGG sites, where CG methylation was predominant
was obtained in experiments repeated three times, (Table II). Thalos, however, resides in relatively heavily
using three replicates in each experiment. Similarly, methylated sites (87.2% methylated flanking CCGG
the copy number of Aison in accession 6008 was ap- sites). These data thus support our previous conclusion
proximately 8-fold more than in TS47 (Fig. 2B). Fur- that Thalos might be the least active MITE in wheat
thermore, significant variations were observed in A. (Yaakov and Kashkush, 2011), while Hades and Minos
searsii accessions for Aison (Fig. 2B), with some acces- might be the most active (Yaakov and Kashkush,
sions including one or more copies (such as TE16 and 2012).
TE44), while others included over 170 insertions (such
as 599124 and 599149). In addition, the coefficient of
variation was higher between species (interspecific DISCUSSION
variation) than within a species (intraspecific varia-
tion) for six of nine elements considered (Fortuna, Mi- The evolution of genomes, as reflected in both the
nos, Aison, Icarus, Phoebus, and Stolos). diversification of related species and the differentiation
of homeologous chromosomes in allopolyploids, is
realized by various rapid (revolutionary) and slow
(evolutionary) mechanisms, including the activation of
Cytosine Methylation of MITEs in Hexaploid Wheat TEs (Chantret et al., 2004; Kazazian, 2004; Feldman
To assess the involvement of epigenetic regulation in and Levy, 2005). A detailed mechanism describing the
the activity of MITEs in natural allohexaploid wheat, impact of transposons on genomic evolution, however,
we performed transposon methylation display (TMD) has yet to be presented. Furthermore, any mechanistic
on 13 MITE families (Eos, Fortuna, Oleus, Minos, Thalos, description of TE-mediated genomic evolution would
Aison, Antonio, Hades, Jason, Phoebus, Polyphemus, Tan- necessarily have to take into account the epigenetic
talos, and Xados). TMD allows for analysis of the changes induced by transposition as well as the in-
methylation status of MITE-flanking CCGG sites in a fluence of such changes on chromosomal structure and
genome-wide manner (Khasdan et al., 2010; Kraitshtein gene expression (Slotkin and Martienssen, 2007). Thus,
et al., 2010; Yaakov and Kashkush, 2011). Genomic a genome-wide examination of genetic and epigenetic
DNA was restricted with either of two methylation-
sensitive enzymes (HpaII or MspI), ligated to adap- Table II. Analysis of the methylation status of CCGG sites flanking 13
tors, and amplified with radiolabeled primers specific Stowaway-like MITEs in T. aestivum, as revealed by TMD
to the adaptor and transposon sequences. The result- No. of
ing polyacrylamide gel band patterns were analyzed Methylated Monomorphic
MITE Family CCGG Sitesa Bandsb Totalc
by comparing the ratio of amplicons that exist in only
one restriction digest (e.g. bands generated with HpaII CNG CG
only indicate hemimethylation of the outer cytosine %
[i.e. CNG methylation], whereas bands generated with Hades 29 16 40 85 (52.9)
MspI only indicate methylation of the inner cytosine Thalos 25 70 14 109 (87.2)
[i.e. CG methylation], in CCGG TE-flanking sites) to Xados 25 20 19 64 (70.3)
those found in both restriction digestions (monomor- Minos 18 18 24 60 (60)
phic bands). An example of a TMD gel is presented in Aison 48 13 13 74 (82.4)
Eos 16 21 27 64 (57.8)
Supplemental Figure S6.
Oleus 64 18 33 115 (71.3)
Using TMD, we analyzed between 60 and 115 CCGG Antonio 39 15 14 68 (79.4)
sites flanking each of the 13 MITE elements (Table II). Fortuna 35 23 34 92 (63)
For each element, we calculated the number of Tantalos 42 20 18 80 (77.5)
unmethylated CCGG sites (monomorphic bands gener- Polyphemus 45 30 33 108 (69.4)
ated upon digestion with HpaII and MspI; Supplemental Jason 60 16 20 96 (79.2)
Fig. S6) and the number of methylated CCGG sites Phoebus 49 32 11 92 (88)
(polymorphic bands generated upon digestion with a
Bands present only in samples digested by HpaII or only in samples
HpaII and MspI, where a MspI-unique band indicates digested by MspI are considered as being methylated in CNG and CG
CG methylation and a HpaII-unique band indicates contexts, respectively (see “Materials and Methods”). b
Monomorphic
CNG methylation; Table II; Supplemental Fig. S6). The bands from the HpaII and MspI digestions indicate nonmethylated CCGG
c
TMD results showed that different levels of cytosine sites. The total number of bands indicates the number of analyzed
methylation are observed at CCGG sites flanking the CCGG sites (both methylated and nonmethylated). The level of methyl-
different MITE elements in T. aestivum (Table II). Meth- ated CCGG sites is also indicated. It is important to note that the number
ylation levels ranged from 52.9% for Hades-flanking of CCGG sites flanking MITE insertions is not directly correlated with the
CCGG sites to 87.2% for Thalos-flanking CCGG sites. number of MITE insertions, as some insertions have several CCGG sites
that can be analyzed by TMD (see “Materials and Methods”).
This indicates that different MITE elements exist in
492 Plant Physiol. Vol. 161, 2013
Downloaded on May 11, 2021. - Published by https://plantphysiol.org
Copyright (c) 2020 American Society of Plant Biologists. All rights reserved.MITE Dynamics in Wheat
variation of Stowaway-like MITEs between related heterochromatin and by the production of small RNAs
species and their combined polyploid species might (Nakayashiki, 2011). The tendency of TEs to cause
provide a mechanistic perspective on this important mutations, both genetic and epigenetic, has suppos-
category of transposons. edly been coopted by the host genome to increase
In this study, we retrieved and analyzed the se- genetic variability, as TEs are known to be active
quences of over 18,000 MITE insertions belonging to 18 during stress, in gametes, and in early development
Stowaway-like families in wheat. As expected for (Levin and Moran, 2011). An analogous mechanism
MITEs, based on genome-wide studies in rice (Jiang may be acting on genomes undergoing “genomic
et al., 2004), all 18 families were short in length stress,” such as new polyploids, or over large expanses
(ranging from 55 to 354 bp), presented high sequence of time, following reproductive isolation of a species.
conservation, and displayed a clear preference for TA With this in mind, we calculated the relative quantities
dinucleotides as a target site (Table I). In addition, we of nine MITE families using qPCR for 40 accessions of
found that wheat MITEs might exist in strong associ- 10 species of wheat. We then translated the PCR data
ation with genes or transcribed regions. Indeed, the into absolute copy numbers based on the observed
strong association of MITEs and wheat genes was copy number of MITE families in hexaploid wheat,
reported previously, based on analysis of a subset with each experiment being repeated at least three
of bacterial artificial chromosome (BAC) sequences times using different primer pairs (SD is indicated in
(Sabot et al., 2005; Choulet et al., 2010). Furthermore, each figure). The results demonstrated specific prolif-
massive copy number variation was seen among the eration of two MITE families (Minos and Fortuna; Fig.
18 MITE families, with values ranging from 14 copies 2, A and C, respectively) in the A genome and one in
up to 4,855 (Table I). In addition, genome-specific the B genome of A. speltoides (Aison; Fig. 2B). Further-
proliferation of MITEs may contribute to genomic di- more, differences revealed by qPCR between intra-
versification in diploid species and, possibly, to the specific and interspecific copy number variations of
differentiation of subgenomes in allopolyploid species, MITEs in the diploid wheat genomes suggest that
an event that might aid in their diploidization. More- MITEs play a role in the diversification of genomes
over, we noticed that the relatively short members of during speciation. We specifically focused on MITE
MITE families (namely, those less than 150 bp in content in A. speltoides and A. searsii, the two best
length) had the highest copy numbers, while long el- candidates for contributing the B genome to wheat.
ements (measuring over 200 bp in length) had the MITE content was clearly distinguishable between the
lowest copy numbers. This negative correlation was two species (Fig. 2, B, C, and E–G) in five of nine
found to be statistically significant (Fig. 3). Finally, we MITEs (Aison, Fortuna, Icarus, Phoebus, and Polyphe-
also found that the methylation levels of CCGG sites mus). We also found that A. sharonensis (accession
surrounding each family differed substantially among TH02) and A. longissima (accession TL05) were similar
MITE families (ranging from 52.9% to 88%), indicative to A. searsii and A. tauschii (and different from A.
of different levels of regulation among these elements. speltoides) in three MITEs (Aison, Icarus, and Polyphe-
mus; Fig. 2, B, E, and G). These data, together with the
Genome-Specific Proliferation of MITEs finding that Aison (Fig. 2B) specifically proliferated in
A. speltoides, support A. speltoides as being the choice
TEs assume a central role in the formation and candidate for donating the B genome to wheat. Our
maintenance of structural elements of the genome, data, however, do show that the diploid donor of the B
including telomeres and centromeres. TEs can affect genome underwent massive genomic changes after the
the structure of the genome and the regulation of formation of the allotetraploid. In addition, we showed a
genes by inducing changes in DNA methylation and nonadditive change in the polyploid species, as compared
Figure 3. Correlation between the copy number
of each MITE family and average length, as cal-
culated for elements retrieved from the 454-
pyrosequencing database. The r2 and P values are
indicated. Error bars represent SD for MITE length.
[See online article for color version of this figure.]
Plant Physiol. Vol. 161, 2013 493
Downloaded on May 11, 2021. - Published by https://plantphysiol.org
Copyright (c) 2020 American Society of Plant Biologists. All rights reserved.Yaakov et al.
with their progenitors, in two MITEs that displayed Supplemental Table S3). DNA was isolated from young leaves (4 weeks post
germination) using the DNeasy plant kit (Qiagen).
specific proliferation in the A genome (Fortuna and Mi-
nos), suggesting that T. urartu is the true donor (Feldman
and Levy, 2005). This result, in concert with known ge- In Silico Analysis
netic and epigenetic changes that occur following poly-
MITEs and flanking sequences were retrieved from the cv Chinese Spring
ploidization, including transcriptional (Kashkush et al., 454-pyrosequencing database (53 coverage; kindly provided by members of
2002, 2003) and transpositional (Kraitshtein et al., 2010; the Chinese Spring Sequencing Consortium; http://www.cerealsdb.uk.net),
Yaakov and Kashkush, 2012) activation of tran- where over 95% of the genome is represented by at least one read using the
sposons, implies that TEs respond to hybridization, MITE analysis kit (Yang and Hall, 2003) below an E value of e23, an end
mismatch tolerance of 20 nucleotides, and a 100-nucleotide flanking size for
resulting in the differentiation and diploidization of retrieved members, and from the NCBI using the BLAST 2.0 package (http://
the subgenomes. www.ncbi.nlm.nih.gov/BLAST/) on the publicly available Triticum spp. and
Aegilops spp. BAC sequences. All analyses included the rice (Oryza sativa)-
specific MITE, mPing, as a negative control (Jiang et al., 2003). MAK uses
Correlation between Element Length and Copy Number BLASTN to search input MITE sequences against a nucleotide database to
retrieve high-scoring pairs, according to a defined E value and nucleotide
In a recent study of rice, we showed a possible con- mismatches at the ends of the sequence, as well as retrieving target site du-
plications and a defined number of nucleotides flanking the high-scoring
nection between the copy numbers of TEs and the pairs. Preparation and statistical analysis of the 454-pyrosequencing reads
methylation levels of flanking CCGG sites, where a were achieved using Galaxy (Blankenberg et al., 2010; Goecks et al., 2010). For
negative correlation was seen in different rice strains for the calculation of average read lengths and MITE lengths in the 454 database,
a MITE family termed mPing (Baruch and Kashkush, we used Compute Sequence Length, which calculates the lengths of nucleotide
sequences in a FASTA file, and Summary Statistics, which calculates the
2012). The nature of the connection between the meth-
summation, mean, SD, and various percentiles of a series of numbers (in this
ylation of TE insertion sites and TE copy number could case, sequence lengths) in Galaxy. Levels of sequence conservation in each
be explained by a difference in the genomic context of MITE family and analysis of target site preference for each MITE family were
the initial insertion of an element. Whereas high-copy- performed using MAFFT for multiple sequence alignment (Katoh et al., 2009)
number MITEs were inserted into euchromatic regions, and the publicly available online WebLogo 3.0 package (Crooks et al., 2004).
The WebLogo 3.0 software creates logos for each MITE family sequence and
where they are able to easily proliferate, low-copy- for target site preferences (for examples, see Fig. 1), where the height of
number MITEs were inserted into heterochromatic symbols within the stack indicates the relative frequency of each nucleotide at
regions, where element transposition is hindered by the that position, while the width of the stack is proportional to the fraction of
silenced chromatin. Here, we assessed the nature of this valid nucleotides at that position, such that an abundance of short sequences
yields thin stacks at the end. It is important to mention that because the 454-
connection in detail for 13 MITE families in a natural pyrosequencing database is not assembled, it includes many redundant se-
hexaploid wheat ‘Chinese Spring’. The overall methyl- quences. In addition, redundant sequences can be produced as a result of the
ation level of all MITE sites was high, as reported pre- analysis of both the NCBI and 454-pyrosequencing databases. Redundant
viously (Yaakov and Kashkush, 2011), yet we found no MITE-containing sequences were removed manually by comparing a subset of
correlation with copy numbers. We did, however, note sequences with the database and manually calculating redundancy (the
number of sequences with an E value equal to or lower than the query se-
a significant negative correlation between mean ele- quence against itself, divided by the total number of sequences analyzed).
ment lengths (as calculated for all elements retrieved Copy number was then corrected using this factor.
from the 454 database; Supplemental Table S1) and Annotation of MITE sequences and their flanking sequences was per-
their copy numbers (P = 0.0297, r2 = 0.28; Fig. 3). This formed against the EST and mRNA databases at PlantGDB (http://www.
plantgdb.org/prj/ESTCluster/) and NCBI (http://www.ncbi.nlm.nih.gov/
result suggests three possible reasons for the success of nucest/), respectively. The annotation was performed using BLAST+, stand-
short-sequence MITEs: (1) short-sequence MITEs can alone version 2.2.24. Redundant transcripts and hits below an E value of e210
evade the epigenetic silencing mechanisms imposed on were removed from the analysis. The 59 and 39 MITE flanking sequences from
larger elements; (2) short-sequence MITEs are less likely the 454-pyrosequencing database, as well as the MITEs themselves, were used
to be eliminated by recombinational mechanisms; and separately as query against the above-mentioned EST databases. Furthermore,
publicly available BAC sequences that contain MITE sequences were ana-
(3) the chances of short-sequence MITEs to transpose is lyzed for the association of MITEs with wheat genes (i.e. located in an in-
higher due to the proximity of the TIRs to one another. tron, 1 kb downstream or upstream from a given gene). Statistical analysis
In summary, this study has demonstrated that wheat of the correlation between the overall methylation status of MITEs or their
MITEs may have retained their activity throughout ev- average length and MITE copy number was performed with JMP version
5 (SAS Institute).
olution. As such, MITEs might play a prominent role in
the diversification of the wheat genome, specifically in
the stabilization of nascent polyploid species in nature, Real-Time qPCR
and could provide new insight into the origin of the B Primers for previously annotated MITE consensus sequences were
genome. designed using Primer Express software, version 2.0 (Applied Biosystems;
Supplemental Table S4). Each template for qPCR analysis was run in triplicate
reactions, each consisting of 7.5 mL of KAPA SYBR FAST Universal 23 qPCR
MATERIALS AND METHODS Master Mix (KAPA Biosystems), 5 mL of DNA template (0.24 ng mL), 1 mL of
forward primer (10 mM), 1 mL of reverse primer (10 mM), 0.3 mL of ROX low
Plant Material and DNA Isolation (serving as a passive reference dye), and 0.2 mL of Ultra Pure Water (Bio-
logical Industries). The thermal profile employed with the 7500 Fast Real-
In this study, 40 accessions of Triticum spp. and Aegilops spp., including 10 Time PCR system (Applied Biosystems) consisted of 20 s at 95°C, then 40
different diploid, tetraploid, and hexaploid species, were used (Supplemental cycles of 3 s at 95°C and 30 s at 60°C. The relative quantity (RQ) of each
Table S3). This includes 34 accessions of four diploid species (Triticum urartu, MITE was measured in comparison with the VRN1 gene and with TQ27 as
Aegilops speltoides, Aegilops searsii, and Aegilops tauschii; for details, see reference, as described previously (Kraitshtein et al., 2010), based on the
494 Plant Physiol. Vol. 161, 2013
Downloaded on May 11, 2021. - Published by https://plantphysiol.org
Copyright (c) 2020 American Society of Plant Biologists. All rights reserved.MITE Dynamics in Wheat
following equation: DDCt(test sample) = [Ct(target) – Ct(VRN1)]test sample – [Ct(target) – Ct Supplemental Figure S4. Quality control for qPCR amplification products.
–DDCt
(VRN1)]TQ27, that is, RQ = (2 3 primer efficiency) , where Ct denotes the
Supplemental Figure S5. Comparison of relative quantities derived from
cycle at which the PCR amplification reaches a certain level of fluorescence
454-TD and qPCR.
(Livak and Schmittgen, 2001). The relative quantity for each sample was
then normalized to its ploidy level, as tetraploids and hexaploids have Supplemental Figure S6. Examples of TMD patterns.
twice and three times as many VRN1 genes, as compared with diploids,
respectively. Reproducibility of the results was evaluated for each sample Supplemental Table S1. Number of TEs inserted adjacent to or into known
by running three technical replicates of each reaction. To distinguish spe- genes.
cific from nonspecific PCR products, a melting curve was generated im- Supplemental Table S2. List of MITE-flanking genes.
mediately after amplification consisting of a 15-s incubation at 95°C and a
1-min incubation at 60°C, after which time the temperature was increased Supplemental Table S3. List of wheat species and accessions used in the study.
by increments of 0.1°C s21 until 95°C was reached. A single specific pro- Supplemental Table S4. List of primers used for qPCR.
duct was detected using either the target or reference gene as template. The
copy number of each accession or species was calculated by multiplying the Supplemental Table S5. List of TE-specific primers used for TMD reactions.
ratio of its relative quantity to that of Triticum aestivum (accession TAA01)
with the copy number (CN) of T. aestivum retrieved from the 454 database
for each MITE: (RQsample O RQTAA01) 3 CNT. aestivum. All primer efficiencies ACKNOWLEDGMENTS
were derived from standard curves with an adequate slope (between 23.0
and 23.6) and r2 . 0.98 (for an example, see Supplemental Fig. S3). Fold We thank Dr. Guojun Yang (University of Toronto) for providing the
amplification at each cycle was calculated according to PCR efficiency, updated stand-alone MAK software, Moshe Feldman (Weizmann Institute)
which was deduced by the software from the slope of the regression line (y) and Hakan Ozkan (University of Cukurova) for providing seed material,
according to the following equation: E = [(1021/y) 2 1] 3 100. For primers and Mike Bevan (John Innes Center), Neil Hall (Liverpool University), and
with 100% efficiency, fold amplification equals 2. Keith Edwards (Bristol University) for providing access to the 454 database
and for their permission to publish the data.
Site-Specific PCR Received July 26, 2012; accepted October 24, 2012; published October 26, 2012.
PCR was prepared using 12 mL of Ultra Pure Water (Biological Industries),
2 mL of 103 Taq DNA polymerase buffer (EURX), 2 mL of 25 mM MgCl2 (EURX),
0.8 mL of 2.5 mM deoxyribonucleotide triphosphates, 0.2 mL of Taq DNA poly-
LITERATURE CITED
merase (5 units mL21; EURX), 1 mL of each qPCR primer (50 ng mL21), and 1 mL of Baruch O, Kashkush K (2012) Analysis of copy-number variation, inser-
template genomic DNA (approximately 50 ng mL21). The PCR conditions tional polymorphism, and methylation status of the tiniest class I (TRIM)
employed were 94°C for 3 min, repeat (94°C for 1 min, 60°C for 1 min, 72°C for and class II (MITE) transposable element families in various rice strains.
1 min) 30 times, and 72°C for 3 min. PCR products (approximately 10 mL) were Plant Cell Rep 31: 885–893
separated on 1.5% agarose gels and stained with ethidium bromide (Amresco), Blankenberg D, Von Kuster G, Coraor N, Ananda G, Lazarus R, Mangan
along with a DNA standard (100-bp ladder; Fermentas). Primer sequences are M, Nekrutenko A, Taylor J (2010) Galaxy: a Web-based genome anal-
available upon request.
ysis tool for experimentalists. Curr Protoc Mol Biol 19: 19.10.1–19.10.21
Chantret N, Cenci A, Sabot F, Anderson O, Dubcovsky J (2004) Se-
TMD quencing of the Triticum monococcum hardness locus reveals good mi-
crocolinearity with rice. Mol Genet Genomics 271: 377–386
TMD reactions were performed according to a previously published protocol Choulet F, Wicker T, Rustenholz C, Paux E, Salse J, Leroy P, Schlub S, Le
(Kashkush and Khasdan, 2007). Briefly, DNA was cleaved with two isoschizo- Paslier MC, Magdelenat G, Gonthier C, et al (2010) Megabase level
mers, HpaII and MspI, both able to recognize CCGG sites, with HpaII being sequencing reveals contrasted organization and evolution patterns of
sensitive to methylation of either cytosine (except when the external cytosine is the wheat gene and transposable element spaces. Plant Cell 22: 1686–
hemimethylated [i.e. when methylation of only one DNA strand occurs]) and 1701
MspI being affected only when the external cytosine is methylated. Thus, the Cloutier S, McCallum BD, Loutre C, Banks TW, Wicker T, Feuillet C,
different types of CCGG site methylation resulted in different isoschizomer- Keller B, Jordan MC (2007) Leaf rust resistance gene Lr1, isolated from
generated cleavage patterns and the appearance of polymorphic PCR frag- bread wheat (Triticum aestivum L.) is a member of the large psr567 gene
ments. Gel-based and sequence analyses of the TMD products revealed that each
family. Plant Mol Biol 65: 93–106
TMD band contains a chimeric (TE/flanking DNA) sequence. Note that in some
Crooks GE, Hon G, Chandonia JM, Brenner SE (2004) WebLogo: a se-
cases, TE internal sequences might also be amplified, thus enabling analysis of
quence logo generator. Genome Res 14: 1188–1190
the methylation status of CCGG sites within that transposon.
Feldman M, Levy AA (2005) Allopolyploidy: a shaping force in the evo-
Primers were designed for 13 of the 18 MITEs (some MITEs did not allow
lution of wheat genomes. Cytogenet Genome Res 109: 250–258
efficient primer design, and some were excluded as they contained a terminal
Goecks J, Nekrutenko A, Taylor J Galaxy Team (2010) Galaxy: a com-
CCGG site). These primers (Supplemental Table S5) were used together with
prehensive approach for supporting accessible, reproducible, and
an adapter primer containing four additional selective nucleotides (TCAG)
transparent computational research in the life sciences. Genome Biol 11:
(Kashkush and Khasdan, 2007) to amplify fragments of DNA resulting from the
R86
HpaII and MspI digestions. Levels of methylation were calculated by dividing
Haider N, Nabulsi I (2008) Identification of Aegilops L. species and Triti-
the number of polymorphic bands from the HpaII and MspI digestions (indi-
cum aestivum L. based on chloroplast DNA. Genet Resour Crop Evol 55:
cating methylated CCGG sites) by the total number of bands. Note that mon-
537–549
omorphic bands in both HpaII and MspI digestions, indicative of nonmethylated
Huang SX, Sirikhachornkit A, Faris JD, Su XJ, Gill BS, Haselkorn R,
CCGG sites, were scored only once. It is important to mention that the calculated
Gornicki P (2002) Phylogenetic analysis of the acetyl-CoA carboxylase
number of methylation levels might be underestimated, as the TMD assay does
not detect cases where both cytosines are methylated, since both isoschizomers and 3-phosphoglycerate kinase loci in wheat and other grasses. Plant
do not cleave the site. As such, no PCR products are seen in such instances. Mol Biol 48: 805–820
Isidore E, Scherrer B, Chalhoub B, Feuillet C, Keller B (2005) Ancient
haplotypes resulting from extensive molecular rearrangements in the
Supplemental Data wheat A genome have been maintained in species of three different
ploidy levels. Genome Res 15: 526–536
The following materials are available in the online version of this article.
Janicki M, Rooke R, Yang GJ (2011) Bioinformatics and genomic analysis
Supplemental Figure S1. Average MITE lengths retrieved from the 454 database. of transposable elements in eukaryotic genomes. Chromosome Res 19:
787–808
Supplemental Figure S2. List of MITE containing wheat genes.
Jiang N, Bao ZR, Zhang XY, Hirochika H, Eddy SR, McCouch SR, Wessler
Supplemental Figure S3. Quality control for qPCR experiment efficiency. SR (2003) An active DNA transposon family in rice. Nature 421: 163–167
Plant Physiol. Vol. 161, 2013 495
Downloaded on May 11, 2021. - Published by https://plantphysiol.org
Copyright (c) 2020 American Society of Plant Biologists. All rights reserved.Yaakov et al.
Jiang N, Feschotte C, Zhang XY, Wessler SR (2004) Using rice to under- Nakazaki T, Okumoto Y, Horibata A, Yamahira S, Teraishi M, Nishida H,
stand the origin and amplification of miniature inverted repeat trans- Inoue H, Tanisaka T (2003) Mobilization of a transposon in the rice
posable elements (MITEs). Curr Opin Plant Biol 7: 115–119 genome. Nature 421: 170–172
Kalendar R, Flavell AJ, Ellis TH, Sjakste T, Moisy C, Schulman AH (2011) Petersen G, Seberg O, Yde M, Berthelsen K (2006) Phylogenetic rela-
Analysis of plant diversity with retrotransposon-based molecular tionships of Triticum and Aegilops and evidence for the origin of the A,
markers. Heredity (Edinb) 106: 520–530 B, and D genomes of common wheat (Triticum aestivum). Mol Phylo-
Kashkush K, Feldman M, Levy AA (2002) Gene loss, silencing and genet Evol 39: 70–82
activation in a newly synthesized wheat allotetraploid. Genetics 160: Queen RA, Gribbon BM, James C, Jack P, Flavell AJ (2004)
1651–1659 Retrotransposon-based molecular markers for linkage and genetic di-
Kashkush K, Feldman M, Levy AA (2003) Transcriptional activation of versity analysis in wheat. Mol Genet Genomics 271: 91–97
retrotransposons alters the expression of adjacent genes in wheat. Nat Sabot F, Guyot R, Wicker T, Chantret N, Laubin B, Chalhoub B, Leroy P,
Genet 33: 102–106 Sourdille P, Bernard M (2005) Updating of transposable element an-
Kashkush K, Khasdan V (2007) Large-scale survey of cytosine methylation notations from large wheat genomic sequences reveals diverse activities
of retrotransposons and the impact of readout transcription from long and gene associations. Mol Genet Genomics 274: 119–130
terminal repeats on expression of adjacent rice genes. Genetics 177: Sallares R, Brown TA (2004) Phylogenetic analysis of complete 59 external
1975–1985 transcribed spacers of the 18S ribosomal RNA genes of diploid Aegilops
Katoh K, Asimenos G, Toh H (2009) Multiple alignment of DNA sequences and related species (Triticeae, Poaceae). Genet Resour Crop Evol 51:
with MAFFT. Methods Mol Biol 537: 39–64 701–712
Kazazian HH Jr (2004) Mobile elements: drivers of genome evolution. Sasanuma T, Miyashita NT, Tsunewaki K (1996) Wheat phylogeny de-
Science 303: 1626–1632 termined by RFLP analysis of nuclear DNA. 3. Intra- and interspecific
Khasdan V, Yaakov B, Kraitshtein Z, Kashkush K (2010) Developmental variations of five Aegilops sitopsis species. Theor Appl Genet 92: 928–
timing of DNA elimination following allopolyploidization in wheat. 934
Genetics 185: 387–390 Shan X, Liu Z, Dong Z, Wang Y, Chen Y, Lin X, Long L, Han F, Dong Y,
Kikuchi K, Terauchi K, Wada M, Hirano HY (2003) The plant MITE mPing Liu B (2005) Mobilization of the active MITE transposons mPing and
is mobilized in anther culture. Nature 421: 167–170 Pong in rice by introgression from wild rice (Zizania latifolia Griseb.). Mol
Kraitshtein Z, Yaakov B, Khasdan V, Kashkush K (2010) Genetic and Biol Evol 22: 976–990
epigenetic dynamics of a retrotransposon after allopolyploidization of Slotkin RK, Martienssen R (2007) Transposable elements and the epige-
wheat. Genetics 186: 801–812 netic regulation of the genome. Nat Rev Genet 8: 272–285
Kudryavtsev AM, Martynov SP, Broggio M, Buiatti M (2004) Evaluation Wang C, Shi SH, Wang JB, Zhong Y (2000a) Phylogenetic relationships of
of polymorphism at microsatellite loci of spring durum wheat (Triticum diploid species in Aegilops inferred from the ITS sequences of nuclear
durum Desf.) varieties and the use of SSR-based analysis in phylogenetic ribosomal DNA. Acta Bot Sin 42: 507–511
studies. Russ J Genet 40: 1102–1110 Wang GZ, Matsuoka Y, Tsunewaki K (2000b) Evolutionary features of
Levin HL, Moran JV (2011) Dynamic interactions between transposable chondriome divergence in Triticum (wheat) and Aegilops shown by
elements and their hosts. Nat Rev Genet 12: 615–627 RFLP analysis of mitochondrial DNAs. Theor Appl Genet 100: 221–231
Livak KJ, Schmittgen TD (2001) Analysis of relative gene expression data Wicker T, Sabot F, Hua-Van A, Bennetzen JL, Capy P, Chalhoub B,
using real-time quantitative PCR and the 2(-Delta Delta C(T)) method. Flavell A, Leroy P, Morgante M, Panaud O, et al (2007) A unified
Methods 25: 402–408 classification system for eukaryotic transposable elements. Nat Rev
Miller AK, Galiba G, Dubcovsky J (2006) A cluster of 11 CBF transcription Genet 8: 973–982
factors is located at the frost tolerance locus Fr-Am2 in Triticum mono- Wicker T, Stein N, Albar L, Feuillet C, Schlagenhauf E, Keller B (2001)
coccum. Mol Genet Genomics 275: 193–203 Analysis of a contiguous 211 kb sequence in diploid wheat (Triticum
Mori N, Liu YG, Tsunewaki K (1995) Wheat phylogeny determined by monococcum L.) reveals multiple mechanisms of genome evolution.
RFLP analysis of nuclear-DNA. 2. Wild tetraploid wheats. Theor Appl Plant J 26: 307–316
Genet 90: 129–134 Yaakov B, Ceylan E, Domb K, Kashkush K (2012) Marker utility of min-
Naito K, Cho E, Yang GJ, Campbell MA, Yano K, Okumoto Y, Tanisaka T, iature inverted-repeat transposable elements for wheat biodiversity and
Wessler SR (2006) Dramatic amplification of a rice transposable element evolution. Theor Appl Genet 124: 1365–1373
during recent domestication. Proc Natl Acad Sci USA 103: 17620–17625 Yaakov B, Kashkush K (2011) Massive alterations of the methylation pat-
Naito K, Zhang F, Tsukiyama T, Saito H, Hancock CN, Richardson AO, terns around DNA transposons in the first four generations of a newly
Okumoto Y, Tanisaka T, Wessler SR (2009) Unexpected consequences formed wheat allohexaploid. Genome 54: 42–49
of a sudden and massive transposon amplification on rice gene ex- Yaakov B, Kashkush K (2012) Mobilization of Stowaway-like MITEs in
pression. Nature 461: 1130–1134 newly formed allohexaploid wheat species. Plant Mol Biol 80: 419–427
Nakayashiki H (2011) The trickster in the genome: contribution and control Yang GJ, Hall TC (2003) MAK, a computational tool kit for automated
of transposable elements. Genes Cells 16: 827–841 MITE analysis. Nucleic Acids Res 31: 3659–3665
496 Plant Physiol. Vol. 161, 2013
Downloaded on May 11, 2021. - Published by https://plantphysiol.org
Copyright (c) 2020 American Society of Plant Biologists. All rights reserved.You can also read