A Simulation-Based Optimization Method for Warehouse Worker Assignment
←
→
Page content transcription
If your browser does not render page correctly, please read the page content below
algorithms
Article
A Simulation-Based Optimization Method for
Warehouse Worker Assignment
Odkhishig Ganbold * , Kaustav Kundu               , Haobin Li and Wei Zhang *
 Department of Industrial Systems Engineering and Management, Faculty of Engineering, National University
 of Singapore, Singapore 117576, Singapore; isekk@nus.edu.sg (K.K.); li_haobin@nus.edu.sg (H.L.)
 * Correspondence: iseog@nus.edu.sg (O.G.); isezw@nus.edu.sg (W.Z.)

 Received: 30 September 2020; Accepted: 1 December 2020; Published: 4 December 2020

 Abstract: The general assignment problem is a classical NP-hard (non-deterministic polynomial-time)
 problem. In a warehouse, the constraints on the equipment and the characteristics of consecutive
 processes make it even more complicated. To overcome the difficulty in calculating the benefit of an
 assignment and in finding the optimal assignment plan, a simulation-based optimization method is
 introduced. We first built a simulation model of the warehouse with the object-oriented discrete-event
 simulation (O2DES) framework, and then implemented a random neighborhood search method
 utilizing the simulation output. With this method, the throughput and service level of the warehouse
 can be improved, while keeping the number of workers constant. Numerical results with real data
 demonstrate the reduction of discrepancy between inbound and outbound service level performance.
 With a less than 10% reduction in inbound service level, we can achieve an over 30% increase in
 outbound service level. The proposed decision support tool assists the warehouse manager in dealing
 with warehouse worker allocation problem under conditions of random daily workload.

 Keywords: discrete-event simulation; simulation-based optimization; assignment problem;
 neighborhood search; warehouse

1. Introduction
      Workforce planning has been reported to be a persistent problem for a variety of process-centered
industries [1]. These include healthcare operations—in particular, emergency departments,
service industries, and warehouse management—whose performances are dependent on swift
and even flows of resources and customers [2–4]. As the theory of swift and even flow suggests,
the bottleneck management and process standardization are key to the speed and variance of the
process flow [2]. The productivity of any process increases with the speed at which the materials
(or information) flow through the process [5]. This indicates the importance of workforce planning for
improving productivity.
      Warehousing is a vital component of the supply chain, where the optimal planning of its
workforce is a prerequisite towards achieving its global efficiency [6]. In a warehouse, a sequence of
multiple processes is performed, starting from shipment arrivals and ending in shipment releases.
These processes are usually constrained by space and workforce capacity. The main focus of the current
study is the workforce planning system implemented in a warehouse. As the labor resources represent
a significant cost item in a labor-short country such as Singapore; this poses new challenges for cost
minimization and efficiency improvements via innovations in workforce planning and optimization.
The preliminary analysis of the warehouse operations, and specifically worker allocation, revealed an
unbalanced utilization of workers across different warehouse activities. It was identified that one of
the critical bottlenecks affecting overall service level of the warehouse was the need to optimize worker
assignment to each task/workstation while balancing the workload of each workstation.

Algorithms 2020, 13, 326; doi:10.3390/a13120326                           www.mdpi.com/journal/algorithms
Algorithms 2020, 13, 326 2 of 16
In the traditional assignment optimization problem, the benefit can be directly calculated given
a fixed worker–task pairing. Even with this assumption, the assignment problem is NP-hard [7].
The problem in the warehouse is more complicated due to the precedence constraints, whereby the
succeeding activity cannot start until the preceding activity is completed. Another related problem is
the assembly line balancing, which considers the precedence constraints. However, oftentimes such
problems do not consider worker capability and capacity factors, which are critical to human resource
allocation problems [8].
Discrete-event simulation (DES) is one of the popular modeling techniques in which a model
changes only at a discrete random set of time points [9]. Nowadays, many commercial simulation
software packages such as Arena integrate optimization techniques with DES [10,11]. Although such
commercial software packages are designed to provide users with functionality to create their desired
simulation models based on processes, oftentimes the users are not allowed to customize the event
logic, which is an integral part of each DES model [10]. In this study, we adopt the object-oriented
discrete-event simulation (O2DES in C#) framework developed by Li et al. [12]. This novel framework
features a flexible simulation modeling environment, which allows the user to customize the event logic,
configure simulation parameters, and incorporate add-on algorithms, including optimization models.
Our research aim was to develop a simulation-based optimization method to improve the
warehouse service level, i.e., daily productivity, by optimally allocating warehouse workers into
inbound and outbound activities, while at the same time considering all operational constraints
of the warehouse’s operation. In addressing this aim, a warehouse manpower planning tool was
developed based on the simulation-based optimization method, which combines the O2DES simulation
framework and a random neighborhood search method. Our study is the first in the operations research
domain to introduce a decision support tool for warehouse worker allocation using a simulation-based
optimization method.
The manpower allocation tool was tested in a warehouse located at Singapore. It is now used to
support the warehouse managers’ decisions on a weekly and/or daily basis.
The rest of the paper is organized as follows. In Section 2, a literature review on the related topics is
presented. Next, the worker assignment problem in the warehouse is described in Section 3. Section 4
outlines the simulation-based optimization method. The O2DES framework and the warehouse
simulation model are introduced in Section 5, followed by the simulation-based optimization algorithm
specifications in Section 6. Section 7 presents the numerical results.
2. Literature Review
Customer satisfaction via effective resource utilization, the shipment of the right product in
good condition and within the target shipment time, is the key objective of warehousing [13–16].
Warehousing aims to address the differences in time and space between suppliers and customers, while
adapting to the fluctuating market conditions [17]. Warehouses execute a broad range of process-based
functions, including temporary storage, protecting goods, service support in customer order fulfillment,
goods packaging, after sales service support, quality inspections, testing, assembly, and repairs [18,19].
In the current global economic environment, the warehouses face an unprecedented level of
competitive and economic pressures [20], including a high level of uncertainty and risk of supply chain
disruptions due to the COVID-19 pandemic [21,22]. The pressures from competitors and customers
result in the reduction of profit margins [23,24]. Under this situation, efficient resource utilization
becomes more critical than ever.
Humans are the central and most critical elements of the resource base in warehousing [25].
Due to the high fluctuations (both predictable and unexpected) in workload demand [18], research has
advocated the need for the implementation of manpower planning strategies [20,26]. For example,
Edwards et al. [27] distinguishes three phases of manpower planning, which include the prediction
of manpower demand, the prediction of the future supply of manpower, and reconciliation of the
discrepancies between supply and demand via workforce scheduling and staffing. ConsideringAlgorithms 2020, 13, 326 3 of 16
the above, workforce scheduling—and specifically personnel work assignments that deal with
the allocation of personnel to tasks and work stations—is crucial to warehouse operational
efficiency [6,28,29]. Optimal staffing, or allocation of workers to tasks, is the key to tackling the
challenges of high demand fluctuations on a daily basis. In the warehouse, this problem is dependent
on workers; qualifications, i.e., skill sets, which are very specific to each employee.
The most relevant problem to our topic is the mixed-model assembly line balancing problem
(MALBP), which tries to assign the tasks of different models to the workstations. It is called a
mixed-model as multiple models are assembled on the same assembly line. As summarized in
Becker et al. [8], there are three types of MALBP problems, categorized according to the constraint
and objective:
1. MALBP-I: given the cycle time to minimize the number of workstations;
2. MALBP-II: given the number of workstations to minimize the cycle time;
3. MALBP-III: minimize both the cycle time and the number of workstations.
However, our target is to maximize the service level, i.e., the ratio between the number of
completed tasks and the number of arriving tasks, given a fixed number of workers. Our research
problem is different from the above-mentioned three problems by Becker et al. [8], except for
the MALBP-II which can be considered the most relevant to our problem. The major points that
differentiate our problem are:
• In our problem, each worker is only capable of performing a subset of operations.
• The processing time of each task is stochastic.
• The objective is to maximize the service level.
In Dou et al. [30], a machine deployment problem is considered, where the objective is to
minimize the cost of setting up all the machines, while satisfying the precedence and space constraints.
This involves also assignments of the machines to the tasks, and a GA-based optimization approach
was designed to identify a set of best solutions. The machines in Dou et al.’s [30] model can be
considered as workers in our model. However, in our problem the number of workers is fixed,
while the objective is to maximize the service level. In contrast, in Dou et al.’s [30] model the number
of machines in different stages (tasks) are independent.
Simulation-based optimization has been used for a number of decades for problem solving in
logistics. For example, Azadivar [31] showed that the discrete rack systems can be better optimized
through simulations rather than approximating with mathematical models. Later on, Ding et al. [32]
extended this idea to the supply chain context. They developed a simulation-based optimization
method for the selection of potential suppliers. To obtain an optimal design of the cold supply
chain, Saif and Elheldhli [33] developed an innovative simulation-based optimization approach to
minimize the total cost that includes the logistics costs and the global warming impact. More recently,
Ghasemi and Khalili-Damghani [34] developed a novel simulation-based optimization approach to
solve a multi-period inventory planning problem for the supply chain of a company in Iran.
3. Problem Description
Warehouses typically handle a variety of stock-keeping units (SKUs), which require a range of
activities to be executed. Different products may require different activities. Considering the space and
workforce constraints, the warehouse aims to maximize its productivity with via appropriate worker
assignment. As warehouse workers may have different skills, it is not only the number of the workers
that count, but also every specific worker–activity pairing becomes critical. Under the conditions of
high fluctuations in daily workload, it is important for the warehouse planner to obtain an optimal
worker assignment in a rather short period of time. To address this problem, a simulation-based
optimization method was developed. Specifically, the optimal worker assignment to warehouse
activities/tasks should be achieved while satisfying all operational and worker skill set constraints.Algorithms 2020, 13, 326 4 of 16
In our showcase, the following operational assumptions are considered:
• Product types: We chose to consider all product types, i.e., franchises, that the warehouse handles.
There are in total nine franchises being handled in the warehouse. Different franchises require
different processing times for different activities. More details are provided in Section 5.
• Inbound activities: Inbound activities start with the arrival of shipments at the warehouse.
Immediately after the dock-in, the products in pallets are unloaded at the inbound staging area
and later moved to the sorting workstation. After manual counting and checking for defects
and damage, the products are moved to the goods receipt (GR) workstation. At the GR station,
workers scan the barcode on each item and register the items in the warehouse management
system (WMS), while putaway slips with storage bins are generated for each pallet load. After the
GR, they are ready for putaway to the storage area(s). The putaway worker puts away the pallet
in its designated storage area following the storage bin information printed on the putaway slip.
Putaway activity is denoted as the terminal inbound activity. Figure 1 shows the entity flow
diagram for inbound shipments.
• Outbound activities: Outbound activities start when order information arrives into the WMS
and a pick slip is generated. One order is assigned to one picker. After the order picking is
completed, depending on the labeling requirements, the items need to be labeled before scanning
starts. Otherwise, the picked items are sent to the scanning station. There are two types of
scanning, each for a certain type of product, i.e., manual scanning and scanning via auto-scanning
tunnel (AST). The scanning activity makes sure that all the items are picked against the order lists,
and it generates slips that denote items which need to be packed together based on pallet or case
dimension constraints. Then the items are packed into pallets and cases accordingly. A release
worker moves the order to the outbound staging, from where the order is shipped out with an
outbound truck. Figure 2 describes the outbound entity flow diagram.
• Three types of storage areas: There are three storage areas in the warehouse, i.e., racking, long-span
shelving (LSS), and vertical lift modules (VLMs). Racking is designed to store SKUs in full pallets,
LSS contains SKUs in loose boxes, and VLMs are for loose boxes. Each storage type is dedicated
to one or more product types.
• Shift configuration and working days: There are two shifts operating during business days
(excluding weekends and holidays): the morning shift operates from 8:00 a.m. to 6:00 p.m. with a
one-hour break during 12:00–1:00 p.m., and the night shift operates from 9:00 p.m. to 7:00 a.m.
(next day) with a one-hour break during 1:00–2:00 a.m.
• Worker numbers and shift assignment: The total number of workers is fixed (31 workers in total).
Worker numbers assigned to each shift are pre-fixed; 21 workers are assigned to the morning shift
and 5 workers are assigned to the night shift. Additionally, 5 outsourced workers are assigned to
value-added service (VAS) activity for labeling upon request.
• Worker skill set matrix: We assume that each worker has his/her own unique skill set. If the
Figure 1. Inbound entity flow diagram.
worker is trained to conduct an activity, “yes” is put in the respective activity cell. Table 1 shows
the worker skill set matrix assumed in our model.
• Workload demand for one-week period is known upfront.
Shipment Goods Putaway (Racking
Q Sorting Q Q End
arrival Receipt & LSS)
Putaway
Q
(VLM)
Figure 1. Inbound entity flow diagram.Figure 2. Outbound entity flow diagram
Algorithms 2020, 13, 326 5 of 16
Order Manual
Q Picking Q Q
arrival Scanning
Labelling
Q Auto Scanning
(VAS) Q
Tunnel (AST)
Packing Q Release End
Figure 2. Outbound entity flow diagram.
Table 1. Worker skill set.
Worker id Shift Sorting GR Putaway VLM Picking AST Scanning Packing Release VAS
Worker 1 Shift 1 Yes Yes Yes Yes Yes
Worker 2 Shift 1 Yes Yes Yes Yes
Worker 3 Shift 1 Yes Yes Yes Yes Yes
Worker 4 Shift 1 Yes Yes Yes Yes Yes
Worker 5 Shift 1 Yes Yes Yes Yes Yes
Worker 6 Shift 1 Yes Yes Yes Yes Yes
Worker 7 Shift 1 Yes Yes Yes Yes Yes
Worker 8 Shift 1 Yes Yes Yes Yes Yes Yes
Worker 9 Shift 1 Yes Yes Yes Yes Yes
Worker 10 Shift 1 Yes Yes Yes Yes Yes Yes Yes Yes Yes
Worker 11 Shift 1 Yes Yes Yes
Worker 12 Shift 2 Yes Yes Yes Yes Yes Yes
Worker 13 Shift 2 Yes Yes Yes Yes Yes Yes Yes Yes
Worker 14 Shift 2 Yes Yes Yes Yes Yes Yes
Worker 15 Shift 2 Yes Yes Yes Yes Yes Yes Yes
Worker 16 Shift 2 Yes Yes Yes Yes Yes Yes Yes Yes
Worker 17 Shift 1 Yes Yes Yes Yes Yes Yes
Worker 18 Shift 1 Yes Yes Yes Yes
Worker 19 Shift 1 Yes Yes Yes Yes
Worker 20 Shift 1 Yes Yes Yes Yes Yes Yes Yes
Worker 21 Shift 1 Yes Yes Yes Yes Yes
Worker 22 Shift 1 Yes Yes Yes Yes Yes Yes
Worker 23 Shift 1 Yes Yes Yes Yes Yes Yes Yes Yes
Worker 24 Shift 1 Yes Yes Yes Yes Yes Yes Yes
Worker 25 Shift 1 Yes Yes Yes Yes Yes
Worker 26 Shift 1 Yes Yes Yes Yes Yes Yes Yes
Worker 27 Shift 1 Yes
Worker 28 Shift 1 Yes
Worker 29 Shift 1 Yes
Worker 30 Shift 1 Yes
Worker 31 Shift 1 Yes
To tackle the problem, the constraints on the workforce should be dealt with. These constraints
may be worker-specific, such as the skill set, or arise from the resource limits and operational rules in
the warehouse. For example, due to the warehouse equipment capacity, there is an upper bound on the
number of workers allowed to be assigned to some activities. Namely, there is a limited amount of the
material handling equipment (MHE) and a limited number of scanning computers at a workstation,
thereby determining the maximum number of workers allowed to work at each workstation or activity
at the same time. In our showcase in Section 7, it is assumed that GR allows up to two workers,
putaway three workers, VLM two workers, picking six workers, AST either two or zero workers,
and scanning up to three workers. However, we do not impose any constraints on sorting, packing,
and release activities regarding the maximum number of workers, as such activities do not require any
specific equipment. Moreover, following the warehouse operation requirements, we assume that the
night shift can perform only putaway, picking, scanning, and packing activities.Algorithms 2020, 13, 326 6 of 16
Worker skill set is an important constraint in the assignment problem, which is also considered
here. As shown in Table 1, each worker owns a distinct set of skills that allows the worker to perform
the corresponding warehouse activities. If the worker is not trained to perform an activity, that worker
cannot be considered as a candidate for assignment to this activity.
Nonetheless, we do not impose any constraints on warehouse storage capacity, working areas,
and buffer zones between activities.
In the following sections, we will show how the simulation-based optimization method can
be used to solve this problem. As the situation in reality may vary day by day, and also from one
warehouse to another, our tool will provide the solution for the specific settings of the warehouse,
including flexibility of both products and workers.
First of all, inbound and outbound workload information should be defined. For example,
the inbound shipment arrival and/or outbound order start time-stamp, product name, workload
in terms of number of pallets, and target completion time-stamp information, are all handled by
the warehouse planners. This information is dependent on the forecast or expectation. Hence,
this information may vary. Moreover, we allow the model to capture the pending workload from
the previous day in pallet quantity, and by each type of inbound and outbound activity. Besides,
the more detailed information, such as the product type and processing time for each activity, can also
be customized by the user. Here we specify product name, designated storage area, whether the
product requires AST for scanning or not, and per-pallet processing time (mean, standard deviation)
by all inbound and outbound activities needed by each product type.
The tool also allows variability in the worker parameters. The number of workers assigned to
a shift and the shift duration can vary. As an example, we consider two shifts in the showcase of
Section 7, i.e., morning and night, operating from 8 am to 6 pm and from 9 pm to 7 am (next day),
respectively, with a one-hour break in each shift. Besides, the information on national holidays can
also be captured by our tool to specify the non-working days.
The worker skill set matrix is another important parameter. As defined in Table 1, each worker
has a skill set (“Yes” if the worker owns the skill for the activity) with respect to each type of activity
conducted in the warehouse.
To measure the performances of different worker assignment options in the warehouse, the hourly
and daily KPIs are generated. The hourly KPIs include worker utilization by each activity in each
hour, inbound and outbound throughput in terms of the number of completed pallets by each hour,
and overall inbound and outbound team utilization rate by each hour. Overall daily KPIs include
inbound and outbound team overall daily utilization, total work-in-progress (WIP) pallet quantity in
inbound and outbound activities, total quantity of completed pallets by inbound and outbound teams,
inbound and outbound service levels, and per-worker average productivity rate in terms of number of
completed pallets.
To express the KPIs formally, we define the following notation:
• wocc : number of occupied workers;
• wava : total number of available workers;
• pcom : number of completed pallets;
• p arr : number of arrived pallets;
• pincom : number of completed inbound pallets;
• poutcom : number of completed outbound pallets;
• win : number of inbound workers;
• wout : number of outbound workers.
We define avg(·) as the average function over the simulation days. The KPIs can be calculated
with the following formula:
wocc
Utilization rate by activities and overall utilization rate = avg( ) (1)
wavaAlgorithms 2020, 13, 326 7 of 16
pcom
Daily service level = (2)
p arr
pincom
Daily per-worker productivity for Inbound = (3)
win
poutcom
Daily per-worker productivity for Outbound = (4)
wout
In our simulation-based optimization model we consider service level as the target KPI,
as communicated by the warehouse team. The warehouse operations team measures their service level
performance as the ratio of total number of completed pallets (output) to total number of arrived pallets
(input) on a given day, which is oftentimes denoted as throughput productivity in the warehouse
literature. Additionally, it is considered to be one of the frequently used direct warehouse performance
indicators [35,36].
For the purpose of parsimony, we further concentrate on the service level performance as per our
target optimization objective of the simulation-based optimization tool.
4. Methodology
Ladier et al. [6] considered the staff scheduling in the warehouse on both weekly and daily
granularity levels. They built three mixed integer programming (MIP) models and solved the models
to obtain the optimal staff assignment and shift pattern. Their objective was to minimize the cost,
while assuming that all the tasks should be completed by hiring sufficient number of staff. However,
in the daily operations of the warehouse, the number of available workers may not be enough to
complete all the tasks. In this situation, the objective is to finish as many tasks, with an optimal
worker assignment.
The selected warehouse in this study serves as a distribution center with variations in product
types and demands. There are different teams working on different activities. The warehouse operates
as one single processing unit, which consists of sequence of activities. The major concern of the
warehouse is to assign the optimal number of workers to each team. Moreover, under uncertainty in
demand and processing time, this may require reallocation of worker(s) to other teams. This adds
an additional layer of complexity to the problem and requires a methodology that can solve the
problem. Given these requirements, following Amorim et al. [37], we devised a simulation–based
optimization model that explores both simulation and optimization methods to improve the service
level performance, by suggesting appropriate manpower assignment to different activities. First of all,
the discrete-event simulation model was developed, considering the relationship between different
activities. Then, the processing time of each activity was defined along with an initial assignment of
manpower. Due to uncertainty in daily workload, the initial solution is not always optimal. Therefore,
additional effort is required to optimally assign the manpower. As the assignment of workers to
different activities is a complex task, a heuristic algorithm instead of exact algorithm was developed to
find the optimal worker assignment. With each iteration, the new assignment of workers is input to
the simulation model until the model output achieves the highest service level performance.
5. O2DES Framework and Warehouse Simulation
For the worker assignment problem in the warehouse, it is difficult to obtain a direct calculation
for the worker assignment problem. In this case the simulation comes into play. With the simulation
modeling of the warehouse, we can replicate the real system in a computer environment. The systems
performance can be evaluated in a simulation, and additional features of system can be tested before
its deployment. The simulation outcome allows the decision maker to fine tune a set of parameters to
improve the operational performance. However, configuring these parameters for a complex system,
such as warehouses, can be challenging. Therefore, the simulation-based optimization approach,
which integrates the best of optimization with discrete-event simulation (DES) techniques, can be used
to handle this complexity.Algorithms 2020, 13, 326 8 of 16
The object-oriented discrete-event simulation (O2DES) was adopted from Li et al. [12] and
implemented as a core simulation engine in our simulation-based optimization tool to achieve the
main objective of our research, i.e., the development of a decision support tool that can optimally
assign workers to the warehouse activities.
5.1. O2DES
The main features of O2DES are as follows:
1. Events are described in modules and they interact with each other.
2. Simplified syntax for:
(a) Event execution;
(b) Event scheduling;
(c) Input/output event interfacing.
3. Automated warm-up induction.
5.2. Simulation Modeling
Any process system consists of a sequence of steps, i.e., activities. Entities move through the
activities. Similarly, in the simulation modeling, the real life situation can be represented using an
entity flow diagram (EFD), a logical flow diagram of entities between the activities. The resources
required for the different activities are mapped in the EFD.
As described in Section 3, the warehouse operations consist of two main types, i.e., inbound and
outbound, while the pallet is the entity that flows through inbound and outbound activities. To build
Figure 3. Entity flow diagram (EFD)
the simulation model, an EFD based on the warehouse operational processes needs to be developed,
as shown in Figure 3.
Entity Entity
Que Que
Start Activity 1 Activity 2
ue 1 ue 2
Entity
Entity
Que
Activity 3 Activity 4 End
ue 3
Figure 3. Entity flow diagram (EFD).
With certain assumptions, the simulation model was built using these EFDs in C# code and simple
heuristics integrated with simulation were used to assign the manpower.
Input information on inbound and outbound workload has been provided by the warehouse for
simulation. On top of incoming inbound shipment load and customer order volume, leftover workload
information was also considered.
Due to possible uncertainties in warehouse operations, we assumed the processing time of each
activity follows a gamma distribution. The characteristics and advantages of gamma distribution
can be found in several previous studies [38–41]. For example, in a study by Song [39], the Poisson
distribution was considered to be inappropriate to describe the lead time, as the uncertainty may arise
due to several reasons, which makes a more centralized distribution like the gamma distribution a
preferred method.Algorithms 2020, 13, 326 9 of 16
The values of mean µ and standard deviation σ for each activity are calculated based on the
time-motion study conducted in the warehouse. Gamma distribution can be characterized by α and λ,
where the density probability function:
λα x α−1 e−λx
f ( x; α, λ) = , (5)
Γ(α)
with Γ(α) = (α − 1)! As the mean µ = α
λ and squared deviation σ2 = α
λ2
, we can derive α and λ
as following:
µ
λ= , α = µλ. (6)
σ2
Table 2 shows the processing time data used in the simulation model.
Table 2. Processing times of different franchises and processes. GR represents goods receipt; VAS value
added service.
Sorting GR Putaway Picking Scanning Packing Release VAS
Franchise Name Storage Type AST
µ σ µ σ µ σ µ σ µ σ µ σ µ σ µ σ
Product 1 LSS Y 48.9 23.4 13.3 1 77.4 1.8 77.6 1.5 30.1 2.6 67.6 6.3 1 0.2 289 13
Product 2 Racking N 23.4 2.2 6.5 1 6.4 1.5 4.7 1.5 27.3 2.7 67.6 6.3 1 0.2 482 22.5
Product 3 Racking N 19.9 3.3 3.3 1.2 6.4 1.5 4.7 1.5 13.3 2.7 67.6 6.3 1 0.2 482 22.5
Product 4 VLM N 72 11.6 26.3 0.2 54.6 0.7 75.1 1.3 20.4 2.8 67.6 6.3 1 0.2 482 22.5
Product 5 LSS N 40.4 2.6 16.1 1.1 77.4 1.8 77.6 1.5 15.5 7.5 67.6 6.3 1 0.2 482 22.5
Product 6 LSS N 40.4 2.6 16.1 1.1 77.4 1.8 77.6 1.5 15.5 7.5 67.6 6.3 1 0.2 482 22.5
Product 7 LSS N 40.4 2.6 16.1 1.1 77.4 1.8 77.6 1.5 15.5 7.5 67.6 6.3 1 0.2 482 22.5
Product 8 LSS N 40.4 2.6 16.1 1.1 77.4 1.8 77.6 1.5 15.5 7.5 67.6 6.3 1 0.2 482 22.5
Product 9 LSS N 40.4 2.6 16.1 1.1 77.4 1.8 77.6 1.5 15.5 7.5 67.6 6.3 1 0.2 482 22.5
All simulation experiments were performed on an Intel R CoreTM i7-8550U CPU 1.80 GHz
1.99 GHz with 16 GB RAM and a 64-bit operating system. First of all, it was necessary to determine the
simulation settings: initial conditions, warm-up length, and number of replications [10]. Preliminary
tests were performed to evaluate the simulation duration and the number of replications necessary to
achieve the steady-state results. Upon the initiation, the simulation tool reads input data and adjusts
for the real simulation start time by running a single replication. As a warm-up, this process does not
generate any statistics. Using real forecast data of the workload with arrival times, the simulation
results indicate that one replication is sufficient to achieve steady output.
Once the model was validated, simulation iterations were run for each possible scenario,
in combination with the optimization algorithm. This will be explained in the next section.
6. Simulation-Based Optimization
The objective is to maximize service level for both inbound and outbound operations,
p
where service level= pcom
arr
.
Considering the constraints, the model is defined as follows:
max f nn + λ f out (7)
s.t. xij ≤ aij (8)
∑i xij ≤ m j , ∀ j. (9)
where f in and f out represent inbound and outbound service levels, respectively; λ is a weight factor to
control the trade-off between inbound and outbound. X is an assignment matrix, where xij = 1 means
that the worker i is assigned to the activity i, otherwise xij = 0. aij = 1 indicates that worker i has the
skill j. In practice, the outbound service level performance is considered to be of a high priority as it is
directly related to the customer satisfaction. Hence, a higher weight λ is set for the outbound service
level f out .Algorithms 2020, 13, 326 10 of 16
The constraint part of the model is an assignment problem, where multiple workers can be
assigned to the same task. As the objective is not an explicit function of the assignment scheme,
but some metric given by the simulation output, it is not easy to solve the problem by an exact algorithm.
In the context of a similar problem, i.e., the assembly line worker assignment, the neighborhood search
method was shown to be effective in Polat et al. [42] and to outperform other heuristic methods.
Motivated by this, we adopted a neighborhood search method in our model.
For a binary vector of matrix, the Hamming distance is the number of bit positions in which the
two corresponding bits are different. For two assignment matrices X1 and X2 ; D ( X1 , X2 ) is denoted as
the Hamming distance between them. For each worker wi , if the worker is assigned to different tasks
in X1 and X2 , the difference will be two in row i. Thus X1 is called a c-neighbor of X2 if D ( X1 , X2 ) = 2c.
In our problem, due to predetermined upper bounds for the number of workers in each activity,
a c-neighbor may not be feasible.
We propose a random neighborhood search algorithm to solve the problem, which is described in
Algorithm 1. Accordingly, every time a 1-neighborhood X 0 of the current solution is built randomly.
If the new solution is feasible, the simulation will run with this assignment and generate the output
statistics. The metric used for our objective is the service level. If the service level of the new solution
is better than the incumbent solution, we will update the incumbent as this new solution. Usually,
a random 1-neighborhood is not feasible, in the sense that the number of workers assigned to a
task may be larger than M j . In this case, a 1-neighborhood of X 0 will be built and checked again.
This procedure will be repeated until a feasible solution is found, or the number of solutions we have
generated is larger than a determined threshold.
Note that our method is different from the 1-step neighborhood search. Before a new feasible
solution is found, several workers may have been reassigned to other task(s). This can help to avoid
the local optimum. As the random search is in a broader neighborhood, the probability of reaching a
global optimum is higher. From the practical perspective, the number of new solutions and the number
of simulation runs are both bounded, to make the total time reasonable for the industry application.
Algorithm 1: The random neighborhood search algorithm.
Data: the workload
Result: an optimal assignment
initialization: find a feasible assignment X0 , set Y0 = X0 , sopt = s = 0, loop = iteration = 0 ;
while loopAlgorithms 2020, 13, 326 11 of 16
7. Numerical Results
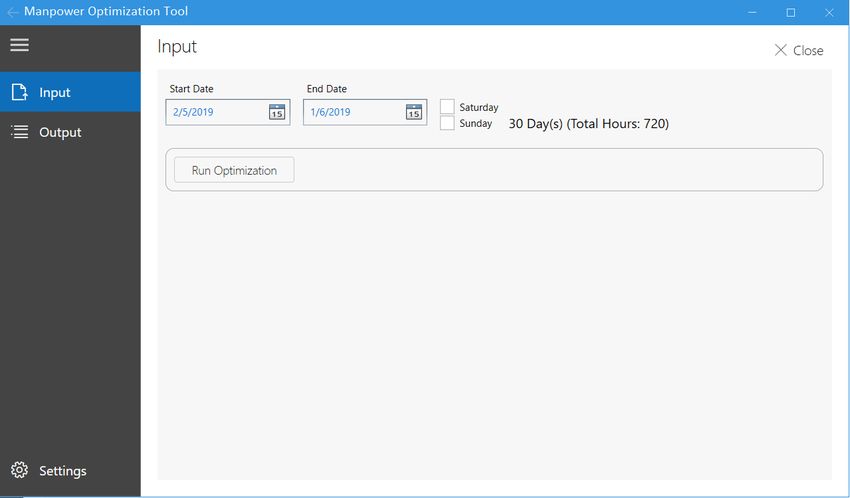
Using the simulation-based optimization method, the software tool was developed. The graphical
user interface (GUI) design of the software is shown in Figure 4. The warehouse planner can select
the workload data as an input and run the tool. The output includes the service level, along with
other metrics.
Figure 4. The GUI of the manpower allocation tool.
In a set of experiments, we tested different values of λ for inbound and outbound service levels,
with the input data sampled from different months of years 2018 and 2019. The simulation-based
optimization was run with different values of the coefficient λ.
We used the historical data provided by the warehouse. Specifically, inbound shipment arrival and
outbound shipment order information for the following months were chosen: July 2018, January 2019
and March 2019. For each month, we conducted the assignment optimization week by week,
and calculated the summation over all weeks of the month. The value of coefficient λ ranges from 1.0
to 2.0, with a step of 0.1. Data analyses of historical workload demand suggest that the outbound order
volume generally prevails the inbound one. To diversify our sample pools, the sampling was done in
the following way:
1. In July 2018, the outbound pallet number was nearly 5% less than inbound pallet number;
2. In January 2019, the outbound pallet number was nearly 13% larger than the inbound one;
3. In May 2019, the outbound pallet number was nearly 29% larger than the inbound one.
For the warehouse, outbound service level is considered to be more critical than the inbound
service level. As shown in Figures 5–7, the results suggest that the optimized worker assignment
can always achieve a better performance for the outbound service level, compared to the current
assignment shown in Table 3. Regarding the inbound service level, the performance may be better
when the value of λ is relatively small, that is, when the priority of outbound service level performance
is not considered to be so high. Generally, with a decrease of less than 10% for the inbound service
level, an increase of more than 30% can be obtained in the outbound service level performance.
This indicates that our assignment can achieve a higher utilization of workers and a higher level of
customer satisfaction.
As seen from the reported results, when the value of λ increases, the outbound service level
increases, while the inbound service level decreases. This indicates that the parameter λ can be used to
control the trade-off between inbound and outbound service level performance metrics.Algorithms 2020, 13, 326 12 of 16
1200
Optimized Inbound
1150
Optimized Outbound
1100 As-Is Inbound
As-Is Outbound
Number of completed pallets
1050
1000
950
900
850
800
750
700
650
600
1 1.1 1.2 1.3 1.4 1.5 1.6 1.7 1.8 1.9 2
λ
Figure 5. Numerical results for January 2019 data, given the total numbers of inbound/outbound pallets
of 1508/1702, and the numbers of completed pallets with the current worker allocation are 906/606.
1450
1400 Optimized Inbound
1350 Optimized Outbound
1300 As-Is Inbound
As-Is Outbound
1250
Number of completed pallets
1200
1150
1100
1050
1000
950
900
850
800
750
700
650
600
1 1.1 1.2 1.3 1.4 1.5 1.6 1.7 1.8 1.9 2
λ
Figure 6. Numerical results for May 2019 data, given the numbers total inbound/outbound pallets of
1541/1981, and the numbers of completed pallets with the current worker allocation are 1085/613.Algorithms 2020, 13, 326 13 of 16
Optimized Inbound
Optimized Outbound
1300 As-Is Inbound
As-Is Outbound
1250
Number of completed pallets
1200
1150
1100
1050
1000
950
900
850
800
750
700
650
600
1 1.1 1.2 1.3 1.4 1.5 1.6 1.7 1.8 1.9 2
λ
Figure 7. Numerical results for July 2018 data, given the total numbers of inbound/outbound pallets
of 1656/1529, and the numbers of completed pallets with the current worker allocation are 1231/621.
Table 3. The current assignment used in the warehouse.
Sorting GR Putaway VLM Picking AST Scanning Packing Releasing
6 2 2 1 2 2 2 3 1
To demonstrate the improvements via the simulation-based optimization method, we generated
additional service level outputs for a benchmark worker allocation case under the same workload
scenarios. This benchmark worker allocation refers to the worker allocation matrix previously used
by the warehouse manager prior to the implementation of our simulation-based optimization tool.
In generating the service level statistics for the benchmark worker allocation, we preset the worker
allocation and conducted simulations without any optimization. The comparisons of performance
outputs from the optimized and non-optimized (benchmark) manpower allocations are shown in
Figures 5–7, indicating that with less than 10% decrease for the inbound service level, on average,
the outbound service level can be increased by 30% across all three scenarios considered.
8. Conclusions
As a real-life complex system, the warehouse is characterized by high variability in workload
arrival. Thus, the optimal worker assignment in such a dynamic system is a non-trivial task. Since the
workload may vary on a daily basis, it is important for the warehouse planner to have a decision
support tool that can optimally assign workers to different activities. As the exact method is impossible
for this problem, we proposed the simulation-based optimization method, which combines the O2DES
framework with a random neighborhood search method. Under dynamic daily workload conditions,
the random neighborhood search model was shown to efficiently identify an improved manpower
assignment strategy based on the simulation output. A decision support tool based on the proposed
method was then verified and validated using the real data from a warehouse located in Singapore.
The results show that with a slight decrease of the inbound service level, we can improve the outbound
service level by more than 30%.Algorithms 2020, 13, 326 14 of 16
This study provides a practical contribution to the problem of workforce planning in a warehouse.
Warehouse planners and managers can benefit from the use of such a manpower allocation tool.
The managers or users of the tool will need to provide the upcoming workload forecast as the input,
while the tool automatically generates the optimal manpower allocation to activities.
On the theoretical side, although the literature has advocated the need for implementation of
strategies for manpower planning [20,26], the reported solutions have not been numerous. One of the
few examples is from Ladier et al. [6], who proposed a two-step mixed integer linear programming
model which optimizes worker allocation to activities and different shifts daily. Said optimization
model does not capture the arrival time of the daily workload, and assumes that the human resources
are always sufficient. Hence, such a model is not capable pf effectively accounting for the industry
circumstances. In contrast, our simulation-based optimization model accounts for the workload arrival
and queuing, and allows one to achieve a higher service level with the available manpower.
Future studies may further improve the flexibility of the proposed method by integrating a better
selection of initial solution to accelerate the neighborhood search. This method can also be applied to
other resource allocation problems in supply chains and logistics.
Author Contributions: Conceptualization, H.L. and O.G.; methodology, K.K. and W.Z.; software, H.L. and K.K.;
validation, O.G.; resources, H.L.; data curation, O.G.; writing–original draft preparation, O.G., K.K., and W.Z.;
writing–review and editing, O.G. and K.K.; visualization, W.Z. and O.G. All authors have read and agreed to the
published version of the manuscript.
Funding: This research has been made possible by the funding support from the Centre for Next Generation of
Logistics (C4NGL), Department of Industrial Systems Engineering and Management, Faculty of Engineering,
National University of Singapore. The work has been also supported by Singapore A*STAR IAF-PP fund
(Grant No. A1895a0033) under the project “Digital Twin for Next Generation Warehouse”. The authors appreciate
our researchers for their great contributions to the centre and projects.
Conflicts of Interest: The authors declare no conflict of interest. The funders had no role in the design of the
study; in the collection, analyses, or interpretation of data; in the writing of the manuscript, or in the decision to
publish the results.
References
1. Schmenner, R.W. Looking ahead by looking back: Swift, even flow in the history of manufacturing.
Prod. Oper. Manag. 2001, 10, 87–96. [CrossRef]
2. Fredendall, L.D.; Craig, J.B.; Fowler, P.J.; Damali, U. Barriers to swift, even flow in the internal supply chain
of perioperative surgical services department: A case study. Decis. Sci. 2009, 40, 327–349. [CrossRef]
3. Devaraj, S.; Ow, T.T.; Kohli, R. Examining the impact of information technology and patient flow on
healthcare performance: A Theory of Swift and Even Flow (TSEF) perspective. J. Oper. Manag. 2013, 31,
181–192. [CrossRef]
4. Garn, W.; Aitken, J.; Schmenner, R. Smoothly Pass the Parcel: Implementing the Theory of Swift, Even Flow.
ResearchGate 2020. [CrossRef]
5. Schmenner, R.W. Service businesses and productivity. Decis. Sci. 2004, 35, 333–347. [CrossRef]
6. Ladier, A.L.; Alpan, G.; Penz, B. Barriers to swift, Joint employee weekly timetabling and daily rostering: A
decision-support tool for a logistics platform. Eur. J. Oper. Res. 2014, 234, 278–291. [CrossRef]
7. Nauss, R.M. Solving the generalized assignment problem: An optimizing and heuristic approach. INFORMS
J. Comput. 2003, 15, 249–266. [CrossRef]
8. Becker, C.; Scholl, A. A survey on problems and methods in generalized assembly line balancing. Eur. J.
Oper. Res. 2006, 168, 694–715. [CrossRef]
9. Burinskiene, A.; Lorenc, A.; Lerher, T. A simulation study for the sustainability and reduction of waste in
warehouse logistics. Int. J. Simul. Model. 2018, 17, 485–497. [CrossRef]
10. Kelton, W.D.; Sadowski, R.P.; Sadowski, D.P. Simulation with Arena; McGraw-Hill: New York NY, USA, 1998.
11. Muller, D. AutomodTM -providing simulation solutions for over 25 years. In Proceedings of the 2011 Winter
Simulation Conference (WSC), Phoenix, AZ, USA, 11–14 December 2011; pp. 39–51.Algorithms 2020, 13, 326 15 of 16
12. Li, H.; Zhu, Y.; Chen, Y.; Pedrielli, G.; Pujowidianto, N.A. The object-oriented discrete event simulation
modeling: A case study on aircraft spare part management. In Proceedings of the 2015 Winter Simulation
Conference (WSC), Huntington Beach, CA, USA, 6–9 December 2015; pp. 3514–3525.
13. Frazelle, E. The title of the cited contribution. In Supply Chain Strategy: The Logistics of Supply Chain
Management; McGraw-Hill: New York, NY, USA, 2002.
14. Abushaikha, I.; Salhieh, L.; Towers, N. Improving distribution and business performance through lean
warehousing. Int. J. Retail. Distrib. Manag. 2018, 46, 780–800. [CrossRef]
15. Guthrie, B.; Parikh, P.J.; Kong, N. Evaluating warehouse strategies for two-product class distribution
planning. Int. J. Prod. Res. 2017, 55, 6470–6484. [CrossRef]
16. Ahmed, D.; Hyder, M. Improving Distribution and Business Performance through Lean Warehousing.
Int. J. Bus. Stud. 2020, 1, 35–37.
17. De Koster, R.; Le-Duc, T.; Roodbergen, K.J. Design and control of warehouse order picking: A literature
review. Eur. J. Oper. Res. 2007, 182, 481–501. [CrossRef]
18. Van Den Berg, J.P. Integral Warehouse Management; Management Outlook Publications: Utrecht,
The Netherlands, 2007.
19. Heragu, S.S.; Du, L.; Mantel, R.J.; Schuur, P.C. Mathematical model for warehouse design and product
allocation. Int. J. Prod. Res. 2005, 43, 327–338. [CrossRef]
20. De Leeuw, S.; Wiers, V.C.S. Warehouse manpower planning strategies in times of financial crisis: Evidence
from logistics service providers and retailers in The Netherlands. Prod. Plan. Control 2015, 26, 328–337.
[CrossRef]
21. Ivanov, D. Predicting the impacts of epidemic outbreaks on global supply chains: A simulation-based
analysis on the coronavirus outbreak (COVID-19/SARS-CoV-2) case. Transp. Res. Part E Logist. Transp. Rev.
2020, 136, 101922. [CrossRef]
22. Nikolopoulos, K.; Punia, S.; Schäfers, A.; Tsinopoulos, C.; Vasilakis, C. Forecasting and planning during
a pandemic: COVID-19 growth rates, supply chain disruptions, and governmental decisions. Eur. J.
Oper. Res. 2020. [CrossRef]
23. Klaus, P. The assessment of competitive intensity in logistics markets. Logist. Res. 2011, 3, 49–65. [CrossRef]
24. Rebitzer, D.W. The European logistics market. In Europe Real Estate Yearbook; Real Estate Publishers BV: VC
Den Haag, The Netherlands, 2007. Available online: www.europe-re.com (accessed on 18 November 2020).
25. Graham Douglas, D. Warehouse of the future. Frontline Solut. 2003, 4, 20–26.
26. Pooya, A.; Pakdaman, M. A new continuous time optimal control model for manpower planning with
promotion from inside the system. Oper. Res. 2018, 1–16. [CrossRef]
27. Edwards, J.S. A survey of manpower planning models and their application. J. Oper. Res. Soc. 1983, 34,
1031–1040. [CrossRef] [PubMed]
28. Parker, S.C.; Malstrom, E.J.; Usmani, T. Computer-assisted warehouse personnel scheduling. Intell. Robot.
Comput. Vis. Algorithms Tech. Int. Soc. Opt. Photonics 1992, 1607, 636–645.
29. Sanders, N.R.; Ritzman, L.P. Using warehouse workforce flexibility to offset forecast errors. J. Bus. Logist.
2004, 25, 251–269. [CrossRef]
30. Dou, J.; Dai, X.; Meng, Z. A GA-based approach for optimizing single-part flow-line configurations of RMS.
J. Intell. Manuf. 2011, 22, 301–317. [CrossRef]
31. Azadivar, F. A simulation optimization approach to optimum storage and retrieval policies in an automated
warehousing system. In Proceedings of the 1984 Winter Simulation Conference (WSC), Dallas, TX, USA,
28–30 November 1984; pp. 207–214.
32. Ding, H.; Benyoucef, L.; Xie, X. A simulation-optimization approach using genetic search for supplier
selection. In Proceedings of the 2003 Winter Simulation Conference (WSC), New Orleans, LA, USA,
7–10 December 2003; pp. 1260–1267.
33. Saif, A.; Elhedhli, S. Cold supply chain design with environmental considerations: A simulation-optimization
approach. Eur. J. Oper. Res. 2016, 252, 274–287. [CrossRef]
34. Ghasemi, P.; Khalili-Damghani, K. A robust simulation-optimization approach for pre-disaster multi-period
location–allocation–inventory planning. Math. Comput. Simul. 2021, 179, 69–95. [CrossRef]
35. De Marco, A.; Mangano, G. Relationship between logistic service and maintenance costs of warehouses.
Facilities 2011, 29, 411–421. [CrossRef]Algorithms 2020, 13, 326 16 of 16
36. Staudt, F.H.; Alpan, G.; Di Mascolo, M.; Rodriguez, C.M.T. Warehouse performance measurement:
A literature review. Int. J. Prod. Res. 2015, 53, 5524–5544. [CrossRef]
37. Amorim-Lopes, M.; Guimarães, L.; Alves, J.; Almada-Lobo, B. Improving picking performance at a large
retailer warehouse by combining probabilistic simulation, optimization, and discrete-event simulation.
Int. Trans. Oper. Res. 2020, 28, 687–715. [CrossRef]
38. Zhang, C.W.; Xie, M.; Liu, J.Y.; Goh, T.N. A control chart for the Gamma distribution as a model of time
between events. Int. J. Prod. Res. 2007, 45, 5649–5666. [CrossRef]
39. Song, D.P. Optimal integrated ordering and production policy in a supply chain with stochastic lead-time,
processing-time, and demand. IEEE Trans. Automat. Contr. 2009, 54, 2027–2041. [CrossRef]
40. Guasch, A.; Piera, M.A.; Figueras, J. Automatic warehouse modelling and simulation. Int. J. Simul.
Process. Model. 2011, 6, 288–296. [CrossRef]
41. Andriansyah, R.; Etman, P.; Rooda, J. Simulation model of a single-server order picking workstation using
aggregate process times. In Proceedings of the First International Conference on Advances in System
Simulation, Porto, Portugal, 20–25 September 2009; pp. 23–31.
42. Polat, O.; Kalayci, C.B.; Mutlu, Ö.; Gupta, S.M. A two-phase variable neighbourhood search algorithm for
assembly line worker assignment and balancing problem type-II: An industrial case study. Int. J. Prod. Res.
2016, 54, 722–741. [CrossRef]
Publisher’s Note: MDPI stays neutral with regard to jurisdictional claims in published maps and institutional
affiliations.
c 2020 by the authors. Licensee MDPI, Basel, Switzerland. This article is an open access
article distributed under the terms and conditions of the Creative Commons Attribution
(CC BY) license (http://creativecommons.org/licenses/by/4.0/).You can also read