Alterations in reward network functional connectivity are associated with increased food addiction in obese individuals - Nature
←
→
Page content transcription
If your browser does not render page correctly, please read the page content below
www.nature.com/scientificreports
OPEN Alterations in reward network
functional connectivity are
associated with increased food
addiction in obese individuals
Soumya Ravichandran1, Ravi R. Bhatt1,6, Bilal Pandit1, Vadim Osadchiy1,2, Anita Alaverdyan1,
Priten Vora1, Jean Stains1,2,3, Bruce Naliboff1,2,3,4, Emeran A. Mayer1,2,3,4,5 &
Arpana Gupta1,2,3,4*
Functional neuroimaging studies in obesity have identified alterations in the connectivity within the
reward network leading to decreased homeostatic control of ingestive behavior. However, the neural
mechanisms underlying sex differences in the prevalence of food addiction in obesity is unknown.
The aim of the study was to identify functional connectivity alterations associated with: (1) Food
addiction, (2) Sex- differences in food addiction, (3) Ingestive behaviors. 150 participants (females:
N = 103, males: N = 47; food addiction: N = 40, no food addiction: N = 110) with high BMI ≥ 25 kg/m2
underwent functional resting state MRIs. Participants were administered the Yale Food Addiction
Scale (YFAS), to determine diagnostic criteria for food addiction (YFAS Symptom Count ≥ 3 with
clinically significant impairment or distress), and completed ingestive behavior questionnaires.
Connectivity differences were analyzed using a general linear model in the CONN Toolbox and images
were segmented using the Schaefer 400, Harvard–Oxford Subcortical, and Ascending Arousal Network
atlases. Significant connectivities and clinical variables were correlated. Statistical significance
was corrected for multiple comparisons at q < .05. (1) Individuals with food addiction had greater
connectivity between brainstem regions and the orbital frontal gyrus compared to individuals with
no food addiction. (2) Females with food addiction had greater connectivity in the salience and
emotional regulation networks and lowered connectivity between the default mode network and
central executive network compared to males with food addiction. (3) Increased connectivity between
regions of the reward network was positively associated with scores on the General Food Cravings
Questionnaire-Trait, indicative of greater food cravings in individuals with food addiction. Individuals
with food addiction showed greater connectivity between regions of the reward network suggesting
dysregulation of the dopaminergic pathway. Additionally, greater connectivity in the locus coeruleus
could indicate that the maladaptive food behaviors displayed by individuals with food addiction serve
as a coping mechanism in response to pathological anxiety and stress. Sex differences in functional
connectivity suggest that females with food addiction engage more in emotional overeating and
less cognitive control and homeostatic processing compared to males. These mechanistic pathways
may have clinical implications for understanding the sex-dependent variability in response to diet
interventions.
As the obesity epidemic progresses, with 42% of the adult U.S. population being obese, rising healthcare costs
of over 700 billion dollars annually have been observed1–3. Studies have shown associations between obesity
and abnormal ingestive behaviors, primarily “food addiction”, in 40% of individuals seeking bariatric s urgery4,5.
Food addiction describes an addictive response in some individuals, where unintended overeating, the increased
1
G. Oppenheimer Family Center for Neurobiology of Stress and Resilience, Ingestive Behavior and Obesity
Program, CHS 42‑210 MC737818, 10833 Le Conte Avenue, Los Angeles, USA. 2David Geffen School of Medicine At
UCLA, Los Angeles, USA. 3Vatche and Tamar Manoukian Division of Digestive Diseases, Los Angeles, USA. 4UCLA
Microbiome Center, Los Angeles, USA. 5Ahmanson‑Lovelace Brain Mapping Center, University of California
Los Angeles (UCLA), Los Angeles, USA. 6Imaging Genetics Center, Mark and Mary Stevens Neuroimaging and
Informatics Institute, University of Southern California, Los Angeles, USA. *email: AGupta@mednet.ucla.edu
Scientific Reports | (2021) 11:3386 | https://doi.org/10.1038/s41598-021-83116-0 1
Vol.:(0123456789)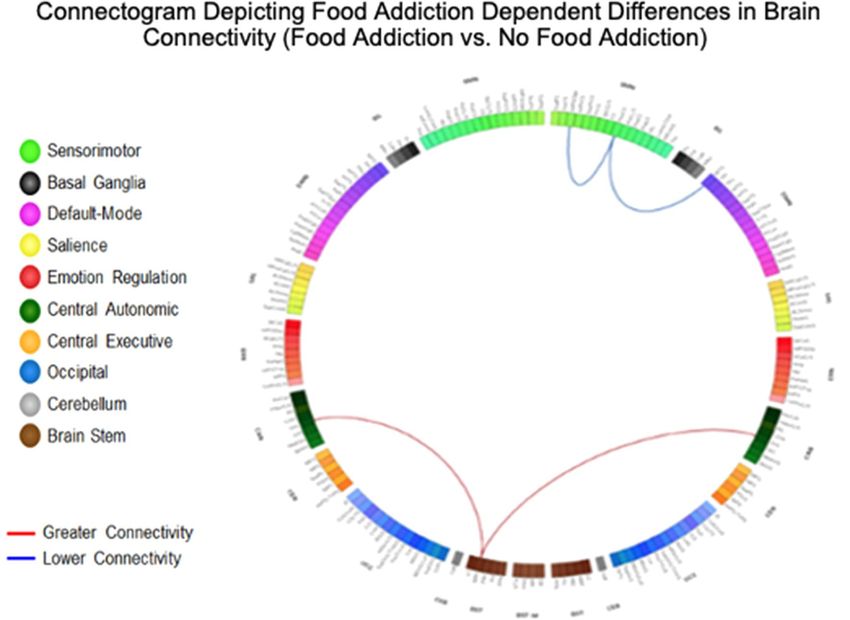
www.nature.com/scientificreports/
intake of ultra-processed/hyperpalatable foods beyond homeostatic needs or eating primarily for pleasure occur
despite negative consequences6–8. The Yale Food Addiction Scale (YFAS) is a validated and psychometrically sound
measure that uses the DSM-IV diagnostic criteria for substance abuse to operationalize food addiction9,10. While
it is believed that food addiction is distinct from other behavioral eating disorders, it does share the characteris-
tics or withdrawal, tolerance, impulsivity, and emotional reactivity seen with substance-use disorders and other
addictive behaviors6,7,11.
Research depicting sex differences in obesity and food addiction have gained momentum to increase treat-
ment efficacy12. Although prevalence rates in obesity are similar between the sexes, females report nearly double
the rates of food addiction compared to males (12.2–6.4% respectively), with obese females being more likely to
encounter loss of control while e ating12,13. This stems from the increased frequency and cravings towards food
as well as the increased reactivity to food cues experienced by females with obesity compared to m ales12,14,15.
Past literature has used magnetic resonance imaging (MRI) as a tool to understand the underlying neurobiol-
ogy of both obesity and food a ddiction16–18. Individuals with obesity show greater activation in the reward and
salience networks, particularly in the basal ganglia, in response to visual stimuli compared to normal weight
individuals19,20. This has been associated with an increased drive for cravings and greater food consumption,
which could explain the prevalence of overeating in obese individuals21,22. Studies have also indicated brain con-
nectivity differences related to food addiction between regions of the reward network due to its role in controlling
voluntary behavior23–25. Altered connectivity in the basal ganglia occurs as a result of the decreased expression
of dopamine (D2) receptors which mediate reward-seeking behavior4,26,27. The reduction in the availability of
D2 receptors creates a perpetual hypodopaminergic state in affected individuals leading to decreasing reward
sensitivity, as greater amounts of dopamine must be released to receive the same stimulatory effect25. Similar
to other addictive behaviors, individuals with food addiction exhibit increased alterations in the regions of the
reward network in response to food cues28–31. Decreased sensitivity of the reward system translates into decreased
inhibitory control and cognitive modulation in food a ddiction4,26,27. Dysregulation of the reward network in
conjunction with persistent activation of the dopaminergic pathway supports the compulsive, unregulated food
consumption of palatable and high calorie foods seen in obese individuals with food addiction32,33.
Sex differences have also been observed in the brain signatures of individuals with obesity. Compared to
males, females display an increased reactivity to visual food cues and higher incidences of food cravings, and
greater activations in brain regions associated with visual stimuli identification, such as the fusiform g yrus34.
Additionally, females with obesity showed positive associations between increased BMI and lower connectivity
of core reward network regions with cortical and emotion regulation regions35,36. This has been linked to the
decreased ability to control the physiological response to negative-emotion-inducing stimuli leading to increased
emotional eating and food addictive behaviors in females with obesity compared to their male counterparts37,38.
Sex differences in food addiction have implications for treatments outcomes, as sex differences to naltrexone
responsivity have also been observed in other substance abuse disorders, with women generally reporting greater
levels of nausea, and poorer treatment adherence and o utcomes39,40.
Although past literature has addressed the association between food addiction and brain responses to stimuli,
few, if any, studies have investigated sex differences in brain signatures, in individuals with and without food
addiction. In this study, we aim to examine the neural substrates of food addiction using resting state fMRI and
determine sex differences in network connectivity in order to test the following hypotheses: (1) Individuals
with food addiction show greater connectivity with regions of the reward network, such as the basal ganglia,
compared to individuals with no food addiction. (2) Females with food addiction show greater connectivity with
regions of the brainstem, reward, and emotional regulation networks, but lowered connectivity with regions of
the brainstem, sensorimotor, and central executive regions compared to males with food addiction. (3) Higher
scores on questionnaires measuring altered ingestive eating behaviors are associated with greater connectivity
of reward and emotional regulation regions, especially in females.
Materials and methods
Subjects. A total of 150 participants (male: N = 47, female: N = 103), ages 18–55 years old, were recruited
with the use of flyers and community advertisements and enrolled in the study at the G. Oppenheimer Center
for Stress and Resilience. All participants had a BMI greater than 25 kg/m2 (obese/overweight; referred to as high
BMI henceforth). Participants were excluded for the following: major medical/neurological conditions, current
or past psychiatric illness, comorbidities (vascular disease and diabetes), weight loss/abdominal surgeries, preg-
nancy or breastfeeding, substance use, extreme strenuous exercise (> 8 h of continuous exercise per week), sub-
stance use, tobacco dependence (half a pack or more daily), and metal implants. Participants taking medications
that interfere with the central nervous system or regular use of analgesic drugs were also excluded. No partici-
pants exceeded 400lbs due to magnetic resonance imaging scanning weight limits. Since female sex hormones
such as estrogen are known to effect brain structure and function, only premenopausal females were included.
All procedures were in compliance with institutional guidelines and were approved by the Institutional Review
Board at UCLA’s Office of Protection for Research Subjects. All participants provided written informed consent.
Questionnaires. Participants were asked to fill out the Yale Food Addiction (YFAS) questionnaire, a
25-item scale developed to measure “food addiction” by assessing signs of substance-dependence symptoms
in eating behavior41. The Yale Food Addiction Scale (YFAS) has been the commonly utilized measure of food
addiction to highly palatable (high fat and high sugar) foods, as these foods have been linked with excess con-
sumption and lowered appetite modulation4,41. This scale is based upon the substance dependence criteria found
in the DSM-IV42 (e.g., tolerance [marked increase in amount; marked decrease in effect], withdrawal [agitation,
anxiety, physical symptoms], and loss of control [eating to the point of feeling physical ill])41. A symptom count
Scientific Reports | (2021) 11:3386 | https://doi.org/10.1038/s41598-021-83116-0 2
Vol:.(1234567890)www.nature.com/scientificreports/
of ≥ 3 together with endorsement of clinically significant impairment or distress on the YFAS denotes diagnostic
criteria food addiction (FA). Clinically significant impairment or distress was defined as having a at least one
positive response to the following two questions in the YFAS questionnaire: “My behavior with respect to food
and eating causes significant distress” and “I experience significant problems in my ability to function effec-
tively (daily routine, job/school, social activities, family activities, health difficulties) because of food and eating,”
similar to previously published works10. Based on a 353-respondent exploratory survey, the YFAS has displayed
a good internal reliability α = 0.8641. With these measures, participants were placed into one of the following
groups based on diagnostic criteria of food addiction (FA): 1. High BMI and with FA (N = 40) 2. High BMI and
without FA (N = 110). 3. Females with high BMI and with FA (N = 30), 4. Females with high BMI and without
FA (N = 73), 5. Males with high BMI and with FA (N = 10), and 6. Males with high BMI and without FA (N = 37).
Another questionnaire that measures abnormal ingestive behavior was also administered to participants. The
General Food Cravings Questionnaire—Traits (GFCQT-r), comprised of 15 items, measures the frequency and
intensity of food cravings as a way to study eating patterns and behavior43. Higher scores on the GFCQT-r are
positively associated with eating pathology, low dieting success, BMI, and increased food c ravings43. The GFCQT-
r has shown high internal consistency (α = 0.94) and reliability in its ability to assess food cravings as a t rait44.
The Hospital Anxiety/Depression Scale (HADS) is a 14-item questionnaire that attempts to identify both
possible and probable cases of both anxiety disorders and depression among patients in a non-psychiatric
setting45. When applied to samples of primary care, psychiatric, and somatic patients, the Hospital Anxiety/
Depression Scale has shown strong internal reliability and good concurrent v alidity45.
Functional magnetic resonance imaging acquisition. Whole brain resting-state functional data was
acquired using a 3.0 T Siemens Prisma MRI scanner (Siemens, Erlangen, Germany). Detailed information on
the standardized acquisition protocols, quality control measures, and image preprocessing are provided in previ-
ously published studies35,46–50. Resting-state scans were acquired with eyes closed and an echo planar sequence
with the following parameters: TE/TR = 28 ms/2000 ms, flip angle = 77 degrees, scan duration = 8m6s–10m6s,
FOV = 220 mm, slices = 40 and slice thickness = 4.0 mm, and slices were obtained with whole-brain coverage.
Preprocessing and quality control was done using Statistical Parametric Mapping-12 (SPM12) software and
involved bias field correction, co-registration, motion correction, spatial normalization, tissue segmentation,
and Fourier transformation for frequency distribution. Data was then spatially normalized to the Montreal Neu-
rological Institute (MNI) template using the structural scans, and then smoothed using a 4 mm isotropic Gauss-
ian kernel.
Functional network construction. Functional brain networks were constructed as previously described
i n35. To summarize, measures of region-to-region functional connectivity (Fisher transformed Pearson’s correla-
tions) were computed using the CONN toolbox and the aCompCor method in Matlab51. Confounding factors
such as white matter, cerebrospinal fluid, the six motion realignment parameters, and the root mean squared
(RMS) values of the detrended realignment estimates were regressed out for each voxel using ordinary least
squares (OLS) regression on the normalized, smoothed resting-state images52. Subjects with RMS values over
0.25 were not included. Images were then filtered using a band-pass filter (0.008/s < f < 0.08/s) to reduce the low-
and high-frequency noises. Although the influence of head motion cannot be completely removed, CompCor
has been shown to be particularly effective for dealing with residual motion relative to other methods53. Regions
of interest were segmented with the Harvard–Oxford Subcortical atlases, the Schaefer 400 cortical atlas, and
the Ascending Arousal Network brainstem atlas54,55. These atlases parceled into a total of 430 brain regions. The
ROI-ROI functional connectivity between the brain regions was indexed by a matrix of Fisher Z transformed
correlation coefficients reflecting the association between average temporal BOLD time series signals across all
voxels in each brain region. The magnitude of the Z value represents the weights in the functional network. Per-
muted statistical values from ROI-to-ROI analyses were further corrected using the false discovery rate (FDR)
to measure significance with p(FDR) < 0.05.
Statistical analyses. Descriptive statistical analyses were performed on the 150 subject dataset using SPSS
Statistics software on the four groupings listed earlier as well as a combined FA (N = 40) and no FA (N = 110)
groups. The General Linear Model (GLM) procedure in SPSS was utilized to analyze the variance and signifi-
cance between the four groups across all the clinical variables. Second level connectivity analyses were run on
CONN to discern sex differences in functional connectivity using GLMs. For all analyses, the disease-dependent
analyses (FA vs. no FA) were controlled for age and sex, and all sex difference analyses were controlled for age.
The following 5 planned contrasts were used in the statistical analyses for both the clinical variables and con-
nectivity analyses: FA > No FA, Females with FA > Males with FA, Females with FA > Females with no FA, Males
with FA > Males with no FA, Females with no FA > Males with no FA.
Results
Subject characteristics. All participants had a BMI ≥ 25 kg/m2 and were divided into two groups based
on diagnostic criteria of FA by their YFAS Symptom Count scores cut off ≥ 3 together with endorsing clinically
significant impairment or distress. A complete summary of all the group differences in clinical variables are
summarized in Tables 1 and 2.
Individuals with high BMI and food addiction had higher reported scores on the General Food Craving
Questionnaire (GFCQT) (p < 0.05), and higher anxiety (p = 0.02) and depression (p = 2.00E−3) compared to
individuals with no food addiction.
Scientific Reports | (2021) 11:3386 | https://doi.org/10.1038/s41598-021-83116-0 3
Vol.:(0123456789)www.nature.com/scientificreports/
No food addiction (YFAS Diagnostic Score: < 3, and low clinical
Food addiction (YFAS Diagnostic Score: ≥ 3, and clinical impairment and distress) impairment and distress)
Females (N = 30) Males (N = 10) Total (N = 40) Females (N = 73) Males (N = 37) Total (N = 110)
Measurement Mean SD N Mean SD N Mean SD N Mean SD N Mean SD N Mean SD N
Age 31.10 10.73 30 28.20 6.29 10 30.35 9.82 40 33.25 9.81 72 33.51 12.38 37 33.34 10.69 110
BMI 31.40 5.13 30 30.11 2.35 10 31.08 4.60 40 31.78 4.46 73 31.36 4.95 37 31.64 4.61 110
Yale Food Addiction Survey (YFAS)
YFAS withdrawal 0.73 0.94 30 0.90 1.29 10 0.78 1.03 40 0.05 0.23 73 0.08 0.28 37 0.06 0.25 110
YFAS tolerance 0.72 0.80 29 0.14 0.92 10 0.74 0.82 39 0.03 0.17 71 0.06 0.33 36 0.04 0.24 107
YFAS continued use 0.73 0.45 30 0.60 0.52 10 0.70 0.46 40 0.08 0.28 73 0.03 0.16 37 0.06 0.25 110
YFAS given up 0.63 1.16 30 1.30 1.25 10 0.80 1.20 40 0.04 0.26 72 0.00 0.00 37 0.03 0.21 109
YFAS time spent 1.00 0.91 30 0.90 0.88 10 0.98 0.89 40 0.05 0.23 73 0.03 0.16 37 0.05 0.21 110
YFAS loss of control 0.40 0.77 30 0.80 0.92 10 0.50 0.82 40 0.00 0.00 72 0.00 0.00 37 0.00 0.00 109
YFAS unsuccessful cut down 2.30 0.79 30 1.90 0.99 10 2.20 0.85 40 1.43 0.74 68 1.5 0.98 32 1.45 0.82 100
YFAS clinical significant
0.40 0.72 30 0.70 0.82 10 0.48 0.75 40 0.00 0.00 73 0.00 0.00 37 0.00 0.00 110
impairment
YFAS symptom count 4.03 1.40 30 4.30 1.42 10 4.10 1.39 40 1.11 0.59 73 0.97 0.55 37 1.06 0.58 110
General Food Craving Questionnaire (GFCQT)
GFCQT trigger 3.78 1.09 27 4.20 0.84 5 3.84 1.05 32 2.37 1.29 46 2.11 1.13 18 2.30 1.24 64
GFCQT control 16.60 5.32 27 17.6 1.52 5 16.75 4.91 32 9.89 4.64 45 8.72 3.97 18 9.56 4.45 63
GFCQT intentions 7.04 1.99 26 7.40 1.14 5 7.10 1.87 31 4.73 2.45 45 3.83 2.36 18 4.48 2.44 63
GFCQT preoccupation 15.20 5.42 27 16.40 3.72 5 15.41 5.16 32 8.74 4.09 46 7.00 3.11 18 8.25 3.89 64
GFCQT emotions 6.70 2.22 27 7.80 1.30 5 6.88 2.12 32 4.04 1.86 46 3.28 1.84 18 3.83 1.87 64
GFCQT total 49.50 15.36 26 53.40 5.94 5 50.10 14.27 31 29.93 12.92 45 24.94 11.34 18 28.51 12.61 63
Hospital Anxiety/Depression Scale (HAD)
HAD anxiety 6.26 4.37 23 5.40 3.03 10 6,00 3.98 33 4.39 3.55 72 3.76 3.08 37 4.17 3.39 109
HAD depression 3.17 3.27 23 3.70 3.30 10 3.33 3.24 33 1.97 2.34 72 1.62 1.74 37 1.85 2.15 109
Table 1. Summary of Study Demographics and Clinical Behavioral Measures. Demonstrates study
demographics and clinical behavioral measures for individuals with and without food addiction. BMI, Body
Mass Index; GFCQT, General Food Cravings Questionnaire – Trait; HAD, Hospital Anxiety and Depression
Scale; YFAS, Yale Food Addiction Scale; sd, standard deviation; p-value significant < .05.
Compared to females with food addiction, males with food addiction had higher scores on the following
YFAS subscales: Given Up (p = 4.00E−03), Loss of Control (p = 9.00E−03), and Clinical Significant Impairment
components (p = 0.03).
Within females, females with food addiction had higher scores on all components of the GFCQT (p < 0.05)
and higher anxiety (p = 0.03) and depression (p = 0.04) compared to females without food addiction. Compared
to males without food addiction, males with food addiction had higher scores on all components of the GFCQT
(p < 0.05), and depression (p = 0.02) scales.
Food addiction dependent effects on brain connectivity. Results are detailed in Table 3 and sum-
marized in Table 5, and depicted in Fig. 1.
Brainstem connectivity. Individuals with food addiction had greater connectivity between the brainstem and
middle frontal gyrus (q = 0.02), and with bilateral orbital gyri (Left and Right q = 0.02) in compared to those
without food addiction.
Emotional regulation network connectivity. Individuals with food addiction had lowered connectivity between
the inferior frontal sulcus and posterior central gyrus compared to those without food addiction (q = 0.04).
Sensorimotor network connectivity. Lowered connectivity was found between the postcentral gyrus and middle
temporal gyrus in those with food addiction compared to those without food addiction (q = 0.03).
Sex differences in the food addiction dependent effects on brain connectivity. Results are
detailed in Table 4 and summarized in Table 5, and depicted in Fig. 2.
Within sex results detailed in Supplemental Tables S1, S2, and depicted in Supplemental Figures S1, S2.
Brainstem connectivity. Compared to females without food addiction, females with food addiction had greater
connectivity between the brainstem and middle-anterior part of the cingulate gyrus/sulcus (q = 0.04).
Scientific Reports | (2021) 11:3386 | https://doi.org/10.1038/s41598-021-83116-0 4
Vol:.(1234567890)www.nature.com/scientificreports/
Females with food
Females with food addiction versus Males with food
Food addiction versus addiction versus males females with no food addiction versus males
no food addiction with food addiction addiction with no food addiction
Measurement F-statistic p-value F-statistic p-value F-statistic p-value F-statistic p-value
Age 2.92 0.09 0.56 4.00E−03 6.00E−03 6.00E−03 2.01 0.01
BMI 9.58 2.00E−03 0.70 0.41 9.62 2.00E−03 3.01 0.09
Height 0.60 0.44 16.33 8.59E−05 0.15 0.70 1.29 0.26
Weight 5.23 0.02 2.16 0.14 7.07 9.00E−03 1.12 0.29
Hip 2.44 0.12 1.75 0.19 7.45 8.00E−03 0.40 0.84
Yale Food Addiction Survey (YFAS)
YFAS withdrawal 39.76 3.22E−09 0.64 0.42 30.21 1.68E−07 16.29 8.72E−05
YFAS tolerance 53.50 1.73E−11 0.20 0.66 45.53 3.78E−10 19.72 1.79E−05
YFAS continued use 85.23 2.84E−16 1.32 0.26 89.25 7.95E−17 25.59 1.25E−06
YFAS given up 51.39 3.56E−11 8.34 4.00E−03 18.55 3.03E−05 33.29 4.62E−08
YFAS time spent 77.77 3.20E−15 0.31 0.58 77.79 3.18E−15 24.57 1.96E−06
YFAS loss of control 48.32 1.14E−10 7.02 0.01 19.81 1.69E−05 29.46 2.34E−07
YFAS unsuccessful cut down 13.11 4.13E−04 1.74 0.19 23.02 4.16E−06 1.77 0.19
YFAS clinical significant impair-
47.65 1.45E−10 4.63 0.03 23.32 3.43E−06 26.44 8.60E−07
ment
YFAS symptom count 294.83 7.44E−37 0.70 0.40 238.71 1.60E−32 114.45 4.41E−20
General Food Craving Questionnaire (GFCQT)
GFCQT trigger 27.54 9.81E−07 0.53 0.47 23.88 4.31E−06 12.09 1.00E−03
GFCQT control 35.85 4.19E−08 0.20 0.66 35.25 5.22E−08 14.34 2.74E−04
GFCQT intentions 21.17 1.37E−05 0.11 0.75 17.00 8.29E−05 9.67 0.003
GFCQT preoccupation 42.61 3.59E−09 0.31 0.58 37.97 1.88E−08 18.36 4.50E−05
GFCQT emotions 43.39 2.74E−09 1.34 0.25 31.84 1.84E−07 21.16 1.35E−05
GFCQT total 42.07 4.65E−09 0.38 0.54 36.31 3.62E−08 18.31 4.68E−05
Hospital Anxiety/Depression Scale (HAD)
HAD anxiety 5.33 0.02 0.41 0.52 4.85 0.03 1.69 0.12
HAD depression 9.70 2.00E−03 0.32 0.57 4.19 0.04 5.65 0.02
Table 2. Group differences in demographics and clinical behavioral measures. BMI, Body Mass Index;
GFCQT, General Food Cravings Questionnaire—Trait; HAD, Hospital Anxiety and Depression Scale; YFAS,
Yale Food Addiction Scale. p-value significant < .05. All significant group differences in demographics and
clinical behavioral measures for individuals with food addiction (females and males) and individuals with no
food addiction (females and males). All bolded values are significant p < 0.05.
Food addiction versus no food addiction
Network Analysis unit Network Analysis unit df t p-value q-value Interpretation
Brainstem 113 connections
L_MFG (R_ContB_
Bst L MRF CEN 146 4.05 8.28E−05 0.02 Greater
PFClv_3)
R_OrG, (R_ContB_
Bst L_MRF CAN 146 3.98 1.08E−04 0.02 Greater
PFClv_2)
L_OrG, (L_ContB_
Bst L_MRF CAN 146 3.89 1.52E−04 0.02 Greater
PFClv_1)
Emotional regulation (ERN) network connections
L_InfFS, (R_ContA_ R_PosCG, (R_Som-
ERN SMN 146 − 4.00 1.00E−04 0.04 Lower
PFCl_2) MotA_16)
Sensorimotor (SMN) network connections
R_PosCG, (R_Som-
SMN DMN R_MTG, (R_TempPar_6) 146 − 4.11 6.57E−05 0.03 Lower
MotA_16)
Table 3. Resting state pairwise connections in individuals with food addiction compared to individuals
with no food addiction. Summarizes significant disease-related differences in functional connectivity
(individuals with food addiction vs. individuals with no food addiction). All connections are significant
q < 0.05. Bst, Brainstem; CAN, Central Autonomic Network; CEN, Central Executive Network; DMN, Default
Mode Network; ERN, Emotional Regulation Network; InfFS, Inferior frontal sulcus; MFG, Middle frontal
gyrus; MRF, Mesencephalic reticular formation; MTG, Middle Temporal Gyrus; OrG, Orbital gyri; PosCG,
Postcentral Gyrus; SMN, Sensorimotor Network. df: degrees of freedom; p value significant < .05, q value
(corrected for multiple comparisons) < .05.
Scientific Reports | (2021) 11:3386 | https://doi.org/10.1038/s41598-021-83116-0 5
Vol.:(0123456789)www.nature.com/scientificreports/
Figure 1. Connectogram depicting food addiction dependent differences in brain connectivity (food addiction
vs. no food addiction). Demonstrates significant differences in functional connectivity between individuals
with food addiction and individuals with no food addiction. Analysis was performed Harvard–Oxford
Subcortical atlases, the Schaefer 400 cortical atlas, and the Ascending Arousal Network brainstem atlas. Labels
on the diagram are Destrieux, Harvard–Oxford Subcortical atlases, and the Ascending Arousal Network
brainstem atlas equivalents. Red lines between two networks indicate greater functional connectivity, and
blue lines indicate lowered functional connectivity. All connections are significant q < 0.05. Light Green: SMN
(Sensorimotor Network); Black: BG (Basal Ganglia); Purple: DMN (Default Mode Network); Yellow: SAL
(Salience); Red: ERN (Emotional Regulation Network); Dark Green: CAN (Central Autonomic Network);
Orange: CEN (Central Executive Network); Blue: OCC (Occipital); Gray: CeB (Cerebellum); Brown: BST (Brain
Stem). Bst, Brainstem; CAN, Central Autonomic Network; CEN, Central Executive Network; DMN, Default
Mode Network; ERN, Emotional Regulation Network; InfFS, Inferior frontal sulcus; MFG, Middle frontal gyrus;
MRF, Mesencephalic reticular formation; MTG, Middle Temporal Gyrus; OrG, Orbital gyri; PosCG, Postcentral
Gyrus; SMN, Sensorimotor Network.
Compared to males without food addiction, males with food addiction had greater connectivity between
the brainstem and bilateral middle frontal gyrus, orbital gyrus, and middle occipital gyrus (q = 0.04), but lower
connectivity between the brainstem and parahippocampal gyrus (q = 0.03), brainstem and precentral gyrus
(q = 0.04), and the brainstem and anterior traverse collateral sulcus (q = 0.04).
Emotional regulation network connectivity. Compared to males with food addiction, females with food addic-
tion had greater connectivity between the inferior frontal gyrus and paracentral lobule (q = 0.04).
Compared to females with no food addiction, females with food addiction had lower connectivity between
the inferior frontal sulcus and subcentral gyrus (q = 0.01) and between the inferior frontal gyrus and superior
parietal lobule (q = 0.03).
Salience network connectivity. Compared to males with food addiction, females with food addiction had
greater connectivity between the short insular gyrus and paracentral lobule (q = 0.01) and between the middle/
posterior part of the cingulate gyrus and superior temporal gyrus (q = 0.03).
Compared to males without food addiction, males with food addiction had greater connectivity between the
opercular part of the inferior frontal gyrus and the inferior part of the precentral sulcus (q = 0.03).
Scientific Reports | (2021) 11:3386 | https://doi.org/10.1038/s41598-021-83116-0 6
Vol:.(1234567890)www.nature.com/scientificreports/
Females with food addiction versus males with food addiction
Network Analysis unit Network Analysis unit df t p-value q-value Interpretation
Emotional regulation (ERN) network connections
L_InfFGTrip (L_DefaultB_ L_PaCL_S (L_Som-
ERN SMN 147 3.99 1.04E-04 0.04 Greater
PFCv_4) MotA_6)
Salience (SAL) network connections
L_ShoInG (L_SalVen- L_PaCL_S (L_Som-
SAL SMN 147 4.31 2.97E-05 0.01 Greater
tAttnA_Ins_1) MotA_13)
R_MPosCgG_S, (R_Sal- L_SupTGLp, (L_Temp-
SAL DMN 147 3.64 3.77E-04 0.03 Greater
VentAttnA_ParMed_1) Par_6)
Sensorimotor (SMN) network connections
R_SupFG, (R_DefaultA_ L_MOcS_LuS, (L_Vis-
SMN SMN 147 − 3.98 1.08E−04 0.04 Lower
PFCm_5) Cent_ExStr_8)
L_PaCL_S (L_Som- L_MFG (L_ContB_
SMN CEN 147 4.54 1.16E−05 0.01 Greater
MotA_19) PFCd_1)
L_PaCL_S (L_Som- L_MFG (L_DefaultB_
SMN CEN 147 3.96 1.16E−04 0.03 Greater
MotA_19) PFCl_2)
R_PosCG (R_DorsAttnB_ L_IntPS_TrPS (L_ContB_
SMN CEN 147 − 3.66 3.51E−04 0.04 Lower
PostC_1) IPL_3)
L_PRCG, (L_Som- L_SupTGLp, (L_Temp-
SMN DMN 147 3.67 3.39E−04 0.03 Greater
MotA_13) Par_6)
L_SupTGLp, (L_Temp-
SMN R_CS, (R_SomMotA_10) DMN 147 3.23 1.53E−03 0.04 Greater
Par_6)
L_PaCL_S, (L_Som- L_SupTGLp, (L_Temp-
SMN DMN 147 3.50 6.16E−04 0.03 Greater
MotA_19) Par_6)
R_PRCG, (R_Som- L_SupTGLp, (L_Temp-
SMN DMN 147 3.44 7.57E−04 0.03 Greater
MotA_14) Par_6)
R_PosCG, (R_Som- L_SupTGLp, (L_Temp-
SMN DMN 147 3.33 1.10E−03 0.04 Greater
MotA_6) Par_6)
R_SupFG, (R_ContB_ L_SupTGLp, (L_Temp-
SMN DMN 147 − 3.98 1.08E−04 0.04 Lower
PFCmp_1) Par_6)
L_SupFG, (L_ContB_ L_SupTGLp, (L_Temp-
SMN DMN 147 − 3.56 5.00E−04 0.03 Lower
PFCmp_1) Par_6)
Central executive network (CEN) connections
R_MFG, (R_ContB_ L_SupTGLp, (L_Temp-
CEN DMN 147 − 3.63 3.91E−04 0.03 Lower
PFCld_4) Par_6)
L_SbPS, (L_DefaultA_ L_SupTGLp, (L_Temp-
CEN DMN 147 − 3.38 9.28E−04 0.04 Lower
pCunPCC_7) Par_6)
L_IntPS_TrPS, (L_ContB_ R_SuMarG, (R_SalVen-
CEN DMN 147 − 3.96 1.16E−04 0.04 Lower
IPL_3) tAttnA_ParOper_2)
L_IntPS_TrPS, (L_ContB_ R_SuMarG, (R_SalVen-
CEN DMN 147 − 3.68 3.27E−04 0.04 Lower
IPL_3) tAttnA_ParOper_1)
L_IntPS_TrPS, (L_ContB_ R_SuMarG, (R_SalVen-
CEN DMN 147 − 3.60 4.34E−04 0.04 Lower
IPL_3) tAttnA_ParOper_3)
L_IntPS_TrPS, (L_ContB_ L_SuMarG, (L_SalVen-
CEN DMN 147 − 3.63 3.91E−04 0.04 Lower
IPL_3) tAttnA_ParOper_1)
Default mode network (DMN) connections
R_SuMarG, (R_Temp- R_PrCun, (R_ContC_
DMN DMN 147 − 4.37 2.34E−05 0.01 Lower
Par_10) pCun_3)
R_PrCun, (R_ContC_ L_SupTGLp, (L_Temp-
DMN DMN 147 − 3.70 3.04E−04 0.03 Lower
pCun_3) Par_6)
L_PrCun, (L_ContC_ L_SupTGLp, (L_Temp-
DMN DMN 147 − 3.62 4.05E−04 0.03 Lower
pCun_3) Par_6)
R_AngG, (R_ContB_ L_SupTGLp, (L_Temp-
DMN DMN 147 − 3.59 4.50E−04 0.03 Lower
IPL_2) Par_6)
R_Tpo, (R_LimbicA_ R_SuMarG, (R_SalVen-
DMN DMN 147 3.87 1.63E−04 0.04 Greater
TempPole_1) tAttnA_ParOper_2)
L_SupTGLp, (L_Temp- L_MPosCgG_S, (L_Som-
DMN DMN 147 3.31 1.17E−03 0.04 Greater
Par_6) MotA_1)
Scientific Reports | (2021) 11:3386 | https://doi.org/10.1038/s41598-021-83116-0 7
Vol.:(0123456789)www.nature.com/scientificreports/
Table 4. Resting state pairwise connections in females with food addiction compared to males with food
addiction. Summarizes significant sex-related differences in functional connectivity (females with food
addiction vs. males with food addiction). All connections are significant q < 0.05. AngG, Angular gyrus;
CEN, Central Executive Network; CS, Central sulcus (Rolando’s fissure); DMN, Default Mode Network;
ERN, Emotional Regulation Network; InfFGTrip, Triangular part of the inferior frontal gyrus; IntPS_TrPS,
Intraparietal sulcus(interparietal sulcus) and transverse parietal sulci; MFG, Middle frontal gyrus; MOcS_LuS,
Middle occipital sulcus and lunatus sulcus; MPosCgG_S, Middle-posterior part of the cingulate gyrus and
sulcus; PaCL_S, Paracentral lobule and sulcus; PosCG, Postcentral Gyrus; PRCG, Precentral gyrus; PrCun,
Precuneus; ShoInG, Short insular gyri; Tpo, temporal pole; SAL, Salience Network SbPS, Subparietal sulcus;
SMN, Sensorimotor Network; SupFG, Superior frontal gyrus; SuMarG, Supramarginal gyrus; SupTGLp,
Lateral aspect of the superior temporal gyrus. df: degrees of freedom; p value significant < .05, q value
(corrected for multiple comparisons) < .05.
Food addiction versus no food Females with food addiction versus Females with food addiction versus Males with food addiction vs.
Network addiction males with food addiction females with no food addiction males with no food addiction
Brainstem Food addiction ↑ Females with food addiction ↑ Males with food addiction ↑↓
Emotional regulation Food addiction ↓ Females with food addiction ↑ Females with food addiction ↓
Salience Females with food addiction ↑ Males with food addiction ↑
Sensorimotor Food addiction ↓ Females with food addiction ↑ Females with food addiction ↓ Males with food addiction ↓
Central autonomic Females with food addiction ↑
Central executive Females with food addiction ↓ Females with food addiction ↑
Default mode Females with food addiction ↓ Males with food addiction ↑
Table 5. Summary of all group comparisons in network connectivity (food addiction and sex). Summarizes
the group (disease effect, sex effect, and within-sex contrasts) network connectivity differences. ↑, Greater
connectivity; ↓, Lower Connectivity.
Sensorimotor network connectivity. Compared to males with food addiction, females with food addiction had
greater connectivity between the paracentral lobule/sulcus and the middle frontal gyrus (q = 0.01–0.03), and
between the central sulcus, precentral gyrus and superior temporal gyrus (q = 0.03–0.04).
Compared to females without food addiction, females with food addiction had lowered connectivity between
the inferior frontal gyrus and subcentral gyrus (q = 0.02) and between the precentral gyrus and lingual gyrus
(q = 0.04).
Compared to males with no food addiction, males with food addiction had lowered connectivity between
the paracentral lobule and middle frontal gyrus (q = 0.04).
Central autonomic network connectivity. Compared to females without food addiction, females with food
addiction had greater connectivity between the anterior cingulate gyrus and sulcus and paracentral lobule
(q = 3.00E-03).
Central executive network connectivity. Compared to males with food addiction, females with food addiction
had lowered connectivity between the middle frontal gyrus and superior temporal gyrus (q = 0.03), intraparietal
sulcus and supramarginal gyrus (q = 0.04), and superior frontal gyrus and superior temporal gyrus (q = 0.03–
0.04).
Compared to females without food addiction, females with food addiction had greater connectivity between
the intraparietal sulcus and orbital gyrus (q = 0.03).
Default mode network connectivity. Compared to males with food addiction, females with food addiction had
lowered connectivity between the supramarginal gyrus and the precuneus (q = 0.01), precuneus and superior
temporal gyrus (q = 0.03), and superior temporal gyrus and angular gyrus (q = 0.03).
Compared to males without food addiction, males with food addiction had greater connectivity between the
supramarginal gyrus and the precuneus (q = 0.02) and between the temporal pole and orbital sulcus (q = 0.03).
Associations between brain connectivity and clinical variables. Food addiction associations. Re-
sults are summarized in Table 6.
For individuals with no food addiction, connectivity between the brainstem (mesencephalic reticular forma-
tion) and central autonomic network (orbital gyrus) was positively associated with BMI (r = 0.35, q = 0.01) and
negatively associated with the Intention component of the GFCQT (r = − 0.38, q = 0.04).
Sex difference associations. Results are summarized in Table 6.
Scientific Reports | (2021) 11:3386 | https://doi.org/10.1038/s41598-021-83116-0 8
Vol:.(1234567890)www.nature.com/scientificreports/
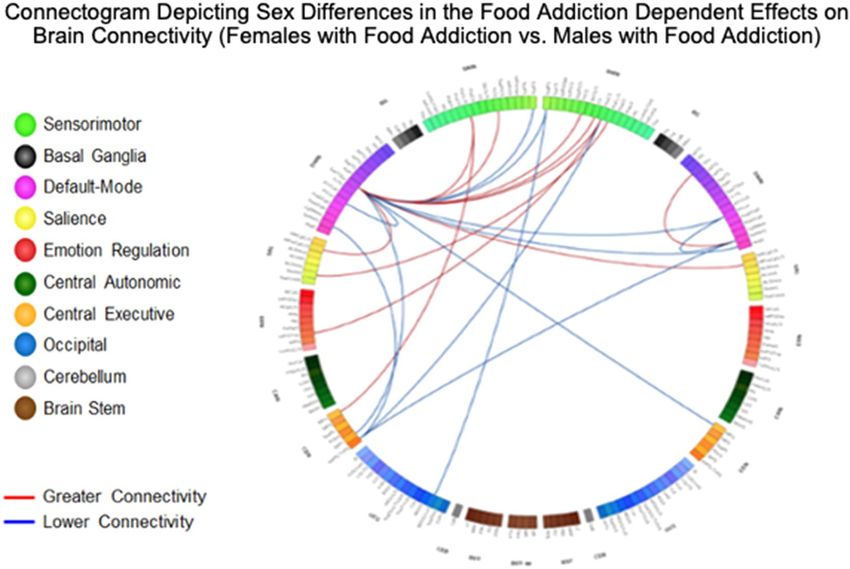
Figure 2. Connectogram Depicting Sex Differences in the Food Addiction Dependent Effects on Brain
Connectivity (Females with Food Addiction vs. Males with Food Addiction). Demonstrates significant
differences in functional connectivity between females with food addiction and males with food
addiction. Analysis was performed Harvard–Oxford Subcortical atlases, the Schaefer 400 cortical atlas, and the
Ascending Arousal Network brainstem atlas. Labels on the diagram are Destrieux, Harvard–Oxford Subcortical
atlases, and the Ascending Arousal Network brainstem atlas equivalents. Red lines between two networks
indicate greater functional connectivity, and blue lines indicate lowered functional connectivity. All connections
are significant q < 0.05. Light Green: SMN (Sensorimotor Network); Black: BG (Basal Ganglia); Purple: DMN
(Default Mode Network); Yellow: SAL (Salience); Red: ERN (Emotional Regulation Network); Dark Green:
CAN (Central Autonomic Network); Orange: CEN (Central Executive Network); Blue: OCC (Occipital);
Gray: CeB (Cerebellum); Brown: BST (Brain Stem). AngG, Angular gyrus; CEN, Central Executive Network;
CS, Central sulcus (Rolando’s fissure); DMN, Default Mode Network; ERN, Emotional Regulation Network;
InfFGTrip, Triangular part of the inferior frontal gyrus; IntPS_TrPS, Intraparietal sulcus(interparietal sulcus)
and transverse parietal sulci; MFG, Middle frontal gyrus; MOcS_LuS, Middle occipital sulcus and lunatus
sulcus; MPosCgG_S, Middle-posterior part of the cingulate gyrus and sulcus; PaCL_S, Paracentral lobule and
sulcus; PosCG, Postcentral Gyrus; PRCG, Precentral gyrus; PrCun, Precuneus; ShoInG, Short insular gyri; Tpo,
temporal pole; SAL, Salience Network SbPS, Subparietal sulcus; SMN, Sensorimotor Network; SupFG, Superior
frontal gyrus; SuMarG, Supramarginal gyrus; SupTGLp, Lateral aspect of the superior temporal gyrus.
In females with food addiction, connectivity between the brainstem (locus coeruleus) and emotional regu-
lation network (middle-anterior part of the cingulate gyrus and sulcus) was positively associated with BMI
(r = 0.61, q = 0.04).
Discussion
The goal of this study was to identify sex-related differences in the connectivity of brain networks in individu-
als meeting diagnostic criteria for food addiction. The main findings of the study were: 1) Food addiction was
associated with greater connectivity among the reward regions and between the brainstem and central autonomic
networks, and lower connectivity among the emotional regulation, sensorimotor, and default mode networks
compared to those with no food addiction. 2. Sex differences were observed with females showing greater con-
nectivity in the emotional regulation and salience networks and lower connectivity in the brainstem, central
executive, and default mode networks. Our results support the hypothesis that altered connectivity in reward
regions could increase the risk for addictive ingestive behaviors, resulting in the uncontrollable overeating pat-
terns seen in individuals with clinically significant impairment or distress with food addiction. Additionally, our
results indicate greater connectivity in particular resting-state networks, such as the emotional regulation and
salience networks, which could explain the higher rates of emotional eating and food addiction seen in females.
To our knowledge, this is the first study to investigate sex-related differences in resting-state connectivity in
individuals with food addiction.
Scientific Reports | (2021) 11:3386 | https://doi.org/10.1038/s41598-021-83116-0 9
Vol.:(0123456789)www.nature.com/scientificreports/
Food addiction versus no food addiction
Food addiction
No significant results
No food addiction
Functional Connectivity Clinical variables r p q df
MRF to right OrG* BMI 0.35 2.10E−04 0.01 106
MRF to left OrG GFCQT intentions − 0.38 2.00E−03 0.04 59
Females with food addiction versus males with food addiction
Females with food addiction
No significant results
Males with food addiction
No significant results
Females with food addiction vs females with no food addiction
Females with food addiction
Functional connectivity Clinical variables r p q df
LC to left ACgG_S BMI 0.61 4.00E-04 0.04 27
Females with no food addiction
No significant results
Males with food addiction versus males with no food addiction
Males with food addiction
No significant results
Males with no food addiction
No significant results
Table 6. Associations between significant functional connectivities and clinical variables. Summarizes
correlations between functional connectivity and clinical variables. Comparisons include disease differences
(individuals with food addiction vs. individuals with no food addiction), sex differences (females with food
addiction vs. males with food addiction), disease effect within females (females with food addiction vs. females
with no food addiction), and disease effect within males (males with food addiction vs. males with no food
addiction). All connections are significant q < 0.05. *Right ContB_PFClv_3. ACgG_S, Middle-anterior part of
thecingulate gyrus and sulcus; BMI, Body Mass Index; GFCQT, General Food Cravings Questionaire—Trait;
LC, locus coeruleus; MRF, Mesencephalic reticular formation; OrG, Orbital gyri. r: correlation, df: degrees of
freedom; p value significant < .05, q value (corrected for multiple comparisons) < .05.
Food addiction dependent effects on brain connectivity. Uncontrollable eating seen in food addic-
tion, can be explained by the reward deficiency hypothesis which states that a decreased availability of dopa-
mine receptors, specifically D2 receptors, creates a less responsive reward system that is susceptible to addic-
tive pathologies35,56–60. Drug-addiction studies have associated drug-dependence with changes in the dopamine
receptor availability, with individuals with decreased receptors seeking greater and more frequent reward
stimulation57. In individuals with food addiction, high sugar/high fat foods act as this source of stimulation, as
such these ultra-processed foods serve as potent reward triggers that increase synaptic dopamine concentration
overriding internal satiety cues57,61. Hence, the constant hypodopaminergic state of these individuals results in
increased levels of food cravings and overindulgence of ultra-processed foods as a compensatory attempt to
derive the euphoric effects of reward network stimulation62,63. Studies have also suggested that disruptions in the
mesolimbic pathways associated with addiction behaviors effects both the DA reward circuits and DA pathways
that lead to increased stress reactivity and disruption in interoceptive a wareness29,57,64.
Consistent with the reward deficiency hypothesis, our results indicated greater connectivity between the
brainstem and reward regions in individuals with food addiction. This could be associated with dopaminergic
dysregulation, as the increased intake of ultra-processed foods, in those with food addiction leads to a more
persistent stimulation of the reward pathway as a compensatory mechanism for the decreased receptor sensitiv-
ity and availability19,33,65. On the other hand, in those with no food addiction, a greater connectivity between
the brainstem and the central autonomic network (orbital gyrus) was negatively associated with GFCQT scores,
a measure of food cravings. Perhaps, in individuals with food addiction, increases in brainstem connectivity
could be a result of an increased frequency of dopamine release in response to select salient inputs, such as
ultra-processed foods, causing heightened reactions and cravings to consume larger quantities of such foods66,67.
This increased brainstem connectivity, could be a counterbalancing mechanism for the reduction in dopamine
receptors in the reward circuit per the reward deficiency h ypothesis26,32,57,68.
In addition to decreased reward sensitivity, hyperactivation of the locus coeruleus could also contribute to
the habitual overconsumption of ultra-processed foods seen in individuals with food addiction. The locus coer-
uleus plays a major role in an individual’s response to external stressors, with greater activation being linked to
consistent higher levels of norepinephrine seen in individuals with a nxiety69. Individuals in a sustained state of
anxiety, consistently have elevated levels of norepinephrine which result in cortical atrophy leading to reduced
Scientific Reports | (2021) 11:3386 | https://doi.org/10.1038/s41598-021-83116-0 10
Vol:.(1234567890)www.nature.com/scientificreports/
cognitive and attentional control70. Thus, greater activation of the locus coeruleus could translate to a greater
susceptibility to maladaptive, habitual behaviors such as food addiction due a combination of decreased internal
regulation capabilities and perpetual anxiety in individuals with food a ddiction69,70.
Our results mirrored these predicted differences, with individuals with food addiction displaying significantly
higher rates of anxiety, particularly in females. Additionally, greater connectivity between the locus coeruleus
and the emotional regulation network was positively associated with BMI in females with food addiction. These
results suggest the role of the locus coeruleus in weight management may contribute to the food addictive
behaviors in an attempt to cope with anxiety.
Sex differences in the food addiction dependent effects on brain connectivity. Compared
to males with food addiction, females with food addiction displayed significantly higher rates of emotional
overeating37,38. Emotional overeating is related to cognitive alterations in two aspects: the inability to regulate
emotional states and the inability to limit consumption of especially ultra-processed foods when in a com-
promised emotional state71. According to the self-medication hypothesis, individuals with difficulties in self-
regulation turn to specific actions or external substances to help relieve the negative emotional impact of stimuli,
resulting in substance abuse disorders72,73. In the case of food addiction, females with food addiction utilize high
sugar/high fat foods as their sources of stimulation, in an attempt to lessen their emotional load57. The second
aspect of emotional overeating, the reduced capability to limit intake of ultra-processed foods, is a result of
lowered cognitive inhibitions created by heightened reactivity to food cues and attenuated satiety r esponses74–76 .
According to the incentive salience model, the motivational value of a “reward” is based on trigger cues, such
as the sight, smell, and taste of ultra-processed f oods77. In cases of addiction, other rewards are perceived to
have a diminished incentive value relative to the drug causing compulsive behavior, reorientation of attentional
resources, and downregulation of cognitive control r egions57,78. This creates an increased reward being placed
on ultra-processed foods, resulting in individuals seeking out these types of food beyond their basic homeostatic
needs and even when their consumption leads to negative consequences57. In addition, due to the chronic con-
sumption of high sugar/high fat foods, satiety signals in these individuals are compromised, as the palatability
of ultra-processed food stimuli overrides an individual’s energy n eed79. These altered satiety cues in conjunction
with increased response to food cues translate into more frequent and greater overeating behaviors.
Our results support this emotional overeating model, with females with food addiction exhibiting greater
connectivity between the emotional regulation and salience networks compared to males with food addiction.
Greater activation of the emotional regulation network aligns with the self-medication hypothesis, as females
with food addiction engage in uncontrollable eating behaviors as an artificial coping mechanism to manage
their emotional response to negative stimuli, similar to that of a drug46,80–84. The tendency of females with food
addiction to actively seek out and consume ultra-processed foods in response to negative emotional stimuli,
could refer to the relationship between greater emotional instability and increased food-seeking behavior as
predicted in our model67,85.
The greater connectivity observed in the salience network, particularly between the salience and default
mode network, is similarly consistent with our hypothesis and the incentive salience model77,86. The salience
network adjusts attentional resources to salient sensory stimuli, with the observed greater activation suggest-
ing an increased attentional value on food cues12,81,87–90. As females with food addiction place greater value and
attention towards ultra-processed foods, the “incentive value” of this stimuli increases, resulting in a greater
subconscious food focus and food cravings77,86,91. Additionally, this greater preoccupation towards ultra-pro-
cessed foods, seen in females with food addiction, may also cause inhibition of cognitive regions in areas of the
default-mode network leading to increased decisional impulsivity and lowered inhibitory responses in response
to salient s timuli92,93.
Compared to males with food addiction, females with food addiction had greater connectivity among the
sensorimotor network, particularly in the regions controlling evaluation of external s timuli94–97. These regions,
namely the precentral gyrus and paracentral lobule, have been linked with altered explicit memory and inap-
propriate cognitive evaluations, potentially resulting in an increased motivational reward placed on food-related
stimuli in females with food addiction98,99.
Additionally, when compared to females with no food addiction, those with food addiction exhibited lower
connectivity in the sensorimotor network in regions involved in inhibition and attentional control, such as the
inferior frontal g yrus100. Hypoactivation in the inferior frontal gyrus suggests increased impulsivity and the
reinforcement of habit-forming systems, leading to weakened attempts to disengage with compulsive eating
behaviors101.
Consistent with our model, females with food addiction had lowered connectivity within the default mode
network compared to males with food addiction, potentially explaining the reduced cognitive control and greater
preoccupation with food-related stimuli predicted in females with food addiction102. The default mode network
plays a major role in self-generated and subconscious thought, displaying greater activation when r esting103,104.
Specifically, the dorsal medial prefrontal cortex subsystem has shown to preferentially activate during subcon-
scious decision-making processes regarding one’s present mental state or situation105,106. Lower activation in this
subsystem could translate to decreased subconscious inhibitions and altered attentional processing as a result
of the top-down inhibition on cognitive control r egions102,107,108. Weakened cognitive control circuits, upon
interacting with the reward and emotional regulation system, reorient attentional resources in those with food
addiction and create a vicious cycle of chronic overconsumption, impaired appetite regulation, and heightened
food focus109. Additionally, consistent with the incentive salience model, our results showed lowered connectivity
between the default mode network and the central executive network in females with food addiction, indicating
Scientific Reports | (2021) 11:3386 | https://doi.org/10.1038/s41598-021-83116-0 11
Vol.:(0123456789)www.nature.com/scientificreports/
that the lowered awareness of the present state results in less sensitive internal body cues and chronic food con-
sumption behaviors as predicted in our h ypothesis74–76.
Limitations and future research. Due to the cross-sectional design of the study, we were unable to
address questions of causality between functional connectivity differences and food addiction. Future longitu-
dinal studies are needed to determine if the observed connectivity differences between brain networks in indi-
viduals with food addiction are a premorbid state, or if they are a consequence of food addiction and associated
metabolic changes. The integration of systemic inflammatory markers and metabolites derived from gut micro-
biota as mediators can help gain a more comprehensive understanding of food addiction in future mechanistic
studies. While this study focused on resting-state connectivity differences, future research should consider inves-
tigating connectivity differences in response to ultra-processed food cues in individuals with food addiction.
In order to be able to combine data to obtain a large sample size for subgroup analyses, all participants in this
study completed the earlier version of the YFAS vs. the updated YFAS 2.0 questionnaire which is not only more
psychometrically sound but has a stronger threshold of FA associated with obesity. This may have contributed
to a reduced sensitivity in observing significant results, which will need to be validated in future studies using
the YFAS 2.0.
Conclusions and clinical implications. When viewed together with previous findings, our results show
greater connectivity in reward regions, indicative of the altered function of the reward circuit in individuals
with food addiction. Sex differences in functional connectivity reveal that females with food addiction engage in
more emotional eating behaviors while males with food addiction exhibit greater cognitive control and homeo-
static processing. Since connectivity differences differ among males and females, this study contributes to the
understanding of the nuances driving the sex-specific pathophysiology of food addiction. These mechanistic
pathways may have clinical implications for understanding the variability in response to diet interventions and
the need for more effective, targeted treatments for those with food addiction, especially females. Most clinical
trials do not report sex differences related to treatment responses, but a few existing reports suggest that women
are less likely to complete treatment, tend to lose less weight than men, have greater unsuccessful attempts to
maintain weight loss resulting in the well-known “YoYo” diet phenomenon, and have limited responses to phar-
macological treatments12,110,111. Therefore, treatments need to focus on the different sex-related eating patterns,
such as women gaining weight via eating ultra-processed foods more frequently during emotional or stressful
times, as compared to men, who gain weight via the consumption of larger meals. Therapeutic approaches would
need to target different nodes of the brain related to food addiction, and individualization of treatments would
need to be based on sex-related differences in order to improve greater clinical b enefits13,112.
Received: 3 December 2020; Accepted: 7 January 2021
References
1. Craig, M. D., Hales, M., Carroll, M. D., Cheryl, M.S.P.H., Fryar, D., & Ogden, C. L. Prevalence of obesity and severe obesity
among adults: United States, 2017–2018, NCHS Data Brief (2020).
2. Panuganti, K. K. & Kshirsagar, R. K. Obesity (StatPearls, Treasure Island (FL), 2020).
3. Zhou, L., Zeng, Q., Jin, S. & Cheng, G. The impact of changes in dietary knowledge on adult overweight and obesity in China.
PLoS ONE 12, e0179551 (2017).
4. Lerma-Cabrera, J. M., Carvajal, F. & Lopez-Legarrea, P. Food addiction as a new piece of the obesity framework. Nutr. J. 15, 5
(2016).
5. Pedram, P. et al. Food addiction: its prevalence and significant association with obesity in the general population. PLoS ONE 8,
e74832 (2013).
6. Gold, M. S., Graham, N. A., Cocores, J. A. & Nixon, S. J. Food addiction?. J. Addict. Med. 3, 42–45 (2009).
7. Schulte, E. M., Avena, N. M. & Gearhardt, A. N. Which foods may be addictive? The roles of processing, fat content, and glycemic
load. PLoS ONE 10, e0117959 (2015).
8. Carter, A. et al. The neurobiology of “food addiction” and its implications for obesity treatment and policy. Annu. Rev. Nutr. 36,
105–128 (2016).
9. Gearhardt, A. N., Corbin, W. R., & Brownell, K. D. Development of the Yale Food Addiction Scale Version 2.0. Psychol. Addict.
Behav. 30, 113–121 (2016).
10. Gordon, E. L., Ariel-Donges, A. H., Bauman, V., & Merlo, L. J. What is the evidence for "food addiction”? A systematic review.
Nutrients 10 (2018).
11. Gearhardt, A. N., Davis, C., Kuschner, R. & Brownell, K. D. The addiction potential of hyperpalatable foods. Curr. Drug Abuse
Rev. 4, 140–145 (2011).
12. Hallam, J., Boswell, R. G., DeVito, E. E. & Kober, H. Gender-related differences in food craving and obesity. Yale J. Biol. Med.
89, 161–173 (2016).
13. Striegel-Moore, R. H. et al. Gender difference in the prevalence of eating disorder symptoms. Int. J. Eat. Disord. 42, 471–474
(2009).
14. Sengor, G. & Gezer, C. Food addiction and its relationship with disordered eating behaviours and obesity. Eat Weight Disord
24, 1031–1039 (2019).
15. Yu, Z. et al. Sex differences in disordered eating and food addiction among college students. Appetite 129, 12–18 (2018).
16. Biswal, B. B. et al. Toward discovery science of human brain function. Proc. Natl. Acad. Sci. USA 107, 4734–4739 (2010).
17. Fox, M. D. & Raichle, M. E. Spontaneous fluctuations in brain activity observed with functional magnetic resonance imaging.
Nat. Rev. Neurosci. 8, 700–711 (2007).
18. van den Heuvel, M. P., & Hulshoff Pol, H. E. Exploring the brain network: a review on resting-state fMRI functional connectivity.
Eur. Neuropsychopharmacol. 20, 519–534 (2010).
Scientific Reports | (2021) 11:3386 | https://doi.org/10.1038/s41598-021-83116-0 12
Vol:.(1234567890)You can also read