A Graph Theory approach to assess nature's contribution to people at a global scale - arXiv.org
←
→
Page content transcription
If your browser does not render page correctly, please read the page content below
A Graph Theory approach to assess nature’s
                                               contribution to people at a global scale∗
                                                Silvia de Juan Mohan1 , Andres Ospina-Alvarez†2 , Sebastián
arXiv:2007.14308v2 [cs.SI] 15 Feb 2021

                                                             Villasante3, 4 , and Ana Ruiz-Frau2
                                            1
                                               Marine Science Institute (ICM-CSIC), Passeig Marítim de la
                                               Barceloneta, 37-49, CP 08003 Barcelona, Catalunya, Spain.
                                                     2
                                                       Mediterranean Institute for Advanced Studies
                                         (IMEDEA-CSIC/UIB), C/ Miquel Marques 21, CP 07190 Esporles,
                                                                 Balearic Islands, Spain.
                                          3
                                            Faculty of Economics and Business Administration, University of
                                         Santiago de Compostela, Av Burgo das Nacions s/n, 15782 Santiago
                                                            de Compostela, A Coruña, Spain.
                                             4
                                               Campus Do Mar, International Campus of Excellence, Spain.

                                         Running page head: Wide-scale assessment of CES using Graph Theory
                                                                                  Abstract
                                                     Cultural Ecosystem Services (CES) assessment at large scales is crucial
                                                 in marine ecosystems as they reflect key physical and cognitive interactions
                                                 between humans and nature. The analysis of social media data with
                                                 graph theory is a promising approach to provide global information on
                                                 users’ perceptions for different marine ecosystems. Fourteen areas were
                                                 selected to illustrate the use of graph theory on social media data. The
                                                 selected areas, known to protect key recreational, educational and heritage
                                                 attributes of marine ecosystems, were investigated to identify variability
                                                 in users’ preferences. Instagram data (i.e., hashtags associated to photos)
                                                 was extracted for each area allowing an in-depth assessment of the CES
                                                 most appreciated by the users. Hashtags were analysed using network
                                                 centrality measures to identify clusters of words, aspects not normally
                                                 captured by traditional photo content analysis. The emergent properties
                                                 of networks of hashtags were explored to characterise visitors’ preferences
                                                 (e.g., cultural heritage or nature appreciation), activities (e.g., diving or
                                                 hiking), preferred habitats and species (e.g. forest, beach, penguins), and
                                            ∗ © 2020. This manuscript version is made available under the CC-BY-NC-ND 4.0 license

                                         http://creativecommons.org/licenses/by-nc-nd/4.0/
                                            † Corresponding author: Andrés Ospina-Alvarez, email: aospina.co@me.com; address:

                                         Spanish Scientific Research Council, Mediterranean Institute for Advanced Studies (IMEDEA-
                                         CSIC/UIB), C/ Miquel Marques 21, CP 07190 Esporles, Balearic Islands, Spain.

                                                                                      1
Wide-scale assessment of CES using Graph Theory                  de Juan et al. 2020

      feelings (e.g., happiness or place identity). Network analysis on Instagram
      hashtags allowed delineating the users’ discourse around a natural area,
      which provides crucial information for effective management of popular
      natural spaces for people.

Key words: Instagram, Network analysis, Centrality measures, Recreational
services, Marine ecosystems; Coastal users.

Introduction
Marine and coastal areas are extremely important for peoples’ wellbeing and yet,
management plans rarely consider Cultural Ecosystem Services (CES) in their
formulation (Chen et al., 2020; Rodrigues et al., 2017). CES are recognized as a
main pillar in ecosystem services frameworks (Liquete et al., 2013), however, CES
are the most challenging group of ecosystem services to study, principally due
to their intangible and subjective nature (Daniel et al., 2012; Kirchhoff, 2012).
Additionally, research targeted at marine CES has mostly focused on the economic
valuation of recreational activities, tourism, or seascape scenic beauty (Milcu
et al., 2013; Teoh et al., 2019), setting aside the non-material benefits people
obtain from ecosystems that have symbolic, cultural or intellectual significance
(Haines-Young and Potschin, 2010). During the past decade, the understanding
of CES has evolved to acknowledge the importance of the relationship between
people and nature, as CES are the outcome of the interaction between these two
ecosystem components (Chan et al., 2012). Despite the challenges associated
to CES assessment, current management schemes should incorporate the multi-
dimensional CES valuation at scales relevant for management, particularly in
marine and coastal areas where there is high economic and cultural dependency
on marine ecosystems (Russell et al., 2013).
The monitoring of CES at large spatial scales is particularly difficult because,
among others, they often have been based on methods developed for small spatial
scales. Field survey methods have been generally used (Gosal et al., 2019),
including interviews, face-to-face questionnaires and participatory mapping (e.g.,
Klain et al., 2014; Oteros-Rozas et al., 2014; Plieninger et al., 2013; Ruiz-Frau
et al., 2011). These studies generally focus on local scales (Clemente et al.,
2019), whereas management generally needs information at regional scales. In
this context, new methodological approaches are needed to assess the multiple
cultural values provided by marine ecosystems at scales larger than the local
case study. There are several studies that adopt global approaches (Chen et al.,
2020; Costanza et al., 2014), but generally these imply low cost-effectiveness
that is a requirement for widely adopted assessments.
The volume of information uploaded to online social media platforms, like
Instagram or Flickr, can provide an important source of information to assess
peoples’ preferences and values through a cost-effective approach (Clemente et al.,
2019; Retka et al., 2019; Vaz et al., 2019). Social media platforms continuously
store information people upload from any location in the planet. These sites

Preprint submitted to Scientific Reports at November 30 2020                   Page 2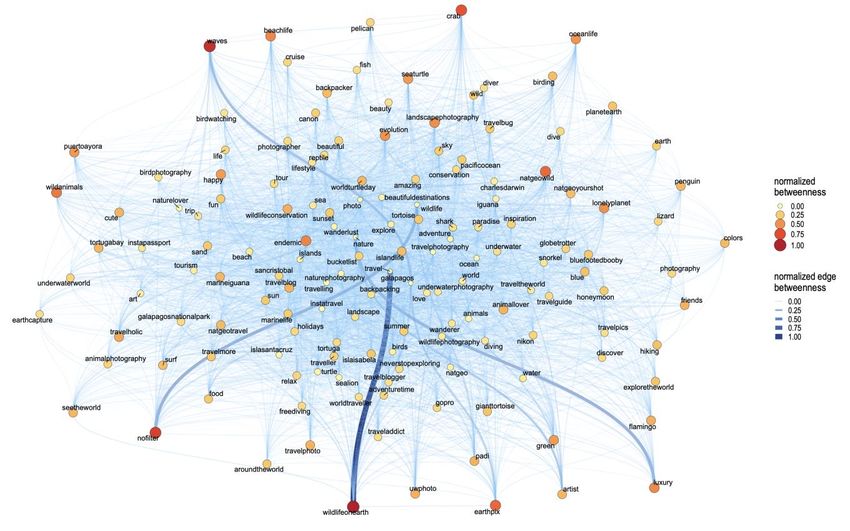
Wide-scale assessment of CES using Graph Theory                de Juan et al. 2020

are used for socializing and communicating, frequently focusing on recreational
activities, including tourism (Figueroa-Alfaro and Tang, 2016). As part of the
information uploaded, people often express their perceptions and feelings about
places (Hale et al., 2019), including natural spaces. In the internet era, there are
many social network platforms with millions of users that are an important source
of big data (Liu et al., 2014). In the quest to avoid the time-consuming nature
of field surveys and to identify alternative methods, there has been an increasing
number of scientific studies that use social media to assess CES (Figueroa-Alfaro
and Tang, 2016; Gosal et al., 2019; Oteros-Rozas et al., 2018). These studies
have generally proved to be comparable to traditional surveys (e.g., Hausmann
et al., 2018).
Social media data allows an indirect assessment of peoples’ perceptions and
preferences. It provides large sample sizes and data is available at global scales.
The predominant approach in social media data analysis generally relies on photo
content assessment (but see Geboers and Van De Wiele, 2020). The context and
content of the photographs is classified into CES categories based on the presence
or absence of specific elements in the photos, such as views of flora and fauna,
historical buildings, or touristic infrastructure and facilities (Ghermandi et al.,
2020). Most works conducted up to date tend to use Flickr as source of data and
analyse the photo content manually (Jeawak et al., 2017) or through automatic
identification (Lee et al., 2019). An advantage associated to the use of Flickr is
the availability of geolocalised photos. The downside of this platform, however,
is a relatively low number of users, its decreasing popularity, and a photo content
strongly dominated by biodiversity and landscape aspects (Oteros-Rozas et
al., 2018), limiting the scope of the CES assessment. Conversely, Instagram
is generally used to post photographs and thoughts in real-time often related
to activities or social recreation, but also to culture and wildlife appreciation
(Ruiz-Frau et al., 2020). Instagram users’ demographics, however, are dominated
by younger generations (Hausmann et al., 2018). An advantage associated to
Instagram is the frequent inclusion of hashtags as part of the photo post. These
hashtags are used as keywords to mark messages or form conversations, and
thus they provide an additional way to connect visual content (i.e., photos) and
semantically related words to a discourse. The user-generated hashtags provide
a great opportunity to analyse the discourse linked to the posted photos and
minimize the subjectivity and low-cost effectiveness associated to photo content
analysis.
Recent developments in the analysis of social media data have applied graph
theory to the analysis of hashtags associated to posts providing a promising
approach for the remote assessment of CES relying on social media data (Ruiz-
Frau et al., 2020). Initial results indicate that the use of this cost-effective
approach reveals, besides the more tangible set of CES such as recreational
activities, a set of intangible CES aspects such as relational values (Ruiz-Frau et
al., 2020), providing a more encompassing view of CES provision. The application
of this approach, however, has been so far limited to the regional scale while it
offers an untapped potential to be applied at a global scale, providing comparative

Preprint submitted to Scientific Reports at November 30 2020                Page 3
Wide-scale assessment of CES using Graph Theory                 de Juan et al. 2020

information on the type of CES contribution that marine and coastal areas make
around the world.
Graph theory, as the mathematical study of the interaction of a system of
connected elements, is a suitable approach for analysing user behaviour in social
networks. It provides a simplified and quantitative view of the multiple factors
involved in the exchange among system elements (Freeman, 1979). A system
of connected elements can be defined as a network, also called a graph. In a
network of keywords posted with the photos, graph theory provides insights into
the system properties and identifies critical nodes with high centrality (i.e., words
connected to many other words) or clusters of well-connected nodes (Maiya and
Berger-Wolf, 2010; Roth and Cointet, 2010; Topirceanu et al., 2018). In this
study, the working hypothesis was that data extracted from online social networks
and analysed by calculating different measures of centrality from graph theory
can be used to understand peoples’ preferences for nature and nature-based
experiences in marine and coastal areas worldwide. The hypothesis was tested
in 14 marine and coastal areas that are expected to provide a wide diversity of
CES and the methodology was applied to determine whether different areas of
the world were delivering different arrays of CES. This approach is expected to
contribute to cost-efficient large-scale assessments of the contribution of marine
and coastal areas to society well-being.

Materials and Methods
Case studies
In order to encompass a wide diversity of marine and coastal ecosystems across
regions, and the potential diversity of CES provided by these areas, 14 marine
and coastal areas were chosen for the study (Table A1). These areas span over
the 12 marine realms established by (Spalding et al., 2007) and are expected
to provide a wide diversity of CES (e.g., recreation, cultural heritage, nature
and wildlife observation) and to be visited by a wide diversity of users. The
areas chosen had to comply with two criteria: 1) the area had to be sufficiently
popular to contain enough data for the analysis; 2) the name of the area had
to be sufficiently characteristic to provide a unique identifier within Instagram
(Table 1). The adoption of these criteria meant that no area in the Artic (marine
realm 1) could be identified with enough social media data. Some of the realms
established by Spalding et al. (2007) are too broad to capture existent variability
across systems (e.g., temperate Northern Atlantic and Mediterranean Sea), when
the authors considered this was the case, more than one study areas were selected
to capture this variability (Fig. 1).

Preprint submitted to Scientific Reports at November 30 2020                 Page 4
Wide-scale assessment of CES using Graph Theory               de Juan et al. 2020

         Table 1: Case study name, location, query and number of down-
         loaded for the study

Case study           Location             Query                        Number of
                                                                       posts
Galapagos            Ecuador              #galapagos                   10,000
Glacier Bay          Alaska               #glacierbayalaska            1,811
Great Barrier        Australia            #greatbarrierreef            9,960
Reef
Isole Egadi          Italy                #isoleegadi                  9,969
Macquarie Island     Australia            #macquarieisland             1,430
Peninsula Valdez     Argentina            #peninsulavaldes             9,971
Easter Island        Chile                #easterisland, #rapanui,     10,000
                                          #isladepascua
Sandwich             Namibia              #sandwichharbour             2,807
Harbour
Skomer               United Kingdom       #skomer                      4,911
Tawharanui           New Zealand          #tawharanui                  6,832
Tayrona              Colombia             #tayrona                     10,000
Togean Island        Indonesia            #togeanisland                9,467
Vamizi               Mozambique           #vamizi                      1,367
Ytrehvaler           Norway               #ytrehvalernasjonalpark      1,019

Social media data
Data collection and analysis were carried out according to the methodology
established in Ruiz-Frau et al. (2020). Instagram posts were downloaded through
the Application Programming Interface (API), with a specific development for
the R language and environment for statistical computing version 3.6.0, released
2019-04-26 (R Development Core Team, 2009). The Instagram API is suitable
for a hashtag-based data extraction and, for each case study, a search query was
executed (Table 1). Query terms were based on the hashtags of the geographical
name of the study areas; therefore, the post download was related to a specific
query, or name of the study area (e.g., Galapagos), with all downloaded posts
including this query. We downloaded 10,000 posts per case study in June 2019.
No specific period was defined. The data download started with the most
recent post and was followed by the previous post until reaching the cut-off (i.e.,
10,000). Some of the case studies had fewer than the established threshold (i.e.,
10,000 posts), in such cases we downloaded all available posts (Table 1). Query
search was limited to English, the most common language amongst tourists; this,
however, might have overlooked posts where the name of the place was in a
different language. For most marine areas, this was considered irrelevant as the
name of the place is not translated to other languages (e.g., Tayrona, Vamizi,
Skomer). In some of the cases the name of the place could appear in a variety

Preprint submitted to Scientific Reports at November 30 2020               Page 5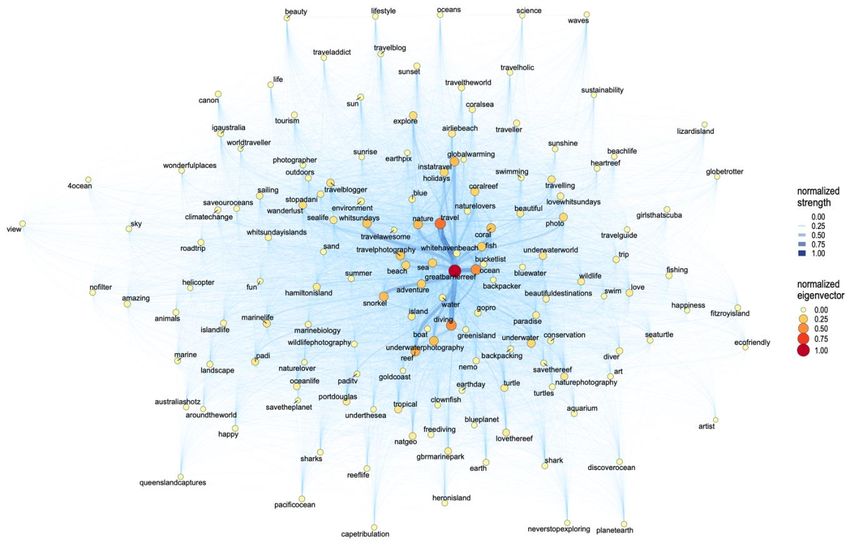
Wide-scale assessment of CES using Graph Theory          de Juan et al. 2020

Figure 1: The fourteen case studies selected across the twelve marine realms
proposed by Spalding et al (2007)

Preprint submitted to Scientific Reports at November 30 2020         Page 6
Wide-scale assessment of CES using Graph Theory                de Juan et al. 2020

of languages (e.g., Great Barrier Reef), however the use of non-English place
hashtags as queries generally retrieved a significantly lower number of posts (e.g.
Gran Barrera de Coral in Spanish with 1,900 posts, or Grand Barrière de Corail
in French with 14 posts, while Great Barrier Reef had over 10,000 posts). In
the specific case of Easter Island, we observed that the use of three particular
queries was linked to a high number of posts: Easter Island and the local name
Rapanui had over 10,000 posts each, and Isla de Pascua in Spanish had 8,700
posts. In this case, three separate posts’ downloads were performed, and data
were merged for subsequent analysis.
Downloaded posts for each case study were stored locally and datasets were
filtered and cleaned in order to retain only relevant information for further anal-
ysis (Di Minin et al., 2018; Varol et al., 2017). Posts often contain non-relevant
information as social media platforms are frequently used as marketing and
advertisement tools to reach a wider public and often bots (automated data
generating algorithms and advertisements) are used to created large volumes of
automated posts. In our case, irrelevant posts, mostly related to advertisement
(e.g., posts related with a trading mark named Galapagos or Rapanui), were
discarded from the analysis. Discarded photos were done through excluding posts
with a specific hashtag (e.g., #chocolate, frequently linked with #rapanui due to
a trademark) or a specific user (i.e., those users identified as posting marketing).
Dataset cleaning also consisted in merging similar words (e.g., #travelgram,
#instatravel, #igtravel) and misspellings (e.g., #travel, #travell). Highly fre-
quent non-English words were translated to English (e.g., #statue, #steinfigure,
#estatua; for Easter Island statue in different languages) to homogenise the
network language and avoid numerous duplicates. However, in some networks
with a prevalence of non-English language (e.g., Ytrehvaler in Norwegian) words
were not translated to English to capture users’ characteristics.

Graph theory
The analysis of networks using graph theory can be described as the analysis of
existing relationships between the different elements contained in a network. The
term vertex is used to describe the elements in a network, while the term edge
is used to refer to the connections between the different vertices in a network.
In our case, vertices are represented by hashtags, while edges illustrate the
connections between hashtags (e.g., the hashtags included in the same posts and
the frequency of those connections). To assess relationships between hashtags
and identify emerging themes within the networks, we used and expanded the
centrality measures and community algorithms established in Ruiz-Frau et al.
(2020).
The concept of centrality is a commonly used metric in the analysis of networks.
The identification of important, or central, vertices in a network is a key aspect
in the definition and description of networks (Bodin et al., 2006). However,
there are multiple interpretations of what makes a vertex important and there
are therefore many measures of centrality (Freeman, 1979). In this work, we

Preprint submitted to Scientific Reports at November 30 2020                Page 7
Wide-scale assessment of CES using Graph Theory                de Juan et al. 2020

will focus on the use of betweenness and eigenvector centrality to illustrate and
interpret the structure of the social networks.
Eigenvector centrality measure (Bonacich, 2007) takes into consideration not
only how many connections a vertex has, but also the centrality of the vertices
that it is connected to. Eigenvector centrality, hereafter eigenvector, ranks higher
those vertices that are connected to important neighbours, i.e., other vertices
that are connected to many other vertices. It is a measure of the influence of a
vertex in a network. In our study context, hashtags with high eigenvector values
are high frequency hashtags that in turn are connected to other high frequency
hashtags, and so on. Therefore, this measure allows identifying those hashtags
that are frequently posted with other hashtags also frequently posted, and it can
be interpreted as the pairs or groups of features more frequently related to the
case study by the users.
Betweenness centrality (Freeman, 1979) is a measure of the influence of a
vertex over the flow of information between every pair of vertices under the
assumption that information primarily flows over the shortest paths between
them. Betweenness centrality indicates nodes that have a high probability of
having routes that connect them to other nodes in the network. Alternatively,
it indicates nodes in an intermediate position between groups of very well-
connected neighbouring nodes. Nodes with high betweenness centralities have
been termed bottlenecks or bridges and they prevent the fragmentation of the
network. Similarly, edge betweenness centrality is defined as the number of
the shortest paths that go through an edge in a graph or network (Girvan
and Newman, 2002). Each edge in the network can be associated with an
edge betweenness centrality value. An edge with a high edge betweenness
centrality score represents a bridge-like connector between two parts of a network,
the removal of which may affect the communication between many pairs of
nodes through the shortest paths between them. In our context, betweenness
centrality (hereafter betweenness) and edge betweenness centrality (hereafter
edge betweenness) provide information on hashtags and links between hashtags
that are essential to structure the network in sub-communities; the removal
of those links would fragment the network and disconnect the hashtags that
have higher betweenness. High betweenness hashtags are those that appear in
a large number of posts and represent concepts that people often identify as
ideal descriptors of a network. Edge betweenness evidences those edges that
connect the most frequent hashtags with other less frequent hashtags. Therefore,
they might show the parallel or additional discourse to the main discourse of
the users, allowing to identify less frequent activities or perceptions but equally
important to understand the network as a whole.

Data analysis
To illustrate the most relevant information contained as part of the 10,000 posts
for each of the 14 areas, we selected the 150 most frequent hashtags from each
dataset in order to create the network graph. The first 150 hashtags (frequency

Preprint submitted to Scientific Reports at November 30 2020                Page 8
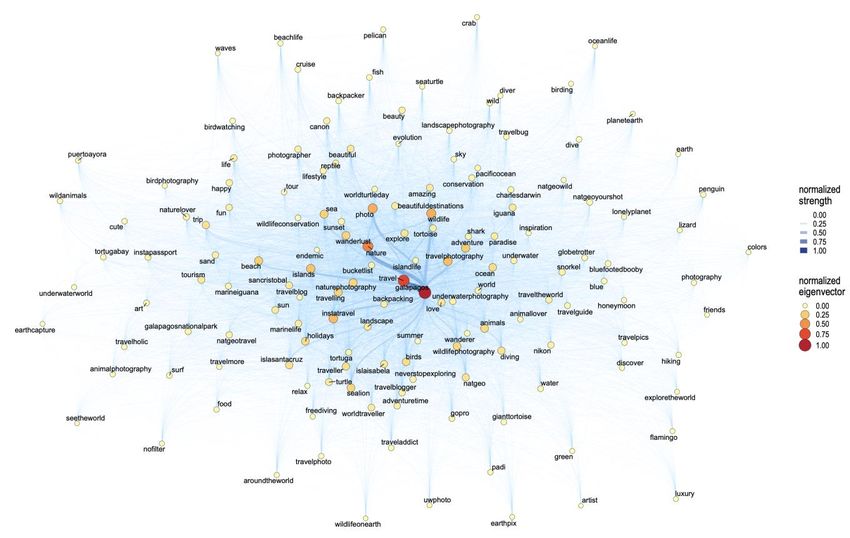
Wide-scale assessment of CES using Graph Theory                 de Juan et al. 2020

> 1.5% when 10,000 posts are retrieved) had a probability of more than 90% of
occurring with any other of the first 150 hashtags in the same post. Therefore,
this criterion was used to create networks with great cohesion and connectedness,
representing a dominant discourse in relation to the area in question. Network
graphs were delineated using eigenvector, betweenness and edge betweenness as
centrality measures. These metrics were selected as they provided a visualisation
of the central hashtags in the social media discourse, as well as peripherical
hashtags that where nevertheless often related with these central hashtags;
therefore, these provide information on the periphery of the dominant discourse.
In order to find emerging patterns within the 14 case study networks, hashtags
were assigned to communities through the use of Fast-Greedy community algo-
rithm (Ruiz-Frau et al., 2020). Fast-Greedy algorithm makes the best choice
at each small step in the hope that each of these small steps will lead to a
globally optimal solution (Newman, 2004). Relevant hashtag communities based
on Fast-Greedy algorithm were assessed to provide a detailed assessment of the
type of CES provided by each of the case studies.
In order to visualise potential similarities in the social media discourse across the
14 case studies, all the data was merged, and the 1400 most frequent hashtags
pairs were retained for analysis in a single network graph. Similar to what was
previously described for the individual networks, these 1400 pairs of hashtags
accounted over 90% of the linkages between hashtags, representing the dominant
discourse on CES across the 14 areas. Eigenvector centrality was used as the
measure of vertex influence in the network and connections were represented
with a backbone layout (Brandes and Wagner, 2004). This layout has proven
effective to illustrate networks with most vertices in a central position that result
in high overlap in large networks (Nocaj et al., 2015).
To conduct the analysis, we used the open source graphics manipulation soft-
ware igraph (Csardi and Nepusz, 2006) to obtain the centrality measures and
communities aggregations. Graphics and figures were generated using the visu-
alization software ggraph and ggtree. All of the above software can be used as
extension packages of the R language and environment for statistical computing
(R Development Core Team, 2009) freely available online.

Results
Network centrality measures
Results indicated that network graphs captured information on distinct types of
CES, for example those based on wildlife and nature; heritage; or beach tourism.
In areas such as Galapagos, popular hashtags were nature, wildlife, photography,
travel and adventure, evidencing a preference for wildlife and nature based CES.
In this area, betweenness evidenced the connections between the most frequent
hashtags group with other hashtags like waves, crab, endemic, evolution and
happy, and provided information on the discourse of Galapagos’ visitors (Fig. 2).

Preprint submitted to Scientific Reports at November 30 2020                 Page 9
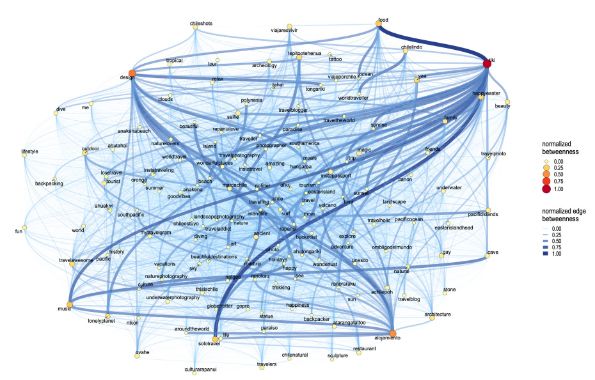
Wide-scale assessment of CES using Graph Theory                de Juan et al. 2020

Other areas providing wildlife and nature based CES were Skomer nature reserve,
characterised by the hashtags birds (particularly Puffin), nature and wildlife
photography, and Península Valdés, characterized by many locality names and
by fauna, with the hashtags’ wildlife, whales and nature holding high eigenvector
and funnelling most connections to other hashtags and providing a full picture of
the post (e.g., wind, hiking, relax). Three networks, Sandwich Harbour, Glacier
Bay and Macquarie Island also included popular hashtags related with nature,
wildlife and photography; however, most hashtags had low betweenness and edge
betweenness limiting the diversity of the posts (all network graphs included in
Appendix, Fig. A1).
Regarding cultural heritage, Easter Island was characterised by popular hashtags
related with Easter Island stone statues and with travel, and edge betweenness
evidenced a diversity of peripherical nodes that describe other cultural elements,
like design, music and food. Other areas reflected cultural identity by the frequent
post of local names (e.g., Ytrehvaler), of words related with the country’s identity
(e.g., Isole Egadi) and positive feelings about this identity (e.g., Tawharanui). In
Tayrona National Park network, the full discourse identified cultural identity
like Kogui (indigenous village) linked with the popular posts. However, the most
frequent hashtags in Tayrona network, and also in Tawharanui and Isole Egadi,
were related with beach, nature and summer. In some of these networks, like
Isole Egadi and Ytrehvaler, locality names are frequently posted, allowing to
identify connections between places and activities, wildlife or natural structures.
A group of areas were appreciated by their underwater ecosystems. For Great
Barrier Reef, popular hashtags were related with the coral reef: ocean, diving,
underwater photography, travel, nature, coral and reef ; whereas betweenness
highlighted a set of hashtags related with conservation: science, sustainability,
save the reef, 4 ocean (Fig. 3). In Toguean Island network, the frequent hashtags
beach, wonderful and charming are connected to peripherical hashtags related
with the sea (e.g., sea life, diving). In Vamizi, popular hashtags were related
with tourism, private island, travel, luxury travel, and were connected to less
frequent hashtags linked to the sea, including recreational fisheries.

Network communities
The division of hashtags in communities allows for a more detailed exploration of
the words included in the 150 most frequent hashtags selection, independently of
their centrality measures, and allowed a categorisation of hashtags within CES
classes in each area (Table 2). Hashtags were grouped in 3 to 5 communities,
with some communities relatively constant across case studies, e.g., aesthetics,
wildlife and nature appreciation (Fig. 4, Fig. A2).
In some of the areas, the communities were diverse in hashtag composition, for
example, in Galapagos, wildlife (and related words) was distinctive of several
communities, but other communities were characterised by different concepts:
beach, holidays, happiness, snorkelling and diving. In Easter Island network the

Preprint submitted to Scientific Reports at November 30 2020               Page 10
Wide-scale assessment of CES using Graph Theory              de Juan et al. 2020

         A)

         B)

Figure 2: Example of network graphs in Galapagos case study. In plot A)
vertex size represents the Eigenvector centrality and edges represent strength. In
plot B) vertex size represents Betweenness centrality and edges represent Edge
betweenness.

Preprint submitted to Scientific Reports at November 30 2020             Page 11
Wide-scale assessment of CES using Graph Theory de Juan et al. 2020
A)
B)
Figure 3: Example of network graphs in Great Barrier Reef case study. In plot
A) vertex size represents the Eigenvector centrality and edges represent strength.
In plot B) vertex size represents Betweenness centrality and edges represent
Edge betweenness.
Preprint submitted to Scientific Reports at November 30 2020 Page 12Wide-scale assessment of CES using Graph Theory de Juan et al. 2020
hashtags related with the stone statues and cultural heritage characterise one
community, while the other communities include a diversity of hashtags classified
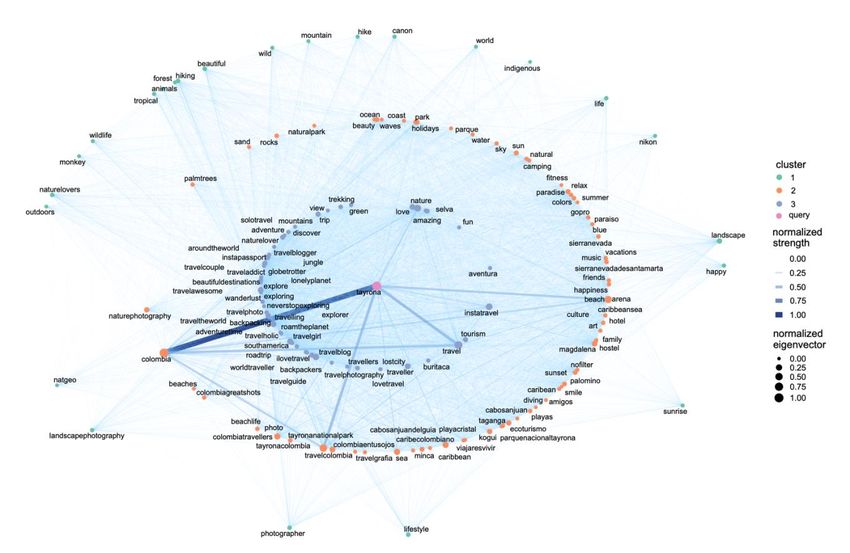
under adventure, nature, underwater recreational activities. Tayrona (Fig. 4) is
also a diverse network with one community characterised by hashtags like beach,
summer, happiness (wellbeing), but other communities containing a diversity
of hashtags like forest, hiking, indigenous and wildlife (classified in recreational,
cultural heritage, nature and aesthetics; Table 2).
In some areas, the communities were not so diverse, but provided additional
information on the posts. For example, in MacQuarie Island the communities
highlighted iconic fauna, including several penguin species, and biodiversity
conservation. In several areas, network communities informed of the iconic fauna
and specific places: puffins and other bird species in Skomer; southern right
whale, sealions and penguins in Península Valdés; glaciers and mountains in
Glacier bay (Fig. 4); desert and dunes in Sandwich harbour. Finally, Ytrehvaler
is a network characterised by many local names (in Norwegian), evidencing a
national tourism, and hashtags related with scenery.
Table 2: Cultural Ecosystem Services’ types depicted from the
community analysis (Fast Greedy algorithm). The order of the CES
class does not imply a priority rank.
CES 1 CES 2 CES 3 CES 4 CES 5
Galapagos Nature Recreational Other Underwater Aesthetic
and (beach) (travel) wildlife and
wildlife and recre- wellbeing
appreciation ational
(underwater)
Glacier Aesthetic Aesthetic Recreational Other
Bay and nature (hiking) (National
appreciation Park and
Glaciers)
GBR Underwater Other Aesthetic
wildlife (travel) and nature
and recre- appreciation
ational
(underwater)
Isole Egadi Recreational Aesthetic Cultural Other
(water and identity (travel)
activities) wellbeing
Macquarie Nature Wildlife Recreational Wildlife
Island and and and (bird
wildlife conservation wildlife watching)
appreciation (iconic
fauna)
Preprint submitted to Scientific Reports at November 30 2020 Page 13Wide-scale assessment of CES using Graph Theory de Juan et al. 2020
Table 2: Cultural Ecosystem Services’ types depicted from the
community analysis (Fast Greedy algorithm). The order of the CES
class does not imply a priority rank.
Peninsula Wildlife Wildlife Aesthetics Wildlife
Valdez (sea life) conservation and (iconic
and recreational fauna)
recreation
Easter Cultural Other Nature, Recreational
Island heritage (adventure aesthetics (underwater)
and travel) and
wellbeing
Sandwich Aesthetics Wildlife, Wellbeing
Harbour aesthetics and recre-
and ational
recreational (safari)
Skomer Aesthetic Wildlife Wildlife
and (birds) (birds)
recreation watching
(hiking)
Tawharanui Recreational Nature, Cultural Wildlife
(beach) aesthetic identity conservation
and
wellbeing
Tayrona Wellbeing Recreational Nature
and (hiking) and
aesthetics and aesthetics
cultural
heritage
Togean Other Underwater Aesthetics,
Island (travel) wildlife wildlife
and recre- (underwa-
ational ter) and
(underwater) recre-
ational
(underwater)
Vamizi Nature, Recreational Aesthetics Recreational
wildlife (underwa- and (fishing)
and ter) and wellbeing
conservation other
(luxury
tourism)
Preprint submitted to Scientific Reports at November 30 2020 Page 14Wide-scale assessment of CES using Graph Theory de Juan et al. 2020
Table 2: Cultural Ecosystem Services’ types depicted from the
community analysis (Fast Greedy algorithm). The order of the CES
class does not imply a priority rank.
Ytrehvaler Nature Nature Recreational Nature
and and recre- (hiking) and
cultural ational aesthetics
identity (hiking and
kayak)
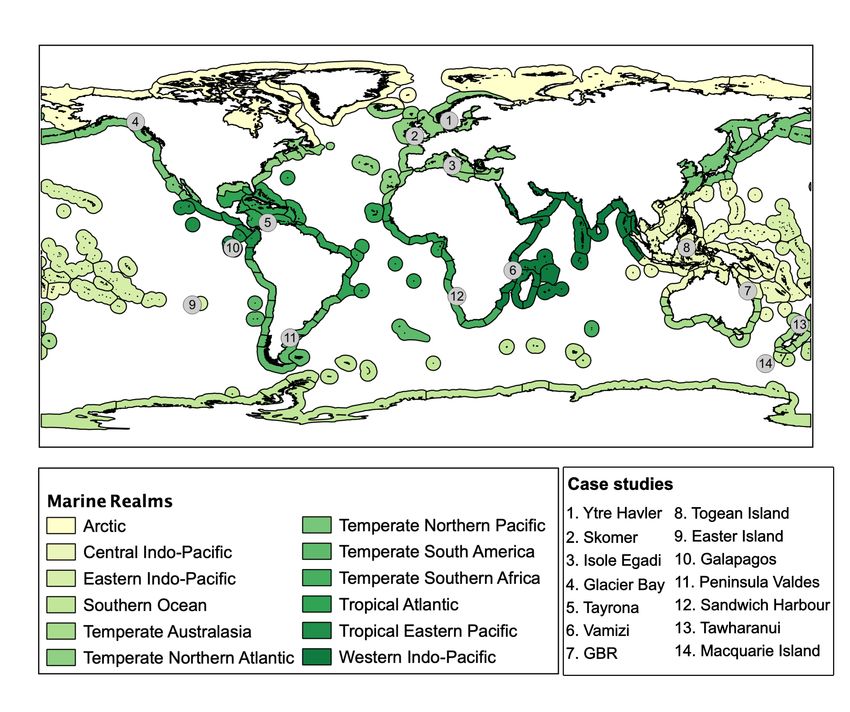
Merged network of the 14 case studies
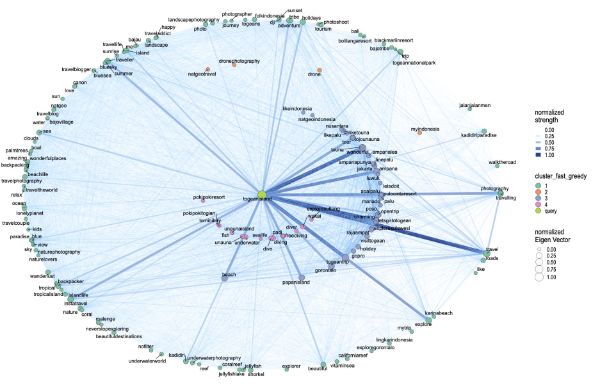
The network that integrates the 14 areas, highlighted several hashtags that act
as bridges between communities of hashtags (Fig. 5). Nature, travel, photo
and travel photography are key to structure the global network. However, the
integrated network evidenced other hashtags with lower eigenvector that also
connect smaller groups. The hashtags sunset and island connect the subgroups
from Easter Island, Isole Egadi and Vamizi; Tayrona is connected to this group
thought travelling and to the central vertex through travel photography.
From this hashtag (travel photography) diverges another branch that connects
7 areas through adventure; a small group of hashtags deriving from this node
represent Sandwich harbour and Vamizi, connected through Africa. The hashtag
Ocean, connected to adventure, relates Great Barrier Reef with Tawharanui, and
to wanderlust (a German expression for the desire to explore the world) that
connects Península Valdés, Skomer and Macquairie Island. These three areas
are also connected through the central hashtag travel photography, and Skomer
and Macquairie Island through wildlife photography. The hashtag adventure is
also connected to a group of hashtags from Galapagos that also derive to the
high eigenvector hashtag nature.
The hashtag nature is key to include the fragile sub-network Ytrehvaler, and also
derives to other high eigenvector hashtag, travel, that in turn, connects to the
small sub-network from Glacier bay. Travel is connected to many less relevant
hashtags that are common to many of the areas: friends, tourist, happiness, and
derives to photo, another central hashtag. Photo connects to paradise, that is
key to integrate Toguean Island, a few hashtags from Tayrona related with the
Caribbean and beach, and a group of hashtags from Peninsula Valdez related
with whale watching. Some other small hashtags, that are connected to high
eigenvector hashtags but are not included in any particular area are shared by
many of the areas, e.g., sun, relax, landscape photography, nature lovers, sunset,
sky.
Preprint submitted to Scientific Reports at November 30 2020 Page 15Wide-scale assessment of CES using Graph Theory de Juan et al. 2020
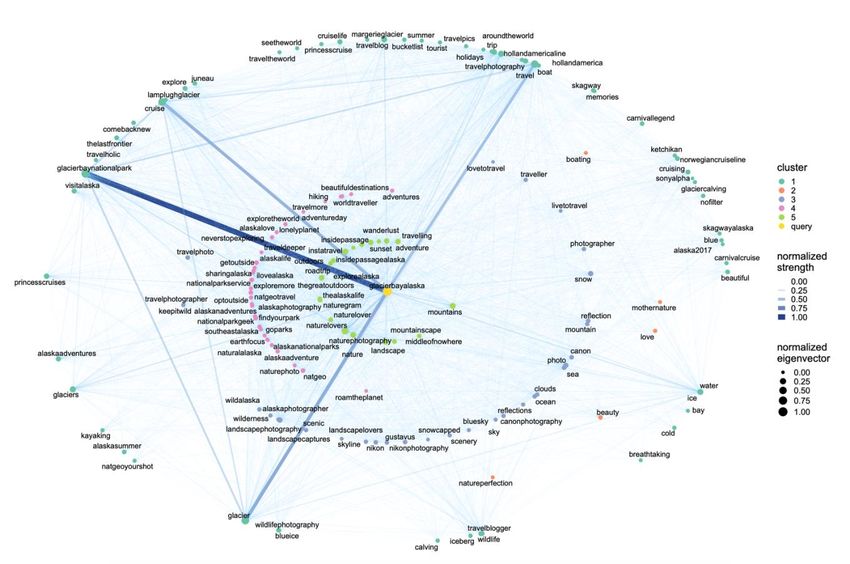
A)
B)
Figure 4: Example of Fast-Greedy community algorithm for the case studies
Glacier Bay (A) and Tayrona (B).
Preprint submitted to Scientific Reports at November 30 2020 Page 16Wide-scale assessment of CES using Graph Theory
Preprint submitted to Scientific Reports at November 30 2020
de Juan et al. 2020
Page 17
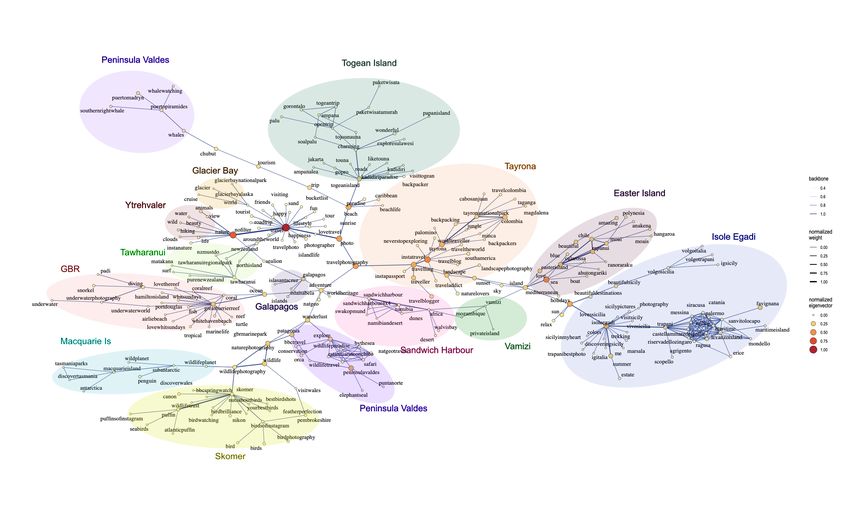
Figure 5: Global network graph including the fourteen case studies where the vertex size represents the Eigenvector centrality
and edges represent strength. The coloured clusters arrange the case studies to facilitate the visual identification of related areasWide-scale assessment of CES using Graph Theory de Juan et al. 2020 Discussion Social media provides a powerful source of information to monitor visitors’ preferences and perceptions in marine and coastal areas globally. In our study, the analysis of Instagram data confirmed these expectations, with underwater activities and underwater life appreciation prioritized by visitors in iconic diving destinations (e.g., Great Barrier Reef or Toguean Island), whereas case studies known to be small natural reserves for wildlife watching were confirmed to be mainly visited for their iconic fauna (e.g., Península Valdés) or protected species (e.g., Skomer Island). However, this study differs from previous studies in the methodology adopted to analyse data stored in social media platforms. The analysis of photo content is known to be time consuming and subjected to the researcher’s interpretation (Ruiz-Frau et al., 2020). Conversely, the text linked to each photo illustrates users’ perceptions, preferences, feelings, and emotions. The analysis of users’ posts with Graph Theory allowed the identification of emergent discourse patterns in Instagram. It identified the most frequent words related with a specific area (e.g., nature, wildlife and photography in Galapagos), and other less frequent words connected to the principal ones, delineating a discourse in each case study, for example information on specific knowledge, like endemic and evolution, and also feelings, happy, related with wildlife and nature in Galapagos. The primary and secondary information provided by the network analysis is of high value for conservationists and managers, as it delineates visitors profile and preferences. Importantly, our approach allowed to gather this individualised information remotely from a wide variety of marine and coastal case studies globally. It has been acknowledged that the use of information from social media platforms has an inherent bias associated to both the type of user and the type of content posted on the platform. Hausmann et al. (2018) observed that while most of the pictures posted on Flickr focused on biodiversity, Instagram, additionally, was popular for sharing pictures about activities and people. On the other hand, Ruiz-Frau et al. (2020) observed that Twitter posts reflected social awareness and discussions around current global concerns such as climate change and youth movements. Therefore, different social media platforms may be used by different groups of visitors and, aiming to maximize the representation of the wider society, we considered Instagram to be a good candidate for a global assessment of CES covering a wide diversity of natural spaces. Instagram provides information on what calls the attention of visitors, but also on activities and feelings. For example, many users on Instagram linked natural spaces with conservation (e.g., Great Barrier Reef), nature excursions (e.g., Glacier Bay), bird watching (e.g., Skomer), views of natural fauna (e.g., Península Valdés), but also, and not least, the scenic beauty (e.g., Sandwich harbour), the relaxation and happiness provided by open spaces (e.g., Galapagos), or some luxury accommodations within national parks as wellness spaces (e.g., Vamizi). The main activities reported in each case study were generally related with the dominant habitat, e.g., diving in Great Barrier Reef or Toguean Island, with prevalence of coral reefs; hiking in Glacier Bay or Preprint submitted to Scientific Reports at November 30 2020 Page 18
Wide-scale assessment of CES using Graph Theory                de Juan et al. 2020

Tayrona, characterized by forests and mountains; beach recreation in Tawharanui
or Isole Egadi, characterized by sandy beaches. Nevertheless, the posts’ discourse
in each area is markedly defined by the visitor profile, and access to the area. For
example, Vamizi is characterized by luxury and international tourism that visit
the area for the opportunity to enjoy the underwater life, recreational fishing
and beach. Other areas like Skomer and Ytrehvaler are mainly visited by locals
that enjoy the wildlife and nature of the place. This implies the CES enjoyed
by visitors are highly conditioned by its logistical accessibility, with remote
places like Macquarie Island or Galapagos visited by international tourists that
travel (travel, being one of the most common hashtags) to these areas to find
adventure, recreation, or scenery, amongst others. More accessible areas (i.e.,
those easily accessible from large cities), like Tawharanui, Ytrehvaler or Isole
Egadi, appear to be predominantly visited by locals in search of the relaxation of
the beach, sighting of emblematic local fauna, or nature recreation. The merged
network evidenced that central hashtags to all areas were nature, travel, photo,
however, less popular hashtags appear key to connect smaller groups of areas and
were related with general concepts posted in these areas and not with principal
activities or focus. For example, sunset and island connected Easter Island, Isole
Egadi and Vamizi, wanderlust (a German expression for the desire to explore
the world) connects Península Valdés, Skomer and Macquairie Island, paradise
connects Toguean Island and Tayrona, ocean connects Great Barrier Reef and
Tawharanui. These results imply that the perception of visitants to the areas
is not exclusively conditioned by the main activity or ecosystem type, but by
higher level concepts like paradise or wanderlust.
What becomes evident from this global assessment is that an area does not need to
be an iconic destination to provide essential services to society. Galapagos, Great
Barrier Reef or Easter Island provide essential services like nature appreciation,
wildlife watching or cultural identity, however, such services have also been
identified in less iconic areas often visited by local tourists like Skomer Island,
Tawharanui and Ytrehvaler. Similarly, wellbeing related with relax and happiness
is recorded in remote and iconic areas like Galapagos, but also in quite different
places such as Vamizi, Tawharanui or Isole Egadi. The frequent post of the word
happiness (and similar words) denotes the importance of nature’s contribution
to people’s wellbeing, as emphasised by Russell et al. (2013), Pascual et al.
(2017) and Díaz et al. (2018) that stated that the benefits arising from human
connections with nature include sense of place, identity, mental health and sense
of belonging. These benefits were independent of its location, ecosystem or main
activity provided. A series of CES bundles could be identified in each case study,
evidencing areas with high diversity of benefits and perceptions, whereas other
areas were relatively homogenous in users’ activities and perceptions. Frequent
CES groups were related with aesthetics and wildlife and nature appreciation,
which is expected as information is obtained from a photography-based social
media platform. However, the classification of the popular hashtags in CES types,
despite providing standardised information that allows the comparison with other
studies, limits the information provided by the networks. The analysis of social

Preprint submitted to Scientific Reports at November 30 2020               Page 19
Wide-scale assessment of CES using Graph Theory                de Juan et al. 2020

media data with Graph Theory allowed identification of users’ prioritization (e.g.,
landscape, heritage, wildlife), but also activities (e.g., diving, hiking, relaxing),
preferred habitats/species (e.g. forest, beach, penguins), and feelings (e.g.,
happiness, beach lifestyle, place identity). Network analysis allowed moving
beyond the state of the art by mere hashtag frequency to the exploration of
inter-relations between hashtags, delineating the users’ discourse. For example,
animal species connected to local names provides information on places for
wildlife watching, e.g., puffins in Skomer Island – place, or penguin species
in MacQuarie Island. Hashtags also evidenced environmental awareness, e.g.,
conservation in Macquarie Island or climate change in Great Barrier Reef, which
should be considered key to promote transformative changes for policy makers
(Hughes et al., 2018). Therefore, relevant words like nature watching can be
linked to a place or to a species name, conservation can be linked to a place or
ecosystem component, and so on.
The methodological approach developed in Ruiz-Frau et al. (2020) and used
in this work can become an important tool in the assessment of CES, a key
ecosystem services’ category that is generally poorly addressed in management
and conservation plans (Chan et al., 2016; IPBES, 2018). However, the use of
this methodology is not exempt of challenges. Results showed that a manageable
sample of posts can provide valuable information about the CES in a natural
area. Nevertheless, a sufficient volume of posts might not be available for
particular areas. In addition, the application of this methodology is restricted
to those areas with a unique name to be used as a query in order to avoid
downloading information from other areas which might have the same name.
In the present study, we initially explored areas such as Table Mountain in
South Africa or Banc d’Arguin in Mauritania but were finally discarded as the
query downloaded many unrelated posts. When using social media data as a
proxy for CES there is an inevitable bias towards aesthetic values (Calcagni
et al., 2019) and, in the particular case of Instagram, a strong dominance of
content related with social recreation. Ultimately, photographs tend to express
pleasant and beautiful features (Yoshimura and Hiura, 2017) and Instagram is
not an exception as in most case studies only positive feelings were reported,
with few exceptions where conservation awareness was identified in the social
media discourse. Representativeness can also be a challenge (Guerrero et al.,
2016; Tenerelli et al., 2016), and Instagram is mostly representing the younger
generations (Abbott et al., 2013). Perceptions from people that do not post
on Instagram, remarkedly from older generations, people without or limited
access to technology or people from countries where Instagram is not sufficiently
dominant are not adequately represented in our approach. Nationality is also
relevant, as CES identified by local visitors can differ from international tourists
(Clemente et al., 2019). This can be partially solved by using words in different
languages as queries, like for Easter Island (e.g., Rapanui, Isla de Pascua and
Easter Island), or by including words in different languages in the network,
like in the Norwegian reserve of Ytrehvaler. However, social media platforms
are sometimes restricted in certain countries, for example Instagram is not

Preprint submitted to Scientific Reports at November 30 2020                Page 20
Wide-scale assessment of CES using Graph Theory                  de Juan et al. 2020

available in China, or Russian Federation and eastern EU dominant social
network is Vkontakt. This might imply an important bias in the nationality
of tourists encompassed in the analysis. Despite these limitations, our study
approach provides many advantages, including 1) cost and effort effectiveness,
2) minimization of researchers’ subjectivity, 3) remote collection of information
that allows large scale studies. The assessment of visitors’ perceptions in natural
spaces is generally conducted during peak visitation season and restricted to
frequently visited locations (Gosal et al., 2019), while the remote collection of
social media data can encompass any temporal dimension, and, in principle, it
covers visitors to all locations within the natural areas. The variability in visitors’
preferences can assist managers and policy makers design tailored strategies to
promote CES conservation for visitors’ enjoyment, which is of high relevance
when destination sites are often ecologically or culturally fragile (Balmford et
al., 2004; Ghermandi et al., 2020). The continuous low cost-effective monitoring
of social media can allow a better understanding of spatial-temporal changes
in visitor preferences (Hausmann et al., 2016), and this approach can now
materialise with the prevalence of smartphones and the posting of experiences in
social media facilitating the remote access to large scale information on peoples’
perceptions and use of natural spaces.

Conclusions
It is recognised that effective marine and coastal conservation requires a large-
scale approach and our novel approach has allowed us to collect data on CES on a
wide diversity of marine and coastal areas globally. The emergent properties of
networks of hashtags were explored to characterise visitors’ preferences (e.g., cul-
tural heritage, wildlife and nature appreciation), but also activities (e.g., diving,
hiking, relaxing), preferred habitats or species (e.g. forest, beach, penguins), and
feelings (e.g., happiness, beach lifestyle, place identity). Our approach allowed
to identify places valued for their cultural heritage (e.g., stone statues in Easter
Island status), but also for their iconic species (e.g., puffins in Skomer island) or
natural monuments (e.g., sand dunes in Sandwich harbour), and sense of place
and identity (e.g., Isole Egadi and Tawharanui). Moreover, the frequent post of
the word happiness represents the importance of nature’s contribution to people.
Cultural interactions between humans and nature are fundamental, including
cultural heritage, the iconic status of certain species or the contributions these
make to human well-being through a sense of place or place identity. The novel
approach introduced here allow to capture these intangible benefits we obtain
from nature in a cost-effective but holistic way, for an effective management
of natural areas, by promoting the integration of CES into decision making by
identifying CES hotspots.

Preprint submitted to Scientific Reports at November 30 2020                 Page 21
Wide-scale assessment of CES using Graph Theory                           de Juan et al. 2020

Acknowledgements
This work is a product of ECOMAR research network (Evaluation and monitoring
of marine ecosystem services in Iberoamerica; project number 417RT0528, funded
by CYTED). Three co-authors were funded by H2020-Marie Skłodowska-Curie
Action during the conduction of this work: SdJ, funded by MSCA-IF-2016
(ref. 743545); AOA, funded by MSCA-IF-2016 (ref. 746361); ARF, funded by
MSCA-IF-2014 (ref. 655475).

References
Abbott, W., Donaghey, J., Hare, J., Hopkins, P., 2013. An Instagram is worth a thousand words: an
industry panel and audience Q&A. Library Hi Tech News 30, 1–6. doi:10.1108/LHTN-08-2013-0047

Balmford, A., Gravestock, P., Hockley, N., McClean, C.J., Roberts, C.M., 2004. The worldwide
costs of marine protected areas. P Natl Acad Sci USA 101, 9694–9697.
Bodin, Ö., Crona, B., Ernstson, H., 2006. Social Networks in Natural Resource Management: What
Is There to Learn from a Structural Perspective? Ecol Soc 11, resp2. doi:10.5751/ES-01808-1102r02
Bonacich, P., 2007. Some unique properties of eigenvector centrality. Social Networks 29, 555–564.
doi:10.1016/j.socnet.2007.04.002

Brandes, U., Wagner, D., 2004. Analysis and Visualization of Social Networks, in: Untangling
the Hairballs of Multi-Centered, Small-World Online Social Media Networks. Springer, Berlin,
Heidelberg, Berlin, Heidelberg, pp. 321–340. doi:10.1007/978-3-642-18638-7_15

Calcagni, F., Maia, A.T.A., Connolly, J.J.T., Langemeyer, J., 2019. Digital co-construction of
relational values: understanding the role of social media for sustainability. Sustain Sci 14, 1309–
1321. doi:10.1007/s11625-019-00672-1

Chan, K.M.A., Balvanera, P., Benessaiah, K., Chapman, M., Díaz, S., Gómez-Baggethun, E., Gould,
R., Hannahs, N., Jax, K., Klain, S., Luck, G.W., Martín-López, B., Muraca, B., Norton, B., Ott,
K., Pascual, U., Satterfield, T., Tadaki, M., Taggart, J., Turner, N., 2016. Opinion: Why protect
nature? Rethinking values and the environment 113, 1462–1465. doi:10.1073/pnas.1525002113

Chan, K.M.A., Satterfield, T., Goldstein, J., 2012. Rethinking ecosystem services to better address
and navigate cultural values. Ecol Econ 74, 8–18. doi:10.1016/j.ecolecon.2011.11.011

Chen, W., Van Assche, K.A.M., Hynes, S., Bekkby, T., Christie, H.C., Gundersen, H., 2020. Ecosys-
tem accounting’s potential to support coastal and marine governance. Mar Policy 112, 103758.
doi:10.1016/j.marpol.2019.103758

Clemente, P., Calvache, M., Antunes, P., Santos, R., Cerdeira, J.O., Martins, M.J., 2019. Combining
social media photographs and species distribution models to map cultural ecosystem services: The
case of a Natural Park in Portugal. Ecol. Ind. 96, 59–68.

Costanza, R., de Groot, R., Sutton, P., van der Ploeg, S., Anderson, S.J., Kubiszewski, I., Farber,
S., Turner, R.K., 2014. Changes in the global value of ecosystem services. Global Environ Chang
26, 152–158. doi:10.1016/j.gloenvcha.2014.04.002

Csardi, G., Nepusz, T., 2006. The igraph software package for complex network research. Inter-
journal Complex Sy, 1695.
Daniel, T.C., Muhar, A., Arnberger, A., Aznar, O., Boyd, J.W., Chan, K.M.A., Costanza, R.,
Elmqvist, T., Flint, C.G., Gobster, P.H., Grêt-Regamey, A., Lave, R., Muhar, S., Penker, M., Ribe,
R.G., Schauppenlehner, T., Sikor, T., Soloviy, I., Spierenburg, M., Taczanowska, K., Tam, J., Dunk,
von der, A., 2012. Contributions of cultural services to the ecosystem services agenda. P Natl Acad
Sci USA 109, 8812–8819. doi:10.1073/pnas.1114773109

Di Minin, E., Fink, C., Tenkanen, H., Hiippala, T., 2018. Machine learning for tracking illegal
wildlife trade on social media. Nat Ecol Evol 2, 406–407. doi:10.1038/s41559-018-0466-x
Díaz, S., Pascual, U., Stenseke, M., Martín-López, B., Watson, R.T., Molnár, Z., Hill, R., Chan,
K.M.A., Baste, I.A., Brauman, K.A., Polasky, S., Church, A., Lonsdale, M., Larigauderie, A.,

Preprint submitted to Scientific Reports at November 30 2020                             Page 22
Wide-scale assessment of CES using Graph Theory                            de Juan et al. 2020

Leadley, P.W., van Oudenhoven, A.P.E., van der Plaat, F., Schröter, M., Lavorel, S., Aumeeruddy-
Thomas, Y., Bukvareva, E., Davies, K., Demissew, S., Erpul, G., Failler, P., Guerra, C.A., Hewitt,
C.L., Keune, H., Lindley, S., Shirayama, Y., 2018. Assessing nature’s contributions to people.
Science 359, 270–272. doi:10.1126/science.aap8826

Figueroa-Alfaro, R.W., Tang, Z., 2016. Evaluating the aesthetic value of cultural ecosystem services
by mapping geo-tagged photographs from social media data on Panoramio and Flickr. Journal of
Environmental Planning and Management 60, 266–281. doi:10.1080/09640568.2016.1151772

Freeman, L.C., 1979. Centrality in Social Networks Conceptual Clarification. Social Networks
215–239.
Geboers, M.A., Van De Wiele, C.T., 2020. Machine Vision and Social Media Images: Why Hashtags
Matter. Social Media + Society 6, 205630512092848. doi:10.1177/2056305120928485
Ghermandi, A., Camacho-Valdez, V., Trejo-Espinosa, H., 2020. Social media-based analysis of
cultural ecosystem services and heritage tourism in a coastal region of Mexico. Tourism Management
77, 104002.

Girvan, M., Newman, M.E.J., 2002. Community structure in social and biological networks. P Natl
Acad Sci USA 99, 7821–7826. doi:10.1073/pnas.122653799

Gosal, A.S., Geijzendorffer, I.R., Václavík, T., Poulin, B., Ziv, G., 2019. Using social media, ma-
chine learning and natural language processing to map multiple recreational beneficiaries. Ecosys-
tem Services 38, 100958. doi:10.1016/j.ecoser.2019.100958

Guerrero, P., Møller, M.S., Olafsson, A.S., Snizek, B., 2016. Revealing Cultural Ecosystem
Services through Instagram Images: The Potential of Social Media Volunteered Geographic
Information for Urban Green Infrastructure Planning and Governance. Urban Planning 1, 1–17.
doi:10.17645/up.v1i2.609

Haines-Young, R., Potschin, M., 2010. The links between biodiversity, ecosystem services and
human well-being, in: Raffaelli, D., Frid, C.L. (Eds.), Ecosystem Ecology: a New Synthesis. BES
Ecological Reviews Series, Cambridge, pp. 110–139.

Hale, R.L., Cook, E.M., Beltrán, B.J., 2019. Cultural ecosystem services provided by rivers
across diverse social-ecological landscapes: A social media analysis. Ecol. Ind. 107, 105580.
doi:10.1016/j.ecolind.2019.105580

Hausmann, A., Toivonen, T., Slotow, R., Tenkanen, H., Moilanen, A., Heikinheimo, V., Di Minin,
E., 2018. Social Media Data Can Be Used to Understand Tourists’ Preferences for Nature-Based
Experiences in Protected Areas. Consrv Let 11, e12343. doi:10.1111/conl.12343

Hughes, T.P., Kerry, J.T., Baird, A.H., Connolly, S.R., Dietzel, A., Eakin, C.M., Heron, S.F.,
Hoey, A.S., Hoogenboom, M.O., Liu, G., McWilliam, M.J., Pears, R.J., Pratchett, M.S., Skirving,
W.J., Stella, J.S., Torda, G., 2018. Global warming transforms coral reef assemblages. Nature 556,
492–496. doi:10.1038/s41586-018-0041-2

IPBES, 2018. Summary for policymakers of the regional assessment report on biodiversity and
ecosystem services for Europe and Central Asia of the Intergovernmental Science-Policy Platform
on Biodiversity and Ecosystem Services. IPBES secretariat, Bonn, Germany.

Jeawak, S.S., Jones, C.B., Schockaert, S., 2017. Using Flickr for Characterizing the Environment:
An Exploratory Analysis. DROPS-IDN/7752 13. doi:10.4230/LIPIcs.COSIT.2017.21

Kirchhoff, T., 2012. Pivotal cultural values of nature cannot be integrated into the ecosystem
services framework. P Natl Acad Sci USA 109, E3146–E3146. doi:10.1073/pnas.1212409109
Klain, S.C., Satterfield, T.A., Chan, K.M.A., 2014. What matters and why? Ecosystem services
and their bundled qualities. Ecol Econ 107, 310–320. doi:10.1016/j.ecolecon.2014.09.003
Lee, H., Seo, B., Koellner, T., Lautenbach, S., 2019. Mapping cultural ecosystem services 2.0
– Potential and shortcomings from unlabeled crowd sourced images. Ecol. Ind. 96, 505–515.
doi:10.1016/j.ecolind.2018.08.035

Liquete, C., Piroddi, C., Drakou, E.G., Gurney, L., Katsanevakis, S., Charef, A., Egoh, B., 2013.
Current Status and Future Prospects for the Assessment of Marine and Coastal Ecosystem Services:
A Systematic Review. PloS ONE 8, e67737. doi:10.1371/journal.pone.0067737

Maiya, A.S., Berger-Wolf, T.Y., 2010. Online Sampling of High Centrality Individuals in Social
Networks, in: Advances in Knowledge Discovery and Data Mining, 14th Pacific-Asia Conference,
PAKDD 2010, Hyderabad, India, June 21-24, 2010. Proceedings. Part I. Springer, Berlin, Heidel-
berg, Berlin, Heidelberg, pp. 91–98. doi:10.1007/978-3-642-13657-3_12

Preprint submitted to Scientific Reports at November 30 2020                              Page 23
You can also read