Fuel Poverty- A Connected Solution - The Energy & Utilities Alliance 16th January 2017 - Energy and Utilities Alliance
←
→
Page content transcription
If your browser does not render page correctly, please read the page content below

Fuel Poverty-
A Connected Solution

The Energy & Utilities Alliance
16th January 2017
Foreward

Fuel Poverty is a problem policy makers in the UK have, to date been unable to solve or find
an effective policy mechanism. For the last two decades policies have been developed and
implemented to reduce or eliminate fuel poverty. Yet the rate of fuel poverty is still
unacceptably high and estimates are that it could take decades to address.

Those at most risk of being trapped by fuel poverty are not just the elderly or those in
absolute poverty. Our analysis shows that families with children or who may be looking after
an elderly relative, who rent or own a modest home and have a low to average income are
equally as likely to be in fuel poverty.

Our report outlines how by simplifying government processes these households could be
saving approximately £900 a year on their energy bills. Additionally this would not necessitate
any government spending or new policies.

We have identified four changes to government policy that would help take homes out of fuel
poverty:

  1. Amend the Energy Company Obligation scheme to focus on first time
		   central heating systems for the fuel poor. This could save 139,130
		   homes a minimum of £922 per year1
  2. Remove the cap on first time connections through the Fuel Poor
		   Network Extension Scheme (FPNES)
  3. Fuel poverty schemes would be more effective if they operate on a
		   street by street approach
  4. Better cross departmental data sharing to help identify fuel poor
		households

These changes would require a rethink of current initiatives however we believe this is
necessary because previous schemes have not been effective in tackling fuel poverty.

This has not been helped by the frequently changing objectives and measurements. England,
Scotland and Wales all use different methods to calculate fuel poverty and all have different
schemes to tackle it. England has rolled out a number variants based on energy suppliers
providing funding for energy efficiency work, whilst the Scottish and Welsh Governments have
opted to provide more direct Government money.

Analysis of these approaches shows that there is no one silver bullet and none of the schemes
introduced to date have been able to demonstrate an effective ability to tackle the problem.

One of the obvious difficulties with tackling fuel poverty is the link to absolute poverty. Our
analysis in this report shows that being in poverty is the single biggest link to being in fuel
poverty. Obviously energy policy is not designed to tackle overall poverty in society and nor
will it ever be able to do so.

1     Based on 10,000 KwH of direct electric heating at 13.86p per unit of electricity compared to a condensing natural gas boiler at 4.18p per unit of gas.
With this is mind fuel poverty policy should be designed to maximise returns. What measures
can be installed into people’s homes that provides the biggest reductions in their energy bills.

This report will show that the simple act of connecting homes to the existing gas grid can re-
duce average energy bills by £922 for homes currently using electricity as their principal means
of heating. This can be delivered cost effectively and could provide upwards of two
million homes with affordable heating.

However this would require joined up energy policy. Currently the RIIO framework only allows
for up to 91,203 homes to be connected in the eight years of the settlement, with four years
still to run. RIIO does not allow companies to help residents with the cost of a new central
heating system, which a home in fuel poverty is unlikely to be able to afford.

Therefore we are calling on government to allow the gas networks to connect homes to the
gas grid if they are in fuel poverty even if this means exceeding the RIIO targets. And we are
asking that the new ECO 3 scheme due to start in 2018 obligates suppliers to fund the
installation of a complete new heating system on those newly connected homes. A variation of
this was trialled by the limited Central Heating Fund.

EUA believes that by taking these two simple steps the number of fuel poor homes could
be reduced by approximately half a million.

This report will analyse the current status of fuel poverty legislation, in particular the differing
calculation methodologies that are in use. It will look at the underlying causes of fuel poverty
and likely indicators. It will then outline cost effective solutions to tackle this problem.

We have included a number of case studies of cities in England that clearly show that there are
many inner city homes that are within 23 meters of the gas main and yet are still using
expensive electric heating for their heating.

Finally we will detail our recommendations to government on how we believe energy policy
should be designed in order to bring those with some of the highest bills out of fuel poverty.

And why is this action necessary? Because in one of the 6 richest countries in the world it is
unacceptable that 1,500 people die every day in the winter months because of a cold home,
and it is even more unacceptable that this occurs even though solutions are there to prevent
this. In 2014/15 with a mean temperature of 4.8°c this led to an estimated preventable 43,850
deaths linked to cold homes. Policies aimed at tackling fuel poverty are clearly not working
effectively enough, more needs to be done, but it needs to effective and to address those
most at need, not just the easiest and cheapest to help. We believe this report offers a route to
better policy making.
Contents

Measuring Fuel Poverty...............................................................................................                       1

Effects of Fuel Poverty..................................................................................................                   4

Fuel Poverty Schemes...................................................................................................                     6

Causes of Fuel Poverty..................................................................................................                    8

Risk Ratios..........................................................................................................................       8

Logistic Regression........................................................................................................                 14

Results..................................................................................................................................   16

Solutions for Fuel Poverty............................................................................................                      18

Bill Savings ........................................................................................................................       19

Carbon Savings................................................................................................................              19

Costs ...................................................................................................................................   20

Feasibility of Wide Scale Grid Connection............................................................                                       21

Case studies......................................................................................................................          21

           Blackpool................................................................................................................        21

           Bristol......................................................................................................................    25

           Brighton & Hove.................................................................................................                 27

Recommendations.........................................................................................................                    29

Appendix/Unneeded Work.........................................................................................                             30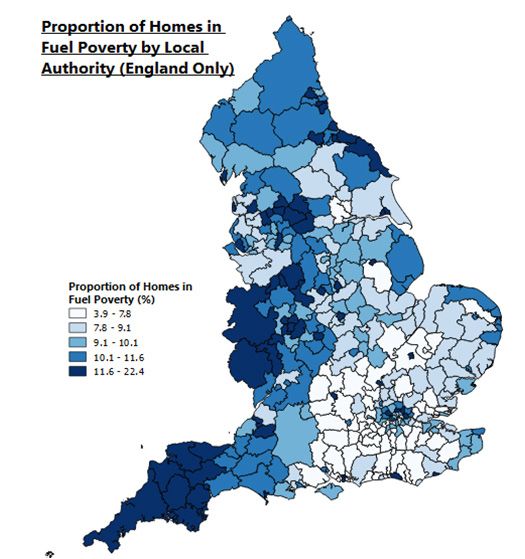
Measuring Fuel Poverty

Before exploring some of the drivers of fuel poverty, it is first necessary to understand fully what is meant
when somebody is deemed to suffer from fuel poverty. An official definition of “fuel poverty” was set out
in the 2000 Warm Homes and Energy Conservation Act:

“For the purposes of this Act, a person is regarded to be living “in fuel poverty” if he is a member of a
household living on a lower income in a home which cannot be kept warm at reasonable cost”

Under the “Low Income High Costs” (LIHC) measure, a household is deemed to be in fuel poverty if two
requirements are met [reference – Fuel Poverty Methodology Handbook 2016]:

  - the household has required (modelled) fuel costs that are greater than national median
		level
  - if they were to spend that amount, their residual income would be below the official
		  poverty line, which is defined as 60% of median “equivalised” income

Under the 10% indicator of fuel poverty, a household is deemed to be fuel poor if their required fuel
costs are greater than 10% of their income. The pie chart below shows the number of households in the
UK that fall into each “quadrant” of the LIHC measure:

Before the adoption of the LIHC measure in England, fuel poverty was estimated using the “10%
indicator”, whereby a household was considered to be in fuel poverty if it spent more than 10% of its
income on meeting its energy requirements.

Although intuitively straightforward, the 10% indicator has a number of drawbacks. Firstly, despite a
veneer of objectivity, the 10% ratio is an arbitrarily defined threshold.

                                                                                                            1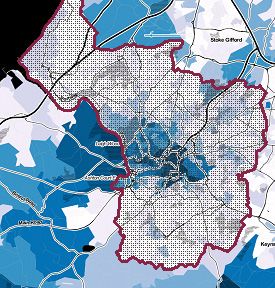
According to the 2011 Hills Interim Report, the 10% threshold is derived from a study that demonstrated
“that in 1988 the median household spent 5 per cent of its net income on fuel and that twice this ratio
might be taken as being ‘unreasonable’.” Secondly, under the 10% rule the classification of a household
as fuel poor is sensitive to changes in energy prices. Between 1996 and 2015, annual domestic gas price
growth ranged between -4.6% and 27.4%, while electricity prices varied from -7.2% to 18.2%. Allowing
such volatility to affect the classification of the fuel poor is highly undesirable.

Finally, the 10% measure does not take into account household income. As a result, it is almost certain
that some households with relatively high incomes will be classified as fuel poor – this is clearly at odds
with the definition of fuel poverty that was expounded in the 2000 WHECA.

The LIHC measure goes a long way to correcting some of the deficiencies of the previous indicator: it
excludes households with relatively high incomes; it is not sensitive to short term movements in energy
prices; and it is objective. As a consequence, one of the primary recommendations of the 2012 Hills
Review was a move away from the 10% indicator and the subsequent adoption of the LIHC measure.

However, this recommendation was only implemented in England. In Scotland and Wales, the extent of
fuel poverty is still estimated using the 10% indicator. In order to understand why this is problematic, it
is worth exploring the relationship between these two indicators. In 2013 (the most recent year for which
detailed data are available), a total of 2.35 million households were estimated to be in fuel poverty under
the LIHC measure.

Using the 10% ratio, this figure rises to 2.73 million. Given that these two indicators purport to measure
the same phenomenon, it would be logical to presume that the intersection – i.e. households deemed
to be in fuel poverty under the LIHC measure and the 10% indicator – would be large. However, the data
show that only 1.18 million households fall into both categories. This is shown below:

                                                                                                              2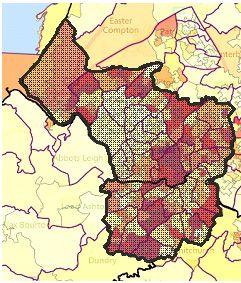
Clearly, the measurement of fuel poverty that is used makes a substantial difference to which households
are considered to be fuel poor.
Given the importance of reducing fuel poverty, a lack of consistency between England and Scotland and
Wales seems unwise. EUA recommends that the devolved administrations adopt the LIHC measure
in order to allow for meaningful comparisons and consistent policy making across the board.

                                                                                                       3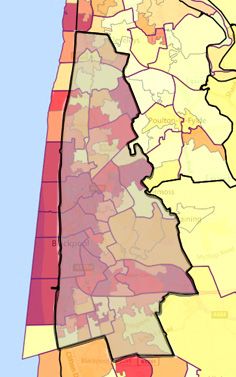
Effects of Fuel Poverty

Policies designed to tackle fuel poverty occupy such a prominent place in any Government’s energy
agenda precisely because of the copious negative consequences that it causes. In recent years, the
concept of many thousands of families choosing whether to “heat or eat” has entered the national
press and with it mainstream political discourse.

Whilst many of the causes and effects of fuel poverty can be said to be similar or identical to poverty
more generally, there are a number of negative outcomes which are unique to fuel poverty, particularly
in the field of health. This is due to the fact that a cold home can easily exacerbate pre-existing health
complications, often leading to more chronic or unremitting conditions as well as preventable deaths.

At no time of the year is this effect more prominent than in the winter months. The latest figures from
the Office for National Statistics show that an inability of households to adequately heat their homes
lead to an estimated 24,300 preventable deaths in the winter months of 2014 and 20152 . This equates
to a more than 1,500 deaths per day, a figure which remains largely unchanged from statistics dating
back nearly 20 years. The figures from the winter of 2014/15 are more staggering; a particularly cold
winter with a mean temperature of 4.8°c lead to an estimated 43,850 deaths, the highest figure since
1999.

New trends in preventable winter deaths have also begun to develop in recent years. Whilst the vast
majority of these winter deaths occur amongst the elderly, the latest figures indicate that preventable
winter deaths are increasing in those under the age of 65 whilst decreasing amongst those aged 85
and over. Additionally, the number of preventable deaths is increasing in the later winter months of
January and February whilst also extending into March and April, indicating that especially cold
weather is not the only factor in causing these deaths. In 2016, preventable winter deaths in March
were higher than in February whilst April’s figures were higher than those of December 2015.

The most prominent underlying cause of preventable winter deaths remains respiratory illnesses. This
category also showed there were 41% more deaths from respiratory deaths in the winter months of
2015/16 than there were in non-winter months; the figure for 2014/15 was far higher at 78%.
Respiratory illnesses are widely known to be exacerbated by excessively cold living conditions which is
one of the primary reasons that the elderly, who are one of the groups most susceptible to fuel
poverty, are particularly affected.

Another factor to be considered is that it is not only short-term, aggressive illnesses such as influenza,
aggravated by cold homes, which contribute to preventable deaths. Long-term, chronic conditions
are also of particular concern given the weakening effect they typically have on sufferers. One such
condition is chronic obstructive pulmonary disease (COPD), a serious respiratory condition with over 3
million sufferers and 25,000 associated premature deaths a year which is made worse by living in cold
homes3.

A study and pilot scheme entitled ‘Boilers on Prescription’ recently conducted in Sunderland by the
Gentoo group and local Clinical Commissioning Groups found that it is possible to simultaneously

                                                                                                                                                                           4

2 Office of National Statistics Excess winter mortality in England and Wales: 2015/16 (provisional) and 2014/15 (final) (http://www.ons.gov.uk/peoplepopulationandcommunity/
birthsdeathsandmarriages/deaths/bulletins/excesswintermortalityinenglandandwales/2015to2016provisionaland2014to2015final)

3 NHS information page on COPD (http://www.nhs.uk/conditions/chronic-obstructive-pulmonary-disease/Pages/Introduction.aspx)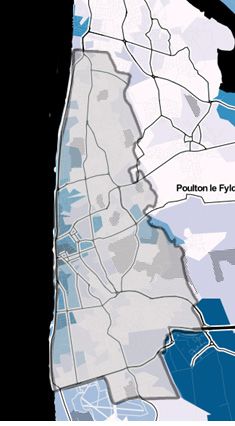
improve the health outcomes of patients and address their fuel poverty whilst also reducing their
long-term treatment costs to NHS. The group worked with sufferers of COPD and their families by
monitoring their interactions with NHS services whilst improving the energy efficiency of their homes
as well as their central heating system; the total cost of the improvements was, on average, £5000.

The initial results from the first year of the pilot scheme were very encouraging: GP appointments were
reduced by 60%, outpatient appointments by 22% and attendances at A&E by 30%. This could
represent enormous cost savings for the NHS if replicated on a large scale. Each single hospital
emergency admission costs the NHS £2500, each GP appointment costs £45 and each prescription
costs, on average, £41.35. The total annual cost of COPD is estimated to be in excess of £800 million.
At the same time, the home improvements made during the pilot scheme demonstrated carbon
reductions of around 25% emissions per property and saved each household around £125 per annum
on their fuel bill.

Given the sheer number of people in Britain living with debilitating conditions that are made worse by
living in fuel poverty, and consequently a cold home, it is surprising that we are yet to see a
Government policy which recognises the link between the two. Instead, it is left to energy companies
to pave the way with schemes such as npower’s Health Through Warmth initiative under which anyone
can refer someone with a long-term illness made worse by living in a cold home that cannot afford to
repair or replace their heating system 4.

Recommendation: The concept of ‘heating on prescription’ should be adopted as a policy by the
government, backed by funding for a new heating system to those in need.

4 npower Health Through Warmth scheme (http://www.npower.com/health_through_warmth)                     5
Fuel Poverty Schemes

Fuel poverty is a major political and social issue which has permeated the agendas of successive
Governments. Consequently, there have been a number of schemes in recent years aimed at reducing
fuel poverty using various mechanisms:

Warm Front Scheme
The Warm Front Scheme ran until January 2013 and offered households grants towards the cost of
various domestic energy efficiency measures. Eligible measures included insulation, draught-proofing
as well as improvements to gas, electric or oil central heating. Up to £3,500 was available per
household, however this limit was raised to £6,000 for homes that required a connection to the gas
grid. Grant payments were given directly to the contractor or tradesperson who carried out the work
as opposed to householders. The total budget for Warm Front in its final year was £100 million.

As with many schemes targeted at fuel poor households, the scheme had several prerequisites.
Applicants had to own their own home or privately rent and have the permission of their landlord,
have a poorly insulated home or an inadequate central heating system as well as be in receipt of
certain income-defined benefits.

Affordable Warmth Scheme
The Affordable Warmth Scheme (AWS) was devised as a replacement for Warm Front and began in
early 20135 . It is the customer-facing brand of the Home Heating Cost Reduction Obligation, one of
the three targets of the Energy Companies Obligation (ECO). By bringing the scheme under the ECO
umbrella, the Government ensured that the funding and responsibility for identifying and vetting
applicants would be delivered by energy companies.

The concept behind the AWS is much the same as Warm Front: making energy saving home
improvements such as new boilers and insulation available to people on low incomes and in receipt
of certain benefits. The range of eligible measures was reduced to just new boilers, loft insulation and
cavity wall insulation.

Central Heating Fund
The Central Heating Fund (CHF) was the opposite of the Affordable Warmth Scheme in that only local
authorities can apply for funding under it6 . Local authorities are able to pass on funding to other
social landlords and housing associations. The primary target of the scheme was fuel poor, off-gas grid
households who needed a first time central heating system.

The main focus of allocated funds under the CHF is gaining the maximum bill savings per pound spent
as well as the amount spent per installation compared with the Government’s fuel poverty strategy.
Additional considerations include the strength of local delivery plans, inclusion of rural properties and
supporting households’ use of new central heating systems.

Households identified by local authorities could not already have a mains gas central heating system
being used as their primary heating source. An area-based approach to targeting was possible as long
as councils could ensure that the households could be evidenced as being in fuel poverty in line with
the Government’s measure or their permitted proxy, the ECO AWS group.

5
6
      Affordable Warmth Scheme FAQs (http://www.affordablewarmthgrants.co.uk/questions-about-affordable-warmth)
      BEIS Central Heating Fund FAQs (https://www.gov.uk/government/publications/central-heating-fund-local-authority-guidance/central-heating-fund-faqs)
                                                                                                                                                            6
The range of eligible measures were much wider than the AWS as all parts of the heating system used
to generate or distribute heat were eligible for funding including the heat source, pipework and
radiators. Insulation was not eligible under the CHF as the Government anticipated that other funding
streams, such as the AWS, would be used for this instead.
7Causes of Fuel Poverty
Any policy designed to combat fuel poverty should result from a firm understanding of its causes. The
focus of this report is the relationship between a number of household and dwelling characteristics
and fuel poverty as estimated by the LIHC measure. However, for completeness, the relationship
between these characteristics and a number of alternative measures is also explored. In addition to the
LIHC indicator, the following measures are included:
• 10% ratio (defined in the previous section.
• The 10% and LIHC intersection – households defined as fuel poor by both the LIHC and
10% measures.
• Households with incomes less than the national median who spend more than 10% of
their income on energy.
• Households in poverty living in a dwelling with a SAP rating less than 60.
This analysis uses a dataset constructed by matching observations in the English Housing Survey
dataset with characteristics from the detailed Fuel Poverty dataset published by DBEIS.
Risk Ratios
Risk ratios are used in order to investigate the strength of the relationship between a variety of
household and dwelling characteristics and fuel poverty.
Risk ratios express the probability that an “event” occurs for a particular group relative to the
probability that it occurs in a comparison group. For instance, the probability that a household off the
gas grid is in fuel poverty, relative to the probability that a household on the gas grid is in fuel poverty.
A risk ratio greater than 1 indicates that a household in a particular category is at greater risk of being
in fuel poverty than other households. Conversely, a risk ratio less than 1 suggests that a household in
a particular category is at less risk of being in fuel poverty than other households.
For ease of comparison, a colour gradient has been applied to the risk ratios in the following tables.
Dark red shading indicates that a particular characteristic is strongly associated with being in fuel
poverty, while a dark green shading indicates that fuel poverty is less frequently found in households
exhibit a particular trait.
Dwelling Characteristics
The following table illustrates the relationship between a number of dwelling characteristics and the
Low Income High Costs measure of fuel poverty (as well as a range of other measures).
As a synthesis of a variety of household characteristics, the Energy Efficiency Bands provide an
overview of the likelihood of being in fuel poverty. However, it is useful to dig a little deeper into the
data and investigate the relationship between fuel poverty and some of the constituent parts of the
Energy Efficiency Bands.
8LIHC 10% Ratio LIHC 10% Low Income Poverty and
Ratio and 10% SAPEnergy Efficiency Band
The energy efficiency rating of a property is one of the primary determinants of energy costs and will
therefore have a significant impact on fuel poverty. This suspicion is borne out by the risk ratios in the
table above; people living in Band E, F and G properties are significantly more likely to be in fuel
poverty than those living in more energy efficient homes.
Dwelling Age
Energy efficiency requirements of new homes have become much more stringent over time. As a
consequence, households living in older properties are more likely to be in fuel poverty than those
living in newer homes.
The risk ratios indicate that people living in pre-1919 properties are 123% more likely to be in fuel
poverty than those living in newer properties.
Dwelling Type
The relationship between dwelling type and fuel poverty is multifaceted. As an example, detached
homes are typically larger than terraced properties and will typically have higher energy costs as a
consequence. However, larger properties are more expensive, meaning the typical detached house
owner (or tenant) is likely to be wealthier than the average owner (or tenant) of a terraced home.
The data indicates that people living in end terraced homes are at greatest risk of fuel poverty.
Conversely, and quite surprisingly, those living in low rise flats are least likely to be living in fuel
poverty.
Boiler Type
The type of central heating boiler that a property uses is likely to be a significant factor in determining
whether a household is in fuel poverty. Non-gas heating fuels are typically more expensive than gas,
so will lead to relatively high heating bills. Given the discrepancy in efficiency between condensing and
non-condensing boilers (90% compared with 70%), homes with non-condensing boilers will be more
expensive to heat.
People living in homes with a non-condensing boilers are 43% more likely to be in fuel poverty than
the rest of the population.
10Grid Status
Homes that aren’t connected to the gas grid are commonly heated using electric heaters, oil or LPG central
heating. Heating a home using LPG, oil or electricity is typically more expensive than mains gas. As a result,
it is to be expected that homes off the gas grid have higher heating bills than similar
properties on the gas grid and therefore are more likely to be in fuel poverty than their on grid
counterparts.
Households without a connection to the gas grid have 1.5 times the risk of being in fuel poverty than those
with a mains gas connection.
Wall Type
Homes without sufficient insulation will lose more heat than well insulated homes. As a consequence, they
will cost more to heat. Therefore, the incidence of fuel poverty is expected to be higher in homes in uninsu-
lated homes than those with adequate insulation.
People living in homes with uninsulated solid walls have 2.2 times the risk of being in fuel poverty than
those in homes with other types of wall.
Extent of Double Glazing
Double glazing is an effective way of reducing the amount of heat lost from a house. Consequently, people
living in a home with no double glazing are 44% more likely to be in fuel poverty than those with some (or
full) double glazing.
11Household Characteristics
The table below illustrates the relationship between a number of household socio-economic
characteristics and fuel poverty.
LIHC 10% Ratio LIHC and Low Income Poverty and
10% Ratio and 10% SAPTenure
It is well known that homes in the private rented sector are less energy efficient than privately owned
homes. People living in privately rented homes are 124% more likely to be in fuel poverty than those
in other types of housing.
Local authority and registered social landlord properties are required to meet more stringent energy
efficiency than privately owned or rented properties. As a result, they are the most energy efficient
homes in the UK building stock (source EHS). However, by their nature, occupants of these homes are
likely to have lower disposable incomes than people in owner occupied homes.
Region
There is significant variation in the prevalence of fuel poverty in different regions of England. Those in
the West Midlands face 1.4 times the risk of fuel poverty than those in other areas of the country. The
map below demonstrates the regional discrepancies in fuel poverty at a more detailed level:
13Poverty Status
Unsurprisingly, the relationship between poverty and fuel poverty is very strong. Those in poverty are
nearly 1500% more likely to be in fuel poverty than those not in poverty.
Length of Tenure
The prevalence of fuel poverty declines the longer the householder’s tenure in a property. One
potential reason for this is that people intending to live in a property for a long period have a greater
incentive to invest in energy efficiency measures than others.
Household Size
Larger households are at greater risk of fuel poverty than smaller households. This is likely due to the
fact that the income levels used in the calculation of fuel poverty status are “equivalised” to take into
account the fact that smaller households can obtain the same standard of living for less money than
larger ones.
Logistic Regression
One of the drawbacks of the approach in the previous section (and the approach in DBEIS’ annual fuel
poverty report) is that it considers each characteristic in isolation of others.
However, many of the characteristics are in fact related to each other. For example, the age of a
property is highly correlated with the type of wall insulation. The table below demonstrates that
uninsulated solid walls are found in 83% of pre-1919 properties, yet only 1.6% of post-1980 homes.
pre 1919 1919 - 1944 1945 - 1964 1965 - 1980 post 1980
Cavity with insulation 3.70% 31.00% 63.77% 58.87% 47.48%
Cavity uninsulated 10.83% 23.53% 22.49% 33.72% 41.99%
Solid with insulation 2.04% 1.55% 2.80% 1.25% 1.92%
Solid uninsulated 83.09% 43.89% 10.74% 4.80% 1.60%
Other 0.33% 0.04% 0.21% 1.36% 7.01%
The analysis above does not take into account these inter-correlations, therefore caution must be
exercised when interpreting the risk ratios. For example, the risk ratios imply that people living in
pre-1919 properties are at greater risk of fuel poverty than those living in newer properties. However,
this is not a causal relationship – the age of a house does not itself directly influence fuel poverty
status. However, other factors that are correlated with the age of the property – e.g. wall type and
insulation – do have a direct impact on the likelihood of fuel poverty.
Regression techniques can be employed to control for confounding factors and allow for more
meaningful conclusions to be drawn about the true magnitude of the relationship between household
characteristics and fuel poverty.
Specifically, in circumstances where the “dependent variable” (fuel poverty status) is “categorical” (i.e.
it can take one of a limited number of possible values) logistic regression techniques can be used to
investigate the relationship in question.
14The results of the logistic regression are shown in the table below:
Odds Odds increase/Decrease
vs Reference
Poverty In Poverty 59.06 5851%
Status Not in Poverty Reference
Grid Status On Grid 0.364 -64%
Off Grid Reference
Age 1.003 0%
HRP Age Age= Zero Reference
Loft Loft Insulation Depth 0.997 0%
Insulation No loft Insulation Reference
Pre 1919 4.361 336%
1914 to 1944 3.215 221%
Dwelling 1945 to 1964 3.713 271%
Age 1965 to 1980 3.15 215%
Post 1980 Reference
End terrace 1.007 1%
Mid terrace 0.534 -47%
Semi detached Reference
Property Detached 1.605 60%
Type Bungalow 1.068 7%
Converted flat 0.335 -66%
Low rise flat 0.330 -67%
High rise flat 2.144 114%
Cavity with insulation 0.311 -69%
Cavity uninsualted 0.886 -11%
Insulation Solid with insulation 0.222 -78%
Solid uninsulated Reference
Other 0.406 -59%
No doube glazing Reference
Glazing Less than half 0.761 -24%
More than half 0.817 -18%
Entire house 0.704 -30%
Owner occupied Reference
Tenure Private rented 1.330 33%
Local authority 0.742 -26%
RSL 0.629 -37%
North East 2.200 120%
Yorkshire and Humber 1.725 73%
North West 1.873 87%
Region East Midlands 1.783 78%
West Midlands 1.926 93%
South West 2.127 113%
East England 1.233 23%
South East 1.440 44%
London Reference
1 Reference
2 1.179 18%
3 2.167 117%
4 1.996 100%
No. of 5 2.081 108%
occupants 6 3.648 265%
7 7.486 649%
8 13.813 1281%
9 3.035 204%
Sex of HRP Female 0.966 -3%
Male Reference
Less than one year Reference
one year 1.020 2%
two years 1.172 17%
Length of 3-4 years 1.241 24%
Occupancy 5-9 years 1.500 50%
10-19 years 1.451 45%
20-29 years 1.885 89%
30+ years 1.526 53%
Constant 0.016 -98%
15Interpretation of Logistic Regression Output
The coefficients from a logistic regression give an estimate of the degree of association between
each of the characteristics and fuel poverty. The coefficients can be interpreted as follows: holding
all other variables constant, the odds coefficient represents the increase or decrease in the odds of
being in fuel poverty relative to the reference state for a set of characteristics. A coefficient larger
than one is associated with an increase in the odds, while a coefficient less than one represents a
decrease in odds.
For example, in the table below the odds of being in fuel poverty are 47% lower for households in
mid-terrace homes than the odds for people in semi-detached homes. Similarly, the odds of being
in fuel poverty are 114% higher for households in high rise flats than the odds of fuel poverty in
the reference property type. A more detailed explanation and motivating examples can be found
here.
Results
Many of the relationships that were found in the risk ratio analysis are also visible in the logistic
regression analysis, although the size of the effects differ due to isolating the effects of each individual
variable.
Poverty itself plays the largest role in determining who is in fuel poverty. Even when dwelling
characteristics are taken into account, the odds of being in fuel poverty are nearly 6000% higher for
those in poverty than people not in poverty.
Controlling for other factors, a connection to the gas grid is associated with a 64% reduction in the odds
of being in fuel poverty. Cavity wall and solid wall insulation also reduce the odds of being in fuel
poverty by a large degree. Conversely, those living in private rented accommodation are more likely to
be in fuel poverty than those living in owner occupied, local authority or housing association homes.
16Importance of Grid Status
In order to fully comprehend the association between connections to the gas grid and fuel poverty, it
is instructive to use the above logistic regression model to construct a few motivating examples.
Example 1
“Lara” lives in a 1970s semi-detached property in the West Midlands with insulated cavity walls,
125mm of cavity wall insulation and full double glazing. She is 40 years old, not in poverty and lives
with four others. She has been living in their current property for three and a half years and owns the
property.
According to the logistic regression model constructed above, these characteristics suggest that Lara
has a 4.1% chance of being in fuel poverty if she isn’t connected to the gas grid. According to the
model, a connection to the gas grid would reduce her chance of being in fuel poverty to 1.5%.
Example 2
Isaiah lives in a pre-1919 end terrace property in Yorkshire with uninsulated solid walls, no loft
insulation and no double glazing. He is 55 years old, in poverty and lives alone. He has been living in
their current property for one year and rents from a private landlord.
These characteristics suggest that Isaiah has a 92.1% chance of being in fuel poverty if he is not
connected to the gas grid. According to the model, a connection to the gas grid would reduce the
probability of being in fuel poverty to 80.9%.
Example 3
Josh lives in a 1950s detached property in the South East with insulated solid walls, 125mm of loft
insulation and double glazing on more than half of his windows. He is 30 years old, not in poverty
and live with two other people. He has been living in his current property for five years and own the
property.
These characteristics suggest that Josh has a 20.0% chance of being in fuel poverty if he is not
connected to the gas grid. According to the model, a connection to the gas grid would reduce the
probability of being in fuel poverty to just 8.3%.
Reducing the incidence of poverty is well beyond the scope of any Government energy efficiency
scheme. However, improvements to the fabric of a home as well as to the heating system are deliverable
by Government. The next section of this report explores the costs and benefits of the solutions that are
available to the Government for reducing the incidence of fuel poverty.
17Solutions for Fuel Poverty
In this section, we explore the costs and benefits of four possible measures that could be (and are)
used to reduce the prevalence of fuel poverty. These are:
• Solid wall insulation
• Cavity wall insulation
• Loft insulation
• First time central heating (including gas grid connection)
For each measure, an estimated cost of installation has been gathered from the Energy Saving Trust.
Where this has not been possible, cost estimates have been produced from stakeholder discussions.
The savings resulting from each measure have been taken from The Department for Business, Energy
and Industrial Strategy’s (DBEIS) annual National Energy Efficiency Data Framework (NEED) report. This
report gathers real life usage data from households and tracks changes in usage in homes that install
various energy efficiency measures.
Solid Wall Insulation
The UK has some of the most poorly insulated homes in Western Europe (Guardian, 2013), it is
therefore unsurprising that insulation measures have been a focus of existing Government energy
efficiency schemes. To the end of June 2016, 125,751 solid wall insulation measures have been
installed through ECO.
The Department for Business, Energy and Industrial Strategy’s (DBEIS) annual National Energy
Efficiency Data Framework (NEED) estimates that the median energy saving for a household installing
solid wall insulation is 15.5%.
Cavity Wall Insulation
As demonstrated in the prior analysis, the presence of an uninsulated cavity wall is a strong predictor
of fuel poverty.
Cavity wall insulation measures have formed the backbone of ECO, with 684,454 measures installed up
to the end of June 2016. According to NEED, homes with cavity wall insulation experience a median
energy saving of 8.4%.
Loft Insulation
Loft insulation is also included within ECO, with 471,988 measures installed to the end of June 2016.
39% of these represented the installation of loft insulation where none was previously present, while
56% of these were the installation of top up loft insulation.
According to NEED, homes installing loft insulation experience a median energy saving of 2.1%
Grid Connection
Electric heating is typically 100% efficient, but a unit of electricity is considerably more expensive than
a unit of gas. According to the Energy Saving Trust, standard rate electricity costs 13.86 p/kWh while
off-peak economy 7 electricity costs 7.21 p/kWh. By comparison, a unit of gas costs 4.18 p/kWh.
A new condensing boiler delivers heat at efficiencies of 90% and over. Consequently, the use of gas
heating costs 4.6 p/kWh of delivered heat, compared with 13.86 p/kWh of heat for a system
using electric storage heaters. The cost of electric heating could be reduced if the homeowner is
able to take advantage of an Economy 7 tariff.
18Bill Savings
In this section, we consider the bill savings that would be experienced by a selection of off-grid,
electrically heated households who install one of the aforementioned measures.
For the purpose of these calculations, it is assumed that the home currently uses electric storage to
meet heat demand. Three heat demands are considered: 10,000 kWh, 15,000 kWh and 20,000 kWh. In
the first instance, absent any energy efficiency measures or new heating systems, this results in heating
bills of £1,386, £2,079 and £2,772 respectively.
The table below demonstrates the bill savings that would be experienced through the installation of
each of the considered measures.
Heat demand (kWh)
10,000 15,000 20,000
Initial bill £1,386 £2,079 £2,772
Savings
Cavity wall insualtion £116 £175 £233
Solid wall insulation £215 £322 £430
Loft insulation £29 £44 £58
Gas grid connection £922 £1,382 £1,843
A connection to the gas grid leads to the most significant bill savings – providing a saving of
£1,843 for a home with a heat demand of 20,000 kWh. By contrast, cavity wall insulation saves
£233, solid wall insulation would save £430 and loft insulation would save just £58.
Solid Wall Insulation
The cost of solid wall insulation varies considerably, depending on the size and type of property that is
to be insulated. Solid wall insulation is installed by fixing a layer of insulation to the outside of a
property and covering it with render or cladding.
The Energy Saving Trust (EST) estimates that the cost of external solid wall insulation ranges
between £8,000 for a small flat to £22,000 for a large detached house.
Cavity Wall Insulation
Cavity wall insulation can often be installed quickly and with minimal disruption. However, many cavities
are deemed to be “hard to treat” and can only be insulated at greater expense and disruption.
The EST estimates that the cost of cavity wall insulation ranges between £330 for a small flat and £720
for a detached property.
Loft Insulation
Many loft spaces can be easily insulated by the homeowner themselves, although factors such as
inaccessibility, flat roofs, loft conversions and damp mean that it is often advisable for a professional to
undertake the work. Many homes already have some level of loft insulation, in which case this can be
topped up to a recommended depth of 270mm.
19The cost of loft insulation varies depending on the depth of the existing insulation and the surface area
of the loft. The Energy Saving Trust estimate that loft insulation (going from 0 to 270mm) costs
between £285 for a mid-terrace house to £395 for a detached property. Top up insulation (120 to
270mm) is estimated to cost between £240 and £310.
Gas Grid Connection
The installation of a new “wet” central heating system in a previously electrically heated, off grid home
is a three stage process. Firstly, the household must be connected to the gas grid. Information
provided by the Gas Distribution Networks indicate that the average cost of a connection to the gas
grid is approximately £1,200. However, this average figure overstates the cost of connection for a
significant proportion of UK homes. Homes that are closer to the existing grid can be connected at
lower cost than those further away. The 2016 Committee on Climate Change “Next steps for UK heat
policy” report estimated the following costs of connection:
Connection type Cost per property
Single property to an existing gas grid (out- £346
side London)
Single property to an existing gas grid (Lon- £743
don)
Small development of 10 properties £988
New development of 100 properties £1,076
Commercial/industrial estate (20 medium £1,681
sized units)
Source: CCC
NB. The single property cost estimates assume the property is located within 23 metres of the
existing gas distribution system. For the purposes of this report we have used the higher
average connection cost figure of £630, supplied by the GDNs rather than theFeasibility of Wide Scale
Grid Connection
In general, properties that are closest to the existing gas grid can be connected at lowest cost. Using
figures from the Department for Business, Energy & Industrial Strategy (DBEIS) it is possible to identify
areas in which a strategy of connecting homes to the gas grid could be most easily targeted.
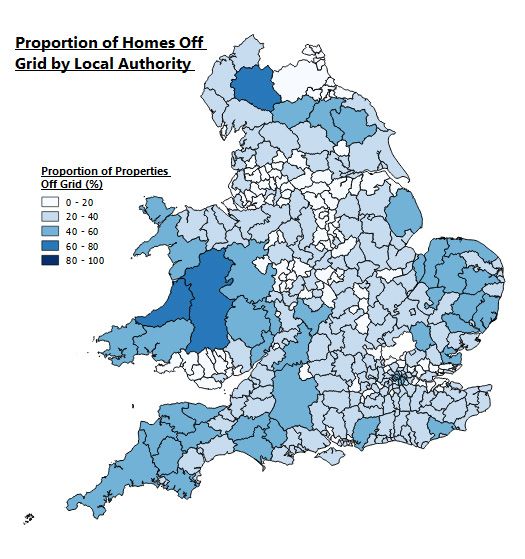
Firstly, it is useful to explore in which local authorities a gas grid connection is least prevalent.
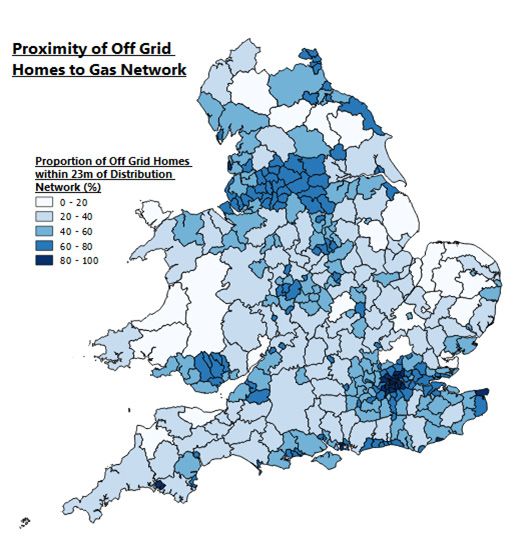
Of all off-grid properties in Great Britain, it is estimated that 54% are within 23 metres of the
distribution network. Overall, nearly 80% of properties are within half a kilometre of the
distribution network. Areas with a high proportion of homes in close proximity to the gas grid should
be considered a priority for wide-scale connections to the gas grid.
21The map below demonstrates the proportion of properties within each local authority that are within
23 metres of the distribution network:
In much of Greater London, South Wales and the North West of England, over 60% of off grid homes
are within 23 metres of the existing distribution network. In light of the analysis in the section above,
it would seem logical to propose that homes in fuel poverty in close proximity to the gas grid would
be most effectively helped by providing them with a connection to the grid and a first time central
heating system.
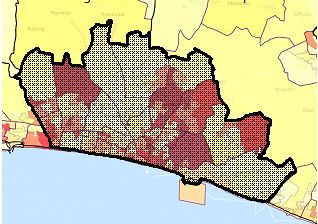
22Blackpool
Blackpool 2015 IMD Map
Blackpool is a town with high levels of depravation, despite being
a national tourist hotspot. As the IMD map to the left shows, there
are substantial areas of depravation (indicated by darker maroon
shades) in the central and southern parts of the town and there are
no areas that are classified within the 30% least deprived
neighbourhoods in the country.
Overall, the Blackpool Borough 11 Most Deprived LSOAs
ranks as the most deprived of all 1 Tendring 018A
330 local authorities in England; 2 Blackpool 010A
indeed, as the table on the right
3 Blackpool 006A
shows, six of the eleven most
deprived LSOAs in Britain 4 Thanet 001A
(numbering 32,844) are located in 5 Blackpool 013D
Blackpool7. 6 Tendring 016B
7 Blackpool 013A
8 Coventry 007E
High levels of income and 9 Blackpool 011A
employment inequality, in
10 Waveney 007D
particular, are strong indicators of
a prevalence of fuel poverty, which 11 Blackpool 010E
Local authority boundary
has been estimated some 9,288
households across Blackpool (14.1% of the total number). As with
depravation more broadly, fuel poverty in Blackpool is
concentrated in certain areas with some neighbourhoods having
Blackpool Non-gas Map
fuel poverty rates in excess of 33%.
Meanwhile, the corresponding Non-Gas Map shows that there are
high concentrations of off-gas grid properties (indicated by darker
shades of blue) along the coast, particularly in the most deprived
areas of the town. These areas are almost exclusively comprised of
terraced houses, the vast majority of which are less than 23 metres
from the gas grid. Examples of some specific LSOAs which fit this
model can be found in the table below with their rank on the
depravation scale being compared to the proportion of off-gas grid
properties as well as instances of fuel poverty.
These are the kind of deprived communities which could benefit
from targeted connection to the gas grid at relatively low cost given
their very close proximity to the existing gas grid.
Local authority boundary
23
7 DCLG 2015 Indices of Multiple Depravation – Summaries at Local Authority level (https://www.gov.uk/government/uploads/system/uploads/attachment_data/file/467764/
File_1_ID_2015_Index_of_Multiple_Deprivation.xlsx)Blackpool: Comparison of Depravation and Off-gas grid by LSOA
National depra- % of house- % of properties Proportion of Proportion of
LSOA code vation rank holds that are off-gas grid off-gas grid off-gas grid
(1 to 32,844) fuel poor8 within 23m of within 50m of
grid grid
006A 3 23.6% 82.8% 99.4% 100%
013D 5 32.0% 83.4% 74.9% 99.8%
013A 7 30.3% 67.7% 96.0% 100%
013B 17 33.8% 78.2% 98.5% 100%
006B 18 27.6% 64.9% 98.3% 100%
010D 83 26.5% 87.7% 96.6% 100%
8 https://www.gov.uk/government/statistics/2013-sub-regional-fuel-poverty-data-low-income-high-costs-indicator
24Bristol
Bristol 2015 IMD Map
Bristol is one of the UK’s major cities, having a
population of approximately 450,000 with over
600,000 in its wider urban area. Although the IMD
map shows that there are affluent communities in the
west and north of the city, there are also pockets of
depravation to the east of the city centre as well as in
the south of the city.
Overall figures of depravation are not as high as in
Blackpool, however Bristol still ranks highly at 33rd
amongst England’s 330 local authorities. The
proportion of fuel poor households sits at 13.2%
which represents 25,379, almost triple that of
Blackpool. The extremes between different areas of
the city are also stark; in some instances,
neighbourhoods with fuel poverty rates in excess of
23% sit within a mile of ones with 5%.
Local authority boundary
The distribution of gas grid connections in Bristol is typical of many large cities; coverage is better
in suburban areas but relatively poor in and around the city centre. As demonstrated by the Non-
gas Map, deprived estates in the south of the city are fairly well served in terms of grid connections
whereas poor inner city areas such as Lawrence Hill and St Paul’s are not.
Bristol Non-gas Map
Overall instances of fuel poverty in these communities
tend to be around 10% lower than in the most deprived
communities of Blackpool, which at the very top of the
scale in many respects. This may be due, in part, to the
higher incomes and more plentiful job opportunities
available to residents of a major southern city as
opposed to a northern town.
Nevertheless, the rates of fuel poverty in these areas
are typically 5% above the national average and
therefore there are clearly many thousands of
households in Bristol alone that could benefit hugely
from being connected to the gas grid as opposed to
having to rely on more expensive sources of heat.
Local authority boundary
25Bristol: Comparison of Depravation and Off-gas grid by LSOA
National depra- % of house- % of properties Proportion of Proportion of
LSOA code vation rank holds that are off-gas grid off-gas grid off-gas grid
(1 to 32,844) fuel poor within 23m of within 50m of
grid grid
056B 682 14.5% 71.6% 45.8% 96.7%
056C 949 9.5% 81.1% 87.8% 100%
025F 1,101 14.2% 85.8% 96.0% 100%
023G 1,385 15.6% 71.6% 99.5% 100%
26Brighton & Hove
Brighton & Hove 2015 IMD Map
Being within commuting distance of London,
Brighton and Hove are home to many affluent
communities. However, high house prices and
a general cost of living far greater than towns
such as Blackpool means there are also plenty
of instances of fuel poverty and depravation.
As a local authority, Brighton and Hove is the
65th most deprived in Britain and the fourth
most
deprived in the South East region. As with
Bristol, the densely populated nature of
Brighton and Hove means neighbourhoods
with fuel poverty rates of nearly 20% sit
cheek-by-jowl with ones that are below 7%.
Local authority boundary
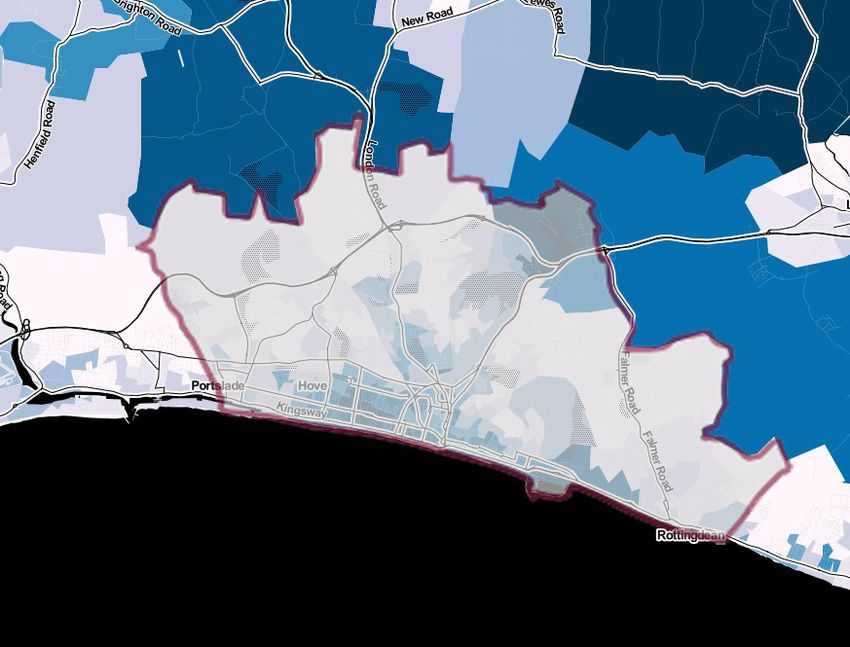
Brighton & Hove Non-gas Map
As a coastal city, Brighton’s off-gas grid
properties are found in a similar pattern to
those in Blackpool. Most are concentrated
along the coast in areas that are amongst the
most densely populated in Britain. These areas
of the city also suffer some of the highest
rates of fuel poverty, typically between 15%
and 20%.
Given the tightly packed nature of the city,
the vast majority of fuel poor households are
within 23 metres of the gas grid, making
connections far less logistically difficult than
rural connections, for example.
Local authority boundary
27Brighton & Hove: Comparison of Depravation and Off-gas grid by LSOA
National depra- % of house- % of properties Proportion of Proportion of
LSOA code vation rank holds that are off-gas grid off-gas grid off-gas grid
(1 to 32,844) fuel poor within 23m of within 50m of
grid grid
030C 339 9.7% 82.4% 99.4% 100%
031C 458 6.5% 80.7% 96.1% 100%
027C 2,353 17.3% 78.2% 78.9% 100%
029C 5,080 14.8% 94.4% 96.7% 100%
28Recommendations
As a result of the costs and benefits detailed above, EUA would recommend that first time central
heating should be a core feature of any future Government energy efficiency or fuel poverty
reduction strategy.
Unfortunately, first time central heating has often been overlooked as a tool for reducing fuel poverty.
The Gas Distribution Networks (GDNs) are required by Ofgem to connect fuel poor customers to the
gas grid. However, the ambition of this requirement is small – comprising just 91,203 connections be-
tween 2013 and 2021.
Discussions with the GDNs have revealed that the main barrier to connecting fuel poor customers is
finding a funding provider for the new heating system. By increasing the ambition of the regulatory re-
quirement to connect homes and providing funding under a Government scheme for first time heating
systems, a significant improvement could be made on the current state of affairs.
EUA are making the following recommendations that this report demonstrates can take households
out of fuel poverty.
1. Amend the Energy Company Obligation scheme to focus on first time central
heating systems for the fuel poor. This could save 139,130 homes a minimum of
£922 per year.
The Government’s Spending Review in 2015 announced plans for a supplier obligation to run for 5
years from April 2017 at an estimated level of £640m per year. Based on whole central heating cost
estimates of £4,600 approximately 139,130 homes could receive a first time central heating system
every year through ECO. This would not be funded by general taxation and as it is already a
commitment the energy companies have to meet it will not cause an increase in energy bills. We would
argue that as it is easier to locate people off the gas grid it may reduce administration costs and so
lead to slightly lower energy bills. For homes in fuel poverty the cost of a first time central heating
system is too great for them to be able to afford without help. However the bill savings of £922 means
it has a greater value for money than solid wall insulation and better annual bill savings than fabric
measures such as cavity wall insulation and loft insulation. As our analysis shows having no boiler is a
major indicator of fuel poverty.
2. Remove the cap on first time connections through the Fuel Poor Network Extension
Scheme (FPNES)
Currently the Gas Distribution Networks are only allowed to connect 91,203 homes to the gas grid up
to 2021, approximately 11,400 homes a year. EUA is calling on the government to remove this cap and
allow the GDNs to connect any home that is in fuel poverty. As the report shows the cost of
connecting a home that is 23 meters from the gas mains is minimal. Currently the major barrier to
connecting homes to the grid is that a central heating system has to be agreed and funded before the
connection can be signed off. As the FPNES is operated by Ofgem, and ECO by BEIS, there is a
disconnect between government offices. EUA is calling for this to be simplified and that the two
scheme operate together to identify fuel poor homes not on the gas grid, to arrange for the central
heating system funding and then the connection. By making this simple change it could allow for
approximately 139,130 homes be connected every year. Our discussion with the GDNs indicates that
they would welcome the opportunity to connect more properties and that this would not cause an
increase in costs that would be carried over onto household energy bills.
293. Fuel poverty schemes would be more effective if they operate on a street by street
approach
Currently ECO operates on a relatively isolationist basis. This means that properties are identified
individually and not part of a neighbourhood approach. There have been schemes run in conjunction
with local authorities and community groups but these are the exception and not the norm. We are
calling on the government to look at ways to favour street by street approaches to tackling fuel
poverty. With first time connections to the grid it will be more cost effective to connect a number of
homes rather than on an individual basis. As our case studies show many of the inner city areas that
are not connected are closely clustered. They would therefore benefit from a community approach. This
would also allow people that are not in fuel poverty but that are also not on the grid to connect at the
same time, if they are able to pay, but the overall costs should be lower making the cost very afforda-
ble. This would have the benefit of allowing households that are not officially in fuel poverty to benefit
from the bill savings we have outlined. This would not only benefit the UK economy but also help those
families are only have a limited amount of disposable income and any new economic downturn could
be pushed into fuel and absolute poverty. EUA would ask that the new ECO scheme consult of
measures that will improve and facilitate a street by street approach.
4. Better cross departmental data sharing to help identify fuel poor households
For many years fuel poverty campaigners have been calling on the government to allow different
departments to share data to enable fuel poor homes to be more easily identified. The benefit of
focussing on first time gas grid connections is that the GDNs and energy suppliers should be easily
able to locate properties that are not connected to the grid. However they would then have to identify
those that are in fuel poverty. This would be simplified by allowing energy companies to cross
reference connection data to data held by the Department for Work and Pensions (DWP). This one step
could generate an accurate list of all properties that are eligible for the ECO scheme and without a gas
boiler and therefore likely to be in fuel poverty as evidenced by the research in this report. This would
reduce costs for the energy companies in delivering ECO allowing them to retrofit more homes, lower
administration costs and potentially lower the pressure ECO has on domestic energy bills.
EUA believes that by making these four changes to fuel poverty policy in the UK, homes that need help
in reducing their energy bills could receive it in a more effective manner than is achieved today. We
accept that energy efficiency is more than just the heating appliance and that fabric measures should
also be included. However cost effective fabric measures have less impact on taking households out of
fuel poverty. Therefore we believe it is right to target the biggest bill saving first and then
subsequent energy efficiency schemes can look at tackling the other measures that may help further
bring costs down.
Having affordable heating is also more important than just in reducing bills. As the health information
in the report shows, having reliable and affordable heating helps reduce costs on the NHS and has
wider societal benefits. The UK has the best gas heating delivery mechanism in the world, that delivers
affordable heat to millions of homes, EUA believes the government should help all homes benefit from
it.
30You can also read