CLIMATE CHANGE EFFECTIVE ACTION BASED ON ENHANCED UNDERSTANDING - South African Food Sovereignty Campaign
←
→
Page content transcription
If your browser does not render page correctly, please read the page content below
A Climate Science Future for South Africa

                                         CLIMATE CHANGE
                 EFFECTIVE ACTION BASED ON ENHANCED UNDERSTANDING
                            Professors Bob Scholes, Francois Engelbrecht and Coleen Vogel
                              Global Change Institute, University of the Witwatersrand*

What is climate change?
‘Climate change’ in the sense in which it is used in the media and in everyday, non-technical conversation in the
present time, means change in the expected behaviour of the climate, based on our past experience. More
precisely, it means that the statistical properties of the climate system have changed in a significant way since the
beginning of the ‘modern era’, which is loosely taken to mean the start of the Industrial Revolution, around 1750.
Since accurate scientific records of the climate mostly only began after the middle of the 19th century, sometimes
1850 is used as the start. It makes little difference which start date we choose, because the climate changed very
little between 1750 and 1850. In contrast, the climate has changed a lot since 1850, and especially after 1950.
By ‘statistical properties’ we mean either the average value of a climate feature such as temperature or rainfall, or its
variability and extremes within the year. ‘Weather’ is the state of the climate system at any given moment. By its
nature, the weather changes all the time – between day and night, for instance, or from one day to the next. To
constitute ‘climate’, these short-term fluctuations are accumulated over a long period, over which we would expect
them to be smoothed out. In practice, we do this averaging over a period of about three decades. This should
eliminate the effects of natural cycles, such as through a day and a year, but also known longer cycles, such as the 11-
year sunspot cycle. It should also take care of events that are recurring, but not strictly according to a fixed cycle,
such as volcanic eruptions, or El Niño Southern Oscillation (ENSO) - related droughts. If these long-term climate
statistics are not stable over time, then something fundamental is changing in the Earth’s climate system.
When scientists refer to the ‘climate system’, they are talking about much more than just the atmosphere. In fact,
the atmosphere is rather a minor player, because it has a very limited ability to store energy. The atmosphere, at a
global scale, basically just behaves as the oceans and ice bodies dictate, because that is where all the energy is. It is
mostly through the ocean that most energy moves between the equator, where it is hot, and the poles, where it is
cold. This is the ‘heat engine’ that drives the weather.
The biosphere (the living part of the Earth) also participates in the climate system, because the biosphere is the
biggest store of carbon, and takes up or supplies carbon-dioxide to the atmosphere. Humans are also part of the
biosphere, and we have altered the make-up of atmosphere by speeding up the emission of carbon dioxide, and
other greenhouse gases (see Box 1 for an explanation of what these are), principally by burning fossil fuels. So when
we talk about measuring changes in the climate system as a whole, we are also talking about things like sea level rise,
the area and volume of ice caps, and the concentration of greenhouse gases in the atmosphere, along with more
familiar things like rainfall and the air temperature. ‘Global warming’, in other words, the rising near-surface air
temperature, is part of climate change, but not the only part.
A changing climate can be due to natural processes such as changing amounts of solar radiation or volcanic
eruptions. There is very strong evidence, however, that climate change over the past century and a half is due to
human-caused effects (the technical term is ‘anthropogenic’) (IPCC 2014). The two main anthropogenic causes of
climate change are changes in the concentration of greenhouse gases in the atmosphere (these are gases, present in
relatively small amounts, that absorb solar radiation; see box), and changes in the vegetation cover of the land. If the
present-day climate is changing – which it is, without any shadow of doubt -- it hardly matters to the people who
have to deal with the consequences of that change whether the change was ‘natural’ or ‘human-caused’. You still
have to adapt. But when it comes to preventing climate change to reach dangerous levels in terms of unavoidable
impacts and costs, it is important to know the causes. We can do something about the climate change due to
human actions.
The climate change between 1850 and now is by far (>90%) human-caused (IPCC 2014). A part of the year-to-year
variability, on the one hand, is added by natural processes, but the long-term upward or downward trends we

*Contribution by GCI to EFS on public awareness of climate change, June 2020. Recommended Citation: Scholes, B.,
Engelbrecht, F. & Vogel, C. 2020. ‘Climate Change: Effective action based on Enhanced understanding,’ Emancipatory
Futures Studies, Climate Science Think Piece, Wits.
                                                             1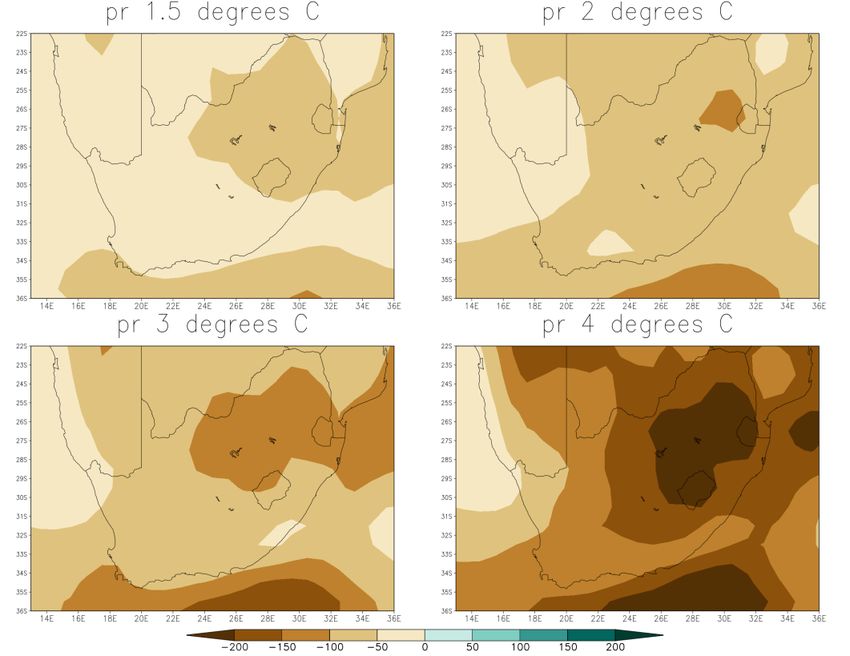
observe in the long-term records are not caused by any known
Box 1: Greenhouse gases
natural process. On the other hand, they can be fully explained by
what we know about changes in the atmospheric composition and The atmosphere of planet Earth is 78%
the land cover. nitrogen and 21% oxygen, and has been that
way for millions of years. Both of those gases
are quite transparent to solar energy, both
What does it mean for Southern Africa to be coming in and going out. But the remaining 1%
designated a climate change ‘hot spot’? contains a whole list of ‘trace gases’ that are
transparent to radiant energy at the
Several studies, most notably the very thorough and detailed wavelengths emitted by the sun (‘shortwave’),
reports of the Intergovernmental Panel on Climate Change (IPCC), but very absorptive of the energy in the
have shown that southern Africa is a climate change ‘hot-spot’ wavelengths leaving the earth (‘longwave’).
(Hoegh-Guldberg et al., 2018). In other words, this is a region more This is because of their molecular structure.
vulnerable than average to climate change. Two considerations go The atomic bonds in molecules of carbon
into identifying a climate change ‘hotspot’. The first is the amount dioxide (CO2), methane (CH4) and nitrous oxide
of climate change it has been and will be exposed to – is it (N2O) are just the right length to interact with
the outgoing radiation, absorb it, and thus
substantially more than the global average? The second is the
warm the atmosphere. That is what makes
ability of the natural and human systems in the region to cope with them ‘greenhouse gases’. We know the
that amount of change. Do they have features that make them greenhouse effect is real, because without it
more vulnerable than other regions, or are the consequences of the Earth would be a cold, lifeless place, like
change in the hotspot region more serious than in other places the moon. Or if our atmosphere had too much
(Scholes et al 2015). CO2, like Venus, it would be way too hot to
support life.
When scientist talk of an increase in the ‘global mean temperature’
of say 1C (which is what we have already observed since the start We have precise measurements of their
increase in concentration in the atmosphere
of the Industrial Revolution), they refer to an increase in the near-
over the past two centuries. They contribute
surface air temperature, averaged in an unbiased way over several respectively about 64, 17 and 6% of the
years, over both the sea and the land. Because three-quarters of present-day additional warming of the
the Earth’s surface is covered by ocean, and the oceans warm more atmosphere due to the ‘enhanced greenhouse
slowly than the land because of their huge capacity to suck up heat, effect’. About thirty other gases and particles
it follows that all land areas must warm at a faster rate than the collectively contribute about 13%. Water
global mean -- about one-and-a-half times faster is commonly vapour (H2O) is also a powerful greenhouse
observed. Southern Africa has warmed even faster than that, at gas, and is present in the atmosphere in
about twice the rate of global warming; and the climate models relatively large, but highly variable amounts.
suggest that this pattern of above-average regional warming will The effects of changing water vapour
concentration, and clouds of water and ice
continue for the rest of this century (Engelbrecht et al., 2015). The
droplets are taken into consideration in
reason is the location of southern Africa near the tropics, but climate models.
outside the equatorial high-rainfall zone. This is sunny South Africa,
and it gets sunnier in the future! The warming atmosphere reradiates the extra
energy it absorbs, and eventually this outgoing
In general, a warmer world is a wetter world, but that is radiation balances the incoming, and a new
unfortunately not true for southern Africa. When the world gets balance is reached; but right now we are still
warmer, we get drier on average. There are several processes at some way from that balance, which is why we
work here – one is the relatively high rate of temperature increase are experiencing Global Warming.
in southern Africa. Another is the southward movement of the
‘waves’ of cooler air that wash over southern Africa, particularly in winter, and bring rainfall to the Cape. A third is
changes in the global ocean circulation (the El Niño effect) that usually lead to a higher risk of drought periods lasting
several years at a stretch. Although southern Africa is likely to get drier in future, at the same time we are likely to
experience heavier floods. This is because although the rainfall declines overall, a larger fraction comes in the form
of big storms, which exceed the capacity of the land to soak up the water. It therefore rushes off, wastefully and
destructively.
The sea level is rising, slowly but inexorably, all over the world. The main reason up to now has been the warming
of the oceans, which causes the water to expand. As we continue warming the world, the main cause becomes the
melting of ice bodies currently on land, especially the very large ones in Greenland and Antarctica, which together
could contribute many meters of sea level rise. That they are melting and will continue to do so is proven, but the big
uncertainty is ‘how fast?’ It could take centuries, but if some unstable ice-shelves break off the continents suddenly,
we could see a much more rapid rise. The coastline of South Africa is relatively steep, so we can tolerate a small and
slow rise in sea level quite easily, but some African countries, including Mozambique are much more vulnerable. The
2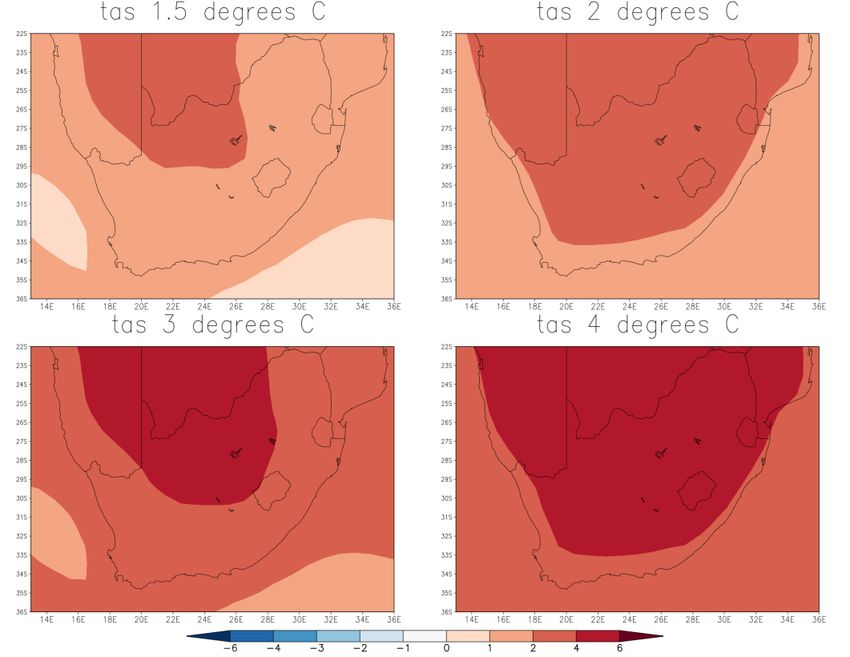
big problems come when a sea level rise coincides with a storm surge (more on that under ‘extreme events’) and a
naturally high tide. Substantial and more-rapid sea level rise, which is increasingly likely unless the world works
strenuously to keep the global temperature rise as small as possible, would wreak havoc on South African coastal
infrastructure as well, and would be disastrous for coastal cities all over the world.
On the ‘coping capacity’ side, southern Africa has several special circumstances that count against it. One is that it is
one of about ten ‘mega-diverse’ areas in the world, that have far more than their share of other species to look after.
Another is that southern Africa is made up of developing countries, which do not yet have very sophisticated
disaster management systems and infrastructures, nor money to spend on climate adaptation. A third is that our
economies are very sensitive to changes in the climate (for instance, in the agriculture and tourism sectors). Coal is
one of our main exports and the mainstay of southern African energy generation, but coal is the fossil fuel most likely
to be eliminated first from the global energy system.

What are the extreme weather impacts that South Africa can expect as global
temperatures increase?
Temperatures over southern
Africa have risen drastically
over the last six decades, at
about twice the rate of global
warming (Engelbrecht et al.,
2015). This relatively high
regional sensitivity to the
enhanced greenhouse effect is
large due to the region’s
location in the Southern
Hemisphere subtropics, a part
of the world already affected
by changing weather patterns
in a changing climate (see the
previous section for details).
Global climate models (GCMs)
project that under ongoing
global warming, the southern
African region will continue to
warm at a rate higher than the
global average (Figure 1). In
fact, even under strong
climate change mitigation as
required under the Paris            Figure 1: Projected increases in temperature (°C) over southern Africa under different
Agreement on Climate Change,        levels of global warming, as derived from the ‘ensemble average’ of 14 GCMs
                                    contributing to Assessment Report Six of the IPCC. The use of an ‘ensemble’- in other
where the increase in the global
                                    words, a set of different models running under the same assumptions - is more reliable
average surface temperature is
                                    than trying to pick just one ‘best model’.
restricted to 1.5-2 °C above pre-
industrial temperatures, regional temperature increases of 3-4 °C are likely over the southern African interior (Figure
1). Should the world fail to implement the Paris Agreement, and global warming reaches 3 °C or higher, regional
warming over the southern African region may be expected to be around 6 °C (Figure 1).
The relatively large increases in annual average temperature over southern Africa are projected to occur in
association with increases in extreme warm temperature events, and a reduction in extreme cold events (which are
not common in South Africa, anyway). Increases in the number of high fire-danger days, heat-wave days and very hot
days have been detected across the region in recent decades. Such events will occur even more frequently should
global warming increase to levels between 1.5 and 2 °C. Under 3 °C of global warming, the increase in heat-wave
duration and frequency is projected to be so severe that it may contribute to the collapse of both the maize crop
and cattle industry in large parts of southern Africa (Hoegh-Guldberg et al., 2018).
Southern Africa is likely to also become generally drier under future climate change (Engelbrecht et al., 2015; Hoegh-
Guldberg et al., 2018). This is a robust assessment of the Intergovernmental on Climate Change (IPCC), dating back to

                                                            3
its Fourth Assessment Report in 2007. Substantial decreases in annual rainfall can already be detected over South
Africa’s winter rainfall region, where the likelihood for extreme multi-year droughts to occur are already three times
higher than under natural climate variability. This is largely due to the systematic poleward displacement of cold
fronts in a warmer word. Rainfall decreases over southern Africa’s summer rainfall region can so far be most clearly
detected over the north-eastern interior, but are projected to become more widespread under 1.5 °C of global
warming (Figure 2). Under 2 °C of warming the projected decreases in rainfall become substantial, whilst under
higher levels of warming rainfall decreases and more frequently occurring multi-year droughts (Figure 2, Box 2) are
expected to directly threaten
the sustainability of dryland
agriculture in large parts of
southern Africa (Hoegh-
Guldberg et al., 2018).
Southern Africa is a generally
warm and dry region, even
without climate change. Many
organisms and environmental
processes lie close to their
tolerance limits for heat and
drought. Therefore, becoming
drastically warmer and drier
poses grave risks to the
environment and society. This
is a key reason why the region
has been identified as a climate
change hotspot by the IPCC
(Hoegh-Guldberg et al., 2018;
see also the previous section).
Some of these changes are
difficult to adapt to because of
their fundamental nature (see
the next section). Figure 2: Projected changes in rainfall (mm) over southern Africa under different levels
of global warming, as derived from the ensemble average of 14 GCMs contributing to
It may finally be noted that Assessment Report Six of the IPCC. Note that the tan and brown colours, which represent
despite these large-scale trends drier futures than at present dominate over the whole region, and the drying becomes
towards a generally drier climate, more pronounced with greater global warming.
Box 2: Recent multi-year droughts in southern Africa
Recent multi-year droughts in southern Africa have demonstrated how vulnerable the region is, should such events occur
more frequently as a consequence of anthropogenic climate change. The 2015-2017 Cape Town drought was associated with
three consecutive years of below-normal rainfall in South Africa’s winter rainfall region, which led to severe water
restrictions in the City of Cape Town and brought the city to the brink of running out of water (the “day zero” drought). The
period 2015-2017 was also exceptionally warm, and the Knysna and Garden Route fires of June 2017 occurred after the
warmest autumn in the region in recorded history. Climate statistics and modelling have since been shown that the risk of
such “day zero” drought to occur in South Africa’s winter rainfall region have already increased by a factor of three as a
consequence of climate change. The trends of increasing rainfall, increasing temperatures and increasing number of high fire-
danger days in South Africa’s winter rainfall region can be directly attributed to climate change – in particular the poleward
displacement of cold fronts in a warming climate. Multi-year droughts have also occurred on the summer rainfall regions of
southern Africa in recent years. Three consecutive years of below normal summer rains were recorded during the summers
of 2013/14 through to 2015/16, culminating in the devastating El Niño drought of 2015/16. This latter summer was the driest
in recorded history over the Free State and Northwest Provinces of South Africa, and the drought also impacted severely in
the KwaZulu-Natal, Mpumalanga and Limpopo Provinces, as well as in Kruger Park. Botswana lost 20% of its cattle in 2015,
and a further 2016 in 2016. In South Africa, the maize crop yields were substantially lower in 2016 compared to previous
years, and at the peak of the drought the level of the Vaal Dam fell to below 25%. The 2015/16 El Niño was the strongest
ever recorded by humans and co-occurred with the two warmest years (2015 and 2016) recorded by humans (at the time –
2019 now holds the record of the 2nd warmest year on record, after 2016). Climate change projections are indicative that
multi-year droughts over the summer rainfall region of summer Africa may occur more frequently under 1.5 °C of global
warming, with further increases under higher levels of global warming (Hoegh-Guldberg et al., 2018). This is partially related
to the more frequent occurrence of strong El Niño events in a warmer climate.
4it is plausible that extreme rainfall events will occur more frequently across the region. Over Mozambique and
southwards into the north-eastern parts of South Africa, the risk that intense tropical cyclones will reach the land is
higher than in the past under even 1.5 °C of global warming, and substantially higher under higher levels of global
warming. Intense thunderstorms causing hail, flash floods and damaging winds are also expected to occur more
frequently across eastern southern Africa, in response to enhanced surface warming. The increased likelihood of
weather systems that deliver heavy rainfall over relatively short periods of time has implications for flooding, soil
erosion and the design of roads, bridges and dams.
When a large storm occurs over the ocean, it pulls water from far and wide under it, and the high winds whip up the
waves. This is known as ‘storm surge’, and can amount to a local sea level rise of many meters. When added to the
steadily-rising base sea level, and especially if the storm coincides with a high tide when it makes landfall, the result is
‘wave run-on’ to the land that can cause flooding far inland of the normal coastline. This has already been
experienced in southern Africa, especially on the subtropical east coast, and the likelihood of such severe floods
increases in the future due to the cumulative effects of sea level rise and increasing storm intensity (Figure 3).
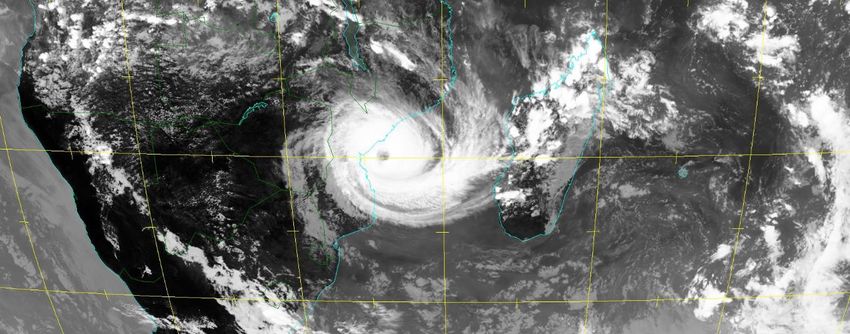
Figure 3: A satellite image of Tropical
Cyclone Idai making landfall at Beira in
Mozambique around midnight on 14
March 2019. More than 1000 people in
Malawi, Zimbabwe and Mozambique
lost their lives in the flooding and
destruction caused by this weather
system, making it the worst flood
disaster in the recorded history of
southern Africa, and the 2nd worst on
record in the Southern Hemisphere.
Hundreds of people died in Beira due
to a storm surge that was several
meters high. (Source: Meteosat Second
Generation)
The implications of climate change for South Africa
The IPCC, in its Special Report on Global Warming of 1.5°C, assessed that the largest reductions in economic growth
under continued Global Warming are likely to occur in low- and middle-income countries and regions in the tropics
and Southern Hemisphere subtropics, including southern Africa (Hoegh-Guldberg et al., 2018). A comprehensive
estimate of the future costs of climate change is not available for South Africa. However, the country has in recent
years experienced a number of high-impact climate events, particularly extreme droughts, and floods. These events,
of the early 1990s drought in the region, give us glimpses of what we may experience going into the future in terms
of costs to the economy (Box 3).
The costs of flood impacts (Table 1) can be easier to estimate because they are often shorter in duration (a few days)
and have a clear impact area, as opposed to droughts that can be creeping over a number of years and affect an
entire region in various ways.
Box 3: Estimating climate related costs in South Africa
The chain of impacts resulting from extreme climate events are messy and complex, often defying simple additive
‘counting’. For example, although agriculture accounts for a relatively small contribution to overall GDP in South Africa,
the impacts of unfavourable climate are felt by a large number of people, via agricultural employment, as well as by rising
food prices and hunger. The 1992 drought (Benson and Clay, 1994: 32), for example, ‘was expected to have a net negative
effect of at least R1,200m on the current account of the balance of payments. Other studies simulated that a 14% decline
in agricultural sector value added would result in a 1.8 % decline in GDP, representing around US$500 million (Benson and
Clay, 1994:32Pretorius and Smal, 1992). In terms of employment, the drought was estimated to have resulted in the loss
of 49 000 agricultural jobs and 20 000 formal sector jobs in non-agricultural sectors (Benson and Clay, 1994:32). As the job
losses escalate they cascade beyond those directly dependent on agricultural employment, eventually impacting around
250 million people (Mniki, 2009). Counting the full costs is similarly difficult for other climate-linked phenomena, such as
severe heat spells, fires and floods. Even the partial accounting that we are able to do demonstrates that the costs of
climate change are very high. Since impact costs are felt year after year, while the costs of climate change mitigation are
mostly experienced early in the process, impact costs rapidly mount up and exceed mitigation costs unless you assume
that future costs are much less important than present costs (an ethical issue in economics, known as the ‘discount rate’).
5Table 1: Examples of flooding impacts and costs (Note that these events occurred at rather different scales: a whole
province, part of a province, or portion of a coastline)
Year of flood Impacts Estimated Costs and losses
1987 flooding KZN 14 bridges washed away; 68 000 Not available
people homeless, 388 lives lost.
Cut off low flooding November 2007, Estimates of damages over 22 Direct damage cost – R 793,523,179;
Western Cape municipalities impacting 298 425 Direct damage cost per household over
households. the 22 municipalities – R 2,659.04
2008 storm surge western, southern Damage to coastal property and Estimated at R1 billion
coasts of South Africa infrastructure
Sources: Grobler, 2003; Disaster Mitigation for Sustainable Livelihoods Programme, 2010; Smith, 2013: Davis-Reddy and Vincent,
2017.
Floods come in various forms and can range from impacts at the provincial scale as induced by weather systems such
as tropical cyclones and cut-off lows, to smaller scale flash-floods caused by intense thunderstorms. In the western
Cape for the period 2003-2008, national departments and parastatals sustained ‘direct damage costs exceeding R221
million in 8 severe weather events’ (RADAR, 2010:99). The Provincial Road Department reported damage costs of
more than R600 million over the same period. 636 farms recorded damages in ‘excess of R765 million from
November 2007-November 2008.’
The impacts of climate change and climate variability are complex in both their causes and their consequences (IPCC,
2014; Satgar, 2018; Ziervogel et al., 2019). This makes it hard to say that a particular impact is clearly and solely due
to a particular cause (see Box 4), but it is increasingly possible to assign probabilities that climate change contributed
to the observed damages. The impacts, costs and losses are not the result of only a climate hazard (e.g. a flood and
excessive heat) but are also linked to a range of ‘threat multipliers’ and ‘drivers of vulnerability’ including
development, service delivery and access to water and food.
Box 4: Climate change attribution
“Climate change attribution” refers to the scientific analysis process used to determine to what extent recent changes (i.e.
changes observed over the last few decades) in climate were caused by human actions, particularly in the form of the
enhanced greenhouse effect. That is, climate change attribution strives to distinguish trends in climate caused by human
activities from natural variability (e.g. long-term cycles) and trends induced by natural processes. This includes the
attribution of trends in extreme weather events to the underlying cause (or more frequently, causes), as well as the analysis
of whether individual extreme events that have occurred, have been made more likely to occur by anthropogenic forcing.
The IPCC has in its recent Special Report on Global Warming of 1.5 °C concluded that it is virtually certain that the systematic
Global Warming observed in recent decades can be directly attributed to anthropogenic forcing. The strong regional trend of
increasing temperature and associated substantial increases in heat-wave days and high fire-danger days in southern Africa
have similarly been attributed to anthropogenic forcing (Hoegh-Guldberg et al., 2018), as a regional consequence of Global
Warming. The most discernible trends in rainfall that can be detected over southern Africa are the rainfall decreases that
have occurred in recent decades over those parts of the region that receive winter rainfall, namely the south-western Cape
and the Cape south coast. These decreases can likely be attributed to the systematic poleward displacement of cold fronts
that have been detected in the Southern Hemisphere over the same period as a consequence of anthropogenic forcing. Few
studies have to date been performed to explore whether individual extreme weather events that have occurred in southern
Africa can be attributed to anthropogenic forcing. One important recent attribution study concluded that occurrence of the
Cape Town drought of 2015-17 has been made at least three times more likely because of systematic anthropogenically
induced climate change. Moreover, attribution studies have determined that tropical cyclones are causing 10-20% more
rainfall than in the past as a consequence of being able hold more moisture in an anthropogenically warmer world, and that
intense tropical cyclones have started to occur more frequently over the last several decades. These studies strongly suggest
that tropical cyclone Idai has been made more intense and destructive by Global Warming, although a formal attribution
study remains to be undertaken for this event.
6Responding to climate change
How do we respond to change in the global climate that has expression locally? Responses include both mitigation
and adaptation. The IPCC (2014) describes mitigation as “a human intervention to reduce the sources or enhance
the sinks of greenhouse gases (GHGs)”, while adaptation is the adjustment process to actual or expected climate
and its effects. “In human systems, adaptation seeks to moderate or avoid harm or exploit beneficial opportunities”
(IPCC, 2014: 118, 125). These two categories are not completely independent. Often there are interactions between
mitigation and adaptation, which can be beneficial (co-benefits) or harmful (unintended consequences).
The time frames with which we prepare and intervene are also critical considerations. Do we just manage to get by,
and brace ourselves for the next flood and drought, or do we prepare for the next decades where droughts and floods,
amongst other climate challenges, may become a ‘new normal? As a result of different perspectives, adaptation is
sometimes seen as incremental (shorter-term changes to respond to climate risks) or transformative (a change in the
fundamental attributes of natural and human systems, IPCC, 2014:128).
The way you ‘frame’ the issue therefore matters, both in terms of how we measure ‘loss’ and what we mean by costs.
For whom, and how, do we derive such costs? Our approach can also significantly shape what we do in practice and
how we begin to reduce risks (Leach et al., 2010) See table 2.
Adaptation and the adaptation pathways
chosen for the future are also not politically
neutral (Giddens, 2009). Allied to the pathways
or transitions that we may choose (for example
the Just Transition widely under discussion in
South Africa) are the calls for technocratic
adaptation options (such as the construction of
sea walls against sea level rise, desalinisation
plants to relieve water storages, biotechnology
to adapt crops to higher temperatures, etc.)
and also personal transformations (Figure 4). All
these adaptations are related to and informed
by individual and collective assumptions,
beliefs, values and world views (O’ Brien and
Sygna, 2013; Leichenko and O’Brien, 2019; see
also IPCC, 2014, page 96).
The adaptations we choose are therefore
influenced to some degree by world views,
personal beliefs and value systems. A range of
questions need to be addressed if we are to
successfully adapt to climate change (Table 2).
Further examples of actions taken to adapt to
climate change, in the context of South Africa, Figure 4: Transformations: practical, political and personal suggested to
include those in water management (water effectively deal with climate change and other challenges (Source: Adapted
conservation through reduction of wastage, from O’Brien and Sygna, 2013; adapted by S. Smit 2020
construction of storage capacity in dams and
aquifers, recycling and purification, and reducing the demand for water by developing more efficient processes or by
altering the price of water); improved agricultural practices (for instance agricultural systems that store carbon in the
soil, use rainfall and irrigation more effectively, and include crops that are more resilient to drought); better access and
entitlement to basic resources for life, such as food, energy and water; better disaster risk reduction (for example
effective early warning systems, leading to proactive hazard and disaster response, and better tracking and capturing
of disaster loss information in order to avoid future disasters.) In all these cases, however, trade-offs and contestation
in assessment of issues and decision-making approaches adopted (e.g. whose voices count and ‘who is at the table’)
and what becomes priority interventions are challenges that can and usually do arise.
7Table 2: Examples of types of adaptive and systems change
Types of change Incremental Reform Transformation
Core questions How can we do more of What rules shall we create? How do I make sense of this?
the same?
What structures and What is the purpose?
Are we doing things right? processes do we need?
How do we know what is best?
Purpose To improve performance To understand and change To innovate and create previously
the system and its parts unimagined possibilities
Power and Confirms existing rules. Opens rules to revision. Opens issues to creation of new ways of
relationships Preserves the established Suspends established power thinking about and enacting power.
power structures and relationships. Promotes transformation of relationships
relationships among with whole-system awareness and
actors in the system. identity. Promotes examining deep
structures that sustain the system.
Archetypical Copying, duplicating, Changing policy, adjusting, Visioning, experimenting, inventing
actions mimicking adapting
Logic Negotiation logic Mediation logic Envisioning logic
Source: Adapted from Waddell, 2011 and Waddock et al, 2015
The role of the ‘view’ and the ‘eyes’ (Andreottie and de Souze, 2007) we use to frame our adaptation and
transformation are evident in how various people are responding to climate risks. For some in the business
community (e.g. UN Global Compact and UN Environment Programme, 2012) adaptation may be more of a
technocratic approach, including sustainable supply chain management, health and safety and community
engagement projects. Those in government may focus on adaptation efforts that reduce climate risks in the form of
policy, institutional and governance arrangements. Non-Governmental and civil society organisations often take a
very practical ‘hands on’ approach, working to effect fair, just and sustainable change.
For some, however, a ‘transformation’ is also urgently called for in the personal, practical and political spheres of our
lives (Figure 4). Here the focus is on changing the design of practices that are fundamentally making us vulnerable to
climate risks in the first place. Examples are transformations that lead to enhanced access to jobs and employment,
greater equity in the economic system and a re-imagining and implementation of a just and fair economy.
Many views (e.g. pluralistic views) need to be considered when trying to co-plan and co-build robust lives in the case
of climate change and climate variability (Andreottie and de Souza, 2007):
“Perhaps we need to promote a new conceptualization of wealth in the world – as productive, social
relationships – and educate ourselves and our children accordingly” (Andreottie and de Souza, 2007,
preface).
In an article “What climate collapse asks of us”, from The Emergence Network, the author Akomolafe (2020) cites
Butler (referring to the United States of America):
“The greatest challenge the Anthropocene poses isn’t how the Department of Defence should plan for
resource wars, whether we should put up sea walls to protect Manhattan, or when we should abandon
Miami. It won’t be addressed by buying a Prius, turning off the air conditioning or signing a treaty. The
greatest challenge we face is a philosophical one: understanding that this civilization is already dead. The
sooner we confront our situation and realize that there is nothing we can do to save ourselves, the sooner we
can get down to the difficult task of adapting, with mortal humility, to our new reality” (emphasis added).
What are some of the crucial lessons we have learned from the COVID-19 pandemic that can be used for reducing
risks to ongoing climate change? The pandemic is showing us that a collective and just approach is needed that is
mindful of local, regional and global vulnerabilities. Moreover, the pandemic is urgently demonstrating that a
proactive rather than a reactive response is required. The big questions that remain are “are we up to the challenge”
and “what may it take to bring about effective sustainable change?”
8References
Andreotti, V. and de Souze, L.M.M. 2007. Learning to read the world Through Other Eyes, CSSGJ, Univ. Canterbury,
www.throughotherheyes.org.uk.
Benson, C. and Clay, E., 1994. The impact of drought on Sub-Saharan African economies: a preliminary examination, Working
Paper 77, Overseas Development Institute.
Butler, J., cited in Akomolafe, A. 2020. What Climate collapse asks of us, The Emergence Network.
http:bayoakomolafe.net/project/what-climate-collapse-asks-of-us/
Engelbrecht F.A., Adegoke J., Bopape M-J., Naidoo M., Garland R., Thatcher M., McGregor J., Katzfey J., Werner M., Ichoku C. and
Gatebe C. 2015. Projections of rapidly rising surface temperatures over Africa under low mitigation, Env. Res. Letter. 10
085004.
Davis-Reddy, C. and Vincent, K. 2017. Climate Risk and Vulnerability: A handbook for Southern Africa (2 nd edition), CSIR, Pretoria,
South Africa.
Disaster Mitigation for Sustainable Livelihoods Programme. 2010. RADAR Western Cape 2010, Risk and Development Annual
review.
Giddens, A. 2009. The Politics of Climate Change, Polity, Cambridge, UK.
Hoegh-Guldberg, O., D. Jacob, M. Taylor, M. Bindi, S. Brown, I. Camilloni, A. Diedhiou, R. Djalante, K.L. Ebi, F. Engelbrecht, J.
Guiot, Y. Hijioka, S. Mehrotra, A. Payne, S.I. Seneviratne, A. Thomas, R. Warren, and G. Zhou. 2018. Impacts of 1.5ºC
Global Warming on Natural and Human Systems. In: Global Warming of 1.5°C. An IPCC Special Report on the impacts of
global warming of 1.5°C above pre-industrial levels and related global greenhouse gas emission pathways, in the
context of strengthening the global response to the threat of climate change, sustainable development, and efforts to
eradicate poverty [Masson-Delmotte, V., P. Zhai, H.-O. Pörtner, D. Roberts, J. Skea, P.R. Shukla, A. Pirani, W. Moufouma-
Okia, C. Péan, R. Pidcock, S. Connors, J.B.R. Matthews, Y. Chen, X. Zhou, M.I. Gomis, E. Lonnoy, T. Maycock, M. Tignor,
and T. Waterfield (eds.)].
IPCC. 2014. Climate Change 2014: Synthesis Report. Contribution of Working Groups I, II and III to the Fifth Assessment Rpeort of
the Intergovernmental Panel on Climate Change [core writing team, R.K. Pachauri and L.A. Meyer (eds.)], IPCC, Geneva,
Switzerland, 151 pp.
Leach, M., Scoones, I. and Stirling, A. 2010. Dynamic Sustainabilities: Technology, Environment, Social Justice. London, Earthscan.
Leichenko, R. and O’Brien. K. 2019. Climate and Society, Transforming the Future. Polity, Cambridge, UK.
Mniki, S. 2009. Scocio-economic impact of drought induced disasters on farm owners of Nkonkobe Local Municipality, University
of the Free State, South Africa.
National Consultative Forum on Drought, Ops Room. 1992. The current drought situation in South Africa, Update no. 5, Auckland
Park, Johannesburg, South Africa.
O’Brien, K. and Sygna, L., 2013: Responding to climate change: The three spheres of transformation. In Proceedings
Transformation in a Changing Climate (pp. 16 – 23). Retrieved from
http://www.worldsocialscience.org/2014/03/transformation-changing-climate/.
Pretorius, C. and Smal, M. 1992. Notes on the macro-economic effects of drought, Quarterly Bulletin – South African Reserve
Bank, pp. 31-38.
Satgar, V., (ed.). 2018. The Climate Crisis, South African and Global Democratic Eco-socialist alternatives, Wits University Press.
Scholes, RJ, MC Scholes and M Lucas. 2015. Climate Change: Briefings from southern Afric, Wits University Press, 260 pp. EAN:
978-1-86814-918-6
Smit, S. 2020. Exploring the value that youth change agents in Gauteng attach to Environmental Sustainability, unpublished
Masters in the School of Governance, University of the Witwatersrand.
UN Global Compact and UN Environment Programme. 2012. Business and Climate Change Adaptation: Toward resilient
Companies and Communities.
Waddell, S. 2011. Global Action Networks: Creating our Future Together. Hampshire, UK: Palgrave-McMillan.
Waddock, S., Meszoely, G., Waddell, S., & Dentoni, D. 2015. The complexity of wicked problems in large scale change, Journal of
Organisational Change, 28(6), 993-1012.
Ziervogel, G., Pasquini, L., Taylor, A. and New, M. 2019. Climate change challenges in African cities: four perspectives on progress
and opportunities, In: D. Scott and M. New, Mainstreaming Climate Change in Urban Development, UCT Press, 11-39.
9You can also read