The Population History of Extant and Extinct Hyenas Nadin Rohland,* Joshua L. Pollack, Doris Nagel,à Ce dric Beauval, k Jean Airvaux,# Svante ...
←
→
Page content transcription
If your browser does not render page correctly, please read the page content below
The Population History of Extant and Extinct Hyenas
Nadin Rohland,* Joshua L. Pollack, Doris Nagel,à Cédric Beauval,§k{ Jean Airvaux,#
Svante Pääbo,* and Michael Hofreiter*
*Max Planck Institute for Evolutionary Anthropology, Leipzig, Germany; Department of Integrative Biology, University
of California, Berkeley; àInstitute of Palaeontology, University of Vienna, Vienna, Austria; §Institut de Préhistoire
et de Géologie du Quaternaire (C.B.), Université Bordeaux 1, Talence Cedex, France; kArcheosphere, Domaine
de Haut-Carré, Université Bordeaux 1, Talence, France; {UMR 5199 PACEA, Laboratoire d’Anthropologie des
Populations du Passé (B.M.), Universite Bordeaux 1, Talence Cedex, France; and #Service Régional
de l’Archéologie de Poitou-Charentes, Centre Régional d’Archéologie, Poitiers, France

       We have analyzed partial DNA sequences of the mitochondrial cytochrome b gene from extant striped, brown, and spotted
       hyenas as well as from Pleistocene cave hyenas. Sequences of the Pleistocene cave hyenas from Eurasia and modern
       spotted hyenas from Africa are intermixed in phylogenetic analyses, questioning any taxonomic delineation between
       the two groups. Contrary to cave hyenas in Eurasia, spotted hyenas in Africa show a phylogeographic pattern with little
       geographical overlap between two mitochondrial DNA (mtDNA) clades, suggesting two Pleistocene refugia in the north
       and south of Africa. Our results, furthermore, suggest three waves of migration from Africa to Eurasia for spotted hyenas,
       around 3, 1, and 0.3 MYA. A recent emigration of striped hyenas from Africa to Eurasia took place less than 0.1 MYA,
       resulting in a dramatic expansion of the geographical range of striped hyenas. In striped hyenas and within the geographical
       range of mtDNA clades in spotted hyenas, we found identical sequences several thousand kilometers apart, indicating
       a high rate of migration during the Pleistocene as well as the Holocene. Both striped and brown hyenas show low amounts
       of genetic diversity, with the latter ones displaying just a single haplotype.

Introduction
      The four extant hyena species (spotted hyena, striped                  We have assessed the population history of the extinct
hyena, brown hyena, and aardwolf) are the remnants of                   cave hyena as well as the extant spotted, striped, and brown
a large radiation that reached its peak about 5 MYA and                 hyenas by sequencing 340–366 bp of the mitochondrial
contains more than 100 fossil species. (Supplementary Ma-               cytochrome b gene.
terial online). While the aardwolf (Proteles cristatus) is
highly specialized, in that it feeds only on termites (Bothma           Materials and Methods
1998; Bothma and Walker 1999) and belongs to its own                    DNA Extraction
subfamily (Protelinae), the other three species, spotted
hyena (Crocuta crocuta), striped hyena (Hyaena hyaena),                       We extracted DNA from 78 Pleistocene cave hyena
and brown hyena (Parahyaena brunnea) (subfamily                         (C. crocuta spelaea) samples, originating from 27 locations
Hyaeninae), hunt and scavenge (Bothma and Walker                        across Europe and Asia (Supplementary Table 1, Supple-
1999). The spotted hyena, genus Crocuta, which currently                mentary Material online) and from 46 museum samples
occurs only in Africa, inhabited large parts of Eurasia                 (23 spotted hyenas, 13 striped hyenas, and 10 brown hye-
during most of the Pleistocene (Kurten 1968; Werdelin                   nas; Supplementary Table 1, Supplementary Material on-
and Solounias 1991; Kahlke 1994). The Eurasian members                  line), covering the current and historical ranges of the
of the genus Crocuta are usually described as ‘‘cave                    three extant species. DNA from 40 museum samples were
hyenas.’’ While a close relationship between spotted and                extracted following the methods of Rohland, Siedel, and
cave hyenas is widely accepted, both subspecies (Crocuta                Hofreiter (2004), whereas 6 additional museum samples
crocuta spelaea, e.g., Kurten 1957, 1968; Turner 1984;                  and the Pleistocene samples were extracted as described
Werdelin and Solounias 1991) and species status (Crocuta                by Hofreiter et al. (2004a).
spelaea, e.g., Soergel 1937; Musil 1962; Markova et al.
1995; Baryshnikov 1999) are discussed for cave hyenas.                  Polymerase Chain Reaction and Analyses
The fossil record of the striped hyena is controversial, as
                                                                              Amplification of Pleistocene DNA was done as de-
some authors (e.g., Kurten 1957, 1968) have argued that
                                                                        scribed by Hofreiter et al. (2004), using annealing temper-
striped hyenas occurred in the Mediterranean during the
                                                                        atures between 42°C and 52°C, depending on the primer
Pleistocene, while others argue for an exclusively African
                                                                        pair. We reconstructed a 366-bp fragment of the mitochon-
record from Ethiopia to South Africa (e.g., Werdelin and
                                                                        drial cytochrome b gene, either in four overlapping frag-
Solounias 1991; Bothma 1998). In contrast, fossil remnants
                                                                        ments or, when only amplification of shorter fragments
of brown hyenas are known only from southern Africa,
                                                                        was possible, in seven overlapping fragments (Supplemen-
and thus they seem never to have inhabited a large area
                                                                        tary Material online). Reamplification (when necessary),
(Turner 1990).
                                                                        cloning, and sequencing were done as described previously
                                                                        (Hofreiter et al. 2004a). For each segment, a minimum of six
                                                                        clones, three from each of two independent amplifications,
    Key words: ancient DNA, migration, out-of-Africa, Pleistocene,
phylogeography.
                                                                        were sequenced. If all clones from the first amplification
     E-mail: hofreiter@eva.mpg.de.
                                                                        consistently differed from all clones from the second ampli-
                                                                        fication at one or more positions, a third amplification was
Mol. Biol. Evol. 22(12):2435–2443. 2005
doi:10.1093/molbev/msi244                                               done from the extract to determine which sequence was re-
Advance Access publication August 24, 2005                              producible (Hofreiter et al. 2001a). DNA amplification and
Ó The Author 2005. Published by Oxford University Press on behalf of
the Society for Molecular Biology and Evolution. All rights reserved.
For permissions, please e-mail: journals.permissions@oupjournals.org
2436 Rohland et al.

sequencing for the museum specimens were done as de-
scribed by Rohland, Siedel, and Hofreiter (2004). Mock ex-
tractions without sample and polymerase chain reaction
(PCR) blanks were performed throughout all experiments
to monitor contamination.
      Altogether, 366 bp of the cytochrome b gene were am-
plified for spotted hyenas and 340 bp for brown and striped
hyenas. For striped and brown hyenas, we amplified a shorter
fragment as the sequence information available in GenBank
and necessary for primer design was limited in length for
these taxa when the experiments were done. Some of the
Pleistocene spotted hyena sequences have been described
elsewhere (AJ809318–AJ809332; Hofreiter et al. 2004b).               FIG. 1.—Median-joining network based on 366 bp of spotted/cave
Spotted hyena sequences from GenBank (accession num-           hyena cytochrome b mtDNA sequences. Yellow: East Asian cave hyena;
bers AY048805, AY048806, AY048810, AY048811, and               blue: northern African spotted/cave hyena group; black: southern African
                                                               spotted hyenas; red: exclusive European cave hyena group. Arrows indi-
AY048812), one striped hyena (AY153054) and one brown          cate cave hyena sequences. The haplotype also found in the Altai is marked
hyena (AY048789), were included in the analyses. All           with an asterisk.
newly determined DNA sequences were deposited in Gen-
Bank (accession numbers DQ157554–DQ157592).
      Sequences were aligned by eye, and phylogenetic          All affected fragments were amplified a third time to deter-
analyses were performed using the program package              mine the correct nucleotides for these positions. We recon-
PAUP* (Swofford 1998). Neighbor-joining and maximum            structed the complete 366-bp piece for 26 Pleistocene
likelihood trees were constructed using a Hasegawa-            samples originating from 17 locations from Western Eu-
Kishino-Yano substitution model with gamma-distributed         rope to East Asia. As we were mainly interested in the spe-
rates (Hasegawa, Kishino, and Yano 1985; Yang 1996)            cies-wide variation, we amplified the complete 366-bp
inferred by the program Modeltest (Posada and Crandall         piece from only a single specimen from all except one lo-
1998). To estimate the time to the most recent common an-      cation. At this location (Teufelslucke, Austria), we ampli-
cestor (MRCA), we used the program r8s (Sanderson              fied the 366-bp fragment from 10 different samples
2003). Phylogenetic trees used for molecular dating were       (representing a minimum of three individuals), all of which
rooted using domestic cat (Felis sylvestris) as out-group.     yielded the same sequence. This result together with the ob-
A median-joining network was constructed using the pro-        servation that partial sequences from additional samples
gram Network (Bandelt, Forster, and Röhl 1999).               from other locations were always identical to the complete
                                                               sequence from the respective locations (data not shown) in-
Dating                                                         dicates that local variation was small. Overall, we found
                                                               five haplotypes for Pleistocene cave hyenas from Eurasia,
     Several of the Pleistocene hyena fossils have been        none of which was shared with extant spotted hyenas. All
dated previously (Hofreiter et al. 2004b). In addition to      previously dated cave hyena fossils gave Late Pleistocene
these samples, two hyena fossils originating from Asia were    dates, ranging from 37,000 to .50,000 years B.P. (before
dated at the Leibniz Laboratory, University of Kiel,           present) (Hofreiter et al. 2004b). The two newly dated fos-
Germany, using accelerator mass spectroscopy dating.           sils from the Altai and East Asia fall into the same age range
                                                               with dates of 48,650 12,380/1,840 and 42,300 1940/
                                                               840 years B.P., respectively.
Results
                                                                      A network analysis (fig. 1) shows four groups of
      We amplified and sequenced 366 bp of the mitochon-       haplotypes (A–D) for spotted and cave hyenas, where
drial cytochrome b gene from 23 spotted hyena museum           a maximum of 2 deduced haplotypes separate observed
specimens and 340 bp from 7 brown and 13 striped hyena         haplotypes within a group, while between 6 and 20 deduced
museum specimens, either as a single piece or in two over-     haplotypes separate the different groups from each other
lapping fragments. These specimens cover the current and       (fig. 1). In the tree analyses, three (A–C) of these four hap-
historical range of spotted, striped, and brown hyenas.        lotype groups are recovered as monophyletic clades (boot-
      The spotted hyenas carried 12 haplotypes (unique         strap support 68%–96%, fig. 2 and Supplementary Material
sequences), whereas the striped and brown hyenas carried       online), while group D consists of a single sequence falling
only 4 and 1 haplotype, respectively. We also amplified the    basal to other spotted hyena sequences. This sequence
366-bp piece in four overlapping fragments (93–121 bp          comes from the single East Asian sample and differs
excluding primers) for 23 Pleistocene cave hyenas. For         by 18–22 differences from the other spotted/cave hyena
three additional samples, we reconstructed the 366-bp piece    sequences. However, it clearly is a spotted hyena sequence,
using shorter fragments (41–89 bp excluding primers,           as it differs at 41–45 positions from striped and brown hy-
Supplementary Material online). For 15 of the Pleistocene      ena sequences. Each possible pair of clades A–C is distin-
samples, we found consistent changes between the first and     guished by eight mutational steps (fig. 1), arguing for
the second amplification in one or several fragments, indi-    a temporally close divergence of these three clades. In clade
cating that in these cases, amplifications started from a      A, Pleistocene and extant spotted hyena mitochondrial
single strand of damaged DNA (Hofreiter et al. 2001a).         DNA (mtDNA) sequences are intermingled, whereas two
Pleistocene and Holocene Hyena Genetics 2437

                                                                               divergence was dated to be about 0.13 MYA. For the lower
                                                                               values, it is not possible to estimate CIs using r8s.
                                                                                     In Europe, the cave hyena haplotypes from the two
                                                                               clades (A and B) show complete geographic overlap
                                                                               (fig. 3 and Hofreiter et al. 2004b). Contrary to this, spotted
                                                                               hyenas in Africa show a strong phylogeographic pattern
                                                                               (fig. 3a), where one clade (C) occurs in the south and
                                                                               the other clade (A) in the north of Africa. Both clades show
                                                                               some overlap in their geographic distribution around the
                                                                               equator. In striped hyenas, no phylogeographic pattern ex-
                                                                               ists as all four haplotypes were found in Africa and three of
                                                                               the four haplotypes outside Africa (fig. 4). Finally, all seven
                                                                               brown hyenas analyzed had identical mtDNA sequences
                                                                               (fig. 5).

                                                                               Discussion
                                                                               Reliability of the Pleistocene Sequences
                                                                                     Due to the fact that Pleistocene bones usually contain
                                                                               only small amounts of DNA, sequences obtained from such
                                                                               samples may be affected by contamination (Kolmann and
                                                                               Tuross 2000; Hofreiter et al. 2001b; Wandeler et al. 2003;
                                                                               Serre et al. 2004) or DNA damage (Hansen et al. 2001; Ho-
                                                                               freiter et al. 2001a; Gilbert et al. 2003). For several reasons,
                                                                               this is unlikely in our study.
                                                                                     First, no haplotypes are shared between Holocene and
                                                                               Pleistocene spotted hyenas. Second, we amplified the frag-
                                                                               ments using several overlapping PCRs. If cross-contamination
                                                                               with PCR products from previous amplifications had af-
                                                                               fected our results, we would expect to see mosaic haplo-
                                                                               types, which is not the case. Third, all sequences show an
      FIG. 2.—Neighbor-joining trees for the hyena sequences analyzed.         open reading frame as expected for a part of the cytochrome
The numbers show the estimated age of some of the nodes in million years       b gene. Moreover, for those amino acid positions that differ
B.P. The bar represents 1% sequence divergence. (a) Tree for spotted hye-
nas, based on 366 bp of mitochondrial cytochrome (cyt)-b DNA sequence.         between Pleistocene and Holocene samples, the Pleistocene
The positions of cave hyenas are shown by red arrows. The haplotype also       state was found in other extant mammal species. Finally,
found in the Altai is marked with an asterisk. Bootstrap values that support   we amplified each sequence position at least twice for all
the different clades are 92%, 94%, and 79% for clades A, B, and C, re-         Pleistocene samples. When we observed consistent substi-
spectively. The monophyly of clades A–C to the exclusion of clade D
is supported by 94% bootstrap value. Bootstrap values for maximum likeli-
                                                                               tutions, a third amplification was performed to determine
hood and maximum parsimony trees are provided in Supplementary Fig. 2          the correct nucleotide, making it highly unlikely that incor-
(Supplementary Material online). (b) Tree for brown and striped hyenas,        rect sequence positions were determined (Hofreiter et al.
based on 340 bp of mitochondrial cyt-b DNA sequence.                           2001a). We therefore conclude that neither contamina-
                                                                               tion nor template damage is likely to have affected our
                                                                               results.
other clades contain exclusively Pleistocene (B) or extant
(C) hyena mtDNA sequences.
                                                                               Phylogenetic Position of Cave Hyenas
      As a maximum likelihood ratio test did not reject the
assumption of a molecular clock, we estimated the age of                            Cave hyenas, that is, Pleistocene specimens from
divergence events, using a point estimate of 10 Myr for the                    Eurasia that belong to the genus Crocuta, are usually consid-
divergence between spotted and striped/brown hyenas as                         ered a subspecies, C. crocuta spelaea, of the spotted hyena
a calibration date (Wayne et al. 1989; Werdelin and                            (Kurten 1957, 1968; Turner 1984; Werdelin and Solounias
Solounias 1991). The MRCA of all spotted hyena mtDNA                           1991) or a different species (C. spelaea; Soergel 1937;
sequences was estimated to be about 3.48 MYA (confi-                           Musil 1962; Markova et al. 1995; Baryshnikov 1999). Al-
dence interval [CI]: 2.25–5.09 MYA), whereas the MRCA                          though some substructure is present with monophyletic
of the remaining three clades A–C was estimated to be                          clades with either some Eurasian or some African hyena
1.26–1.46 MYA (CI: 0.83–2.4 MYA). Finally, the age                             sequences (figs. 1 and 2), neither of the two groups is mono-
of the youngest node containing all Eurasian Pleistocene                       phyletic as a whole. Thus, our data support neither of these
and modern DNA sequences within clade A was estimated                          classifications. Interestingly, despite this lack of phyloge-
to be about 0.36 MYA, while the node of clade C was                            netic separation, there are a number of morphological
estimated to be about 0.17 MYA (fig. 2a). For striped hy-                      characters that distinguish Eurasian spotted hyenas from
enas, we found a date for the MRCA of about 0.34 MYA                           African ones such as different body proportions (Kahlke
(fig. 2b). Within striped hyenas, the most recent sequence                     1994), a slightly different cranial morphology, and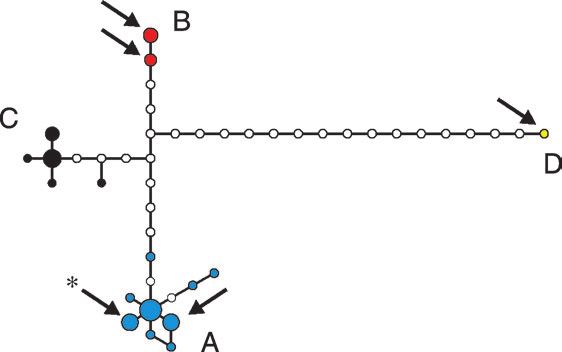
2438 Rohland et al.

     FIG. 3.—Geographical distribution of mtDNA sequences from spotted and cave hyenas. The colors correspond to clades A–D. Red arrows show the
phylogenetic position of cave hyena mtDNA sequences. The haplotype also found in the Altai is marked with an asterisk. Each dot represents one
individual. (a) View of the complete area investigated. The inserted tree is the same tree as in figure 2a. (b) Enlarged view of cave hyena mtDNA
sequence distribution in Europe.

differences in jaw and teeth (Nagel, Pacher, and Morlo                        sively to either Eurasian (B and D) or African hyenas (C).
2005). It has been shown that neutral markers such as                         Moreover, none of the nine haplotypes is shared between
mtDNA sequences can be poor predictors for ecological                         Africa and Eurasia even in clade A, which contains mtDNA
adaptations (reviewed in McKay and Latta 2002), which                         sequences from both continents. Thus, it is likely that Eur-
may persist even in the presence of high gene flow between                    asian and African populations were connected only tempo-
populations (Smith et al. 1997; Saint-Laurent, Legault, and                   rarily during their history when the climatic conditions
Bernatchez 2003). Thus, Pleistocene spotted hyenas from                       allowed migrations between the continents.
Eurasia may have preserved certain adaptive traits despite                          The occurrence of sequences from clade A in both
gene flow from African populations.                                           Africa and Eurasia is evidence for a recent dispersal event
                                                                              as the divergence of the Eurasian from the African sequen-
Spotted Hyena Dispersal                                                       ces was estimated to be about 0.36 MYA (figs. 2a and 6c).
                                                                              As the number of African haplotypes in clade A is larger
    Based on the topology of both the network and the                         than that of Eurasian ones (seven vs. two) and the Eurasian
phylogenetic tree, a panmictic African-Eurasian spotted                       haplotypes are nested within the African haplotypes, it is
hyena population is unlikely, as under such a scenario,                       likely that this migration took place from Africa to Eurasia.
we should not have found mtDNA clades belonging exclu-                        The oldest spotted hyena fossils in Europe, dated at 0.8
                                                                              MYA (Garcia and Arsuaga 1999), argue for at least one
                                                                              additional, earlier dispersal of spotted hyenas from Africa
                                                                              to Europe. In the mtDNA sequences, this event is most

     FIG. 4.—Map showing the geographical distribution of mtDNA se-
quences from striped hyenas. One dot represents two individuals. The four
sequences are shown in different colors. The inserted tree is the same tree      FIG. 5.—Map showing the location of the brown hyena samples.
as in figure 2b.                                                              Some dots represent more than one individual.
Pleistocene and Holocene Hyena Genetics 2439
FIG. 6.—Timing and likely routes of migration of spotted and striped hyenas. (a) The earliest migration of spotted hyenas started less than about 3.5
MYA, most likely from the area where the first spotted hyena fossils were found, reaching East Asia and most likely also Pakistan. (b) The second
migration of spotted hyenas, less than 1.3–1.5 MYA, resulted in the first arrival of hyenas in Europe and a separation of African spotted hyenas in
a southern and a northern population. (c) The third spotted hyena migration took place after 0.36 MYA, starting from the northern African population
and reaching both Europe and Asia. (d) Striped hyenas expanded their habitat from a small refugia population in Africa after 0.13 MYA, spreading across
Africa and to Asia.
likely recorded by clade B, as the divergence of clades A–C hyenas from East Asia (Baryshnikov 1999). However, as
took place about 1.3–1.5 MYA and molecular divergence the conclusions with regard to clade D are based on a single
predate population divergence (Nei 1986). Finally, the old- sequence, further sampling in Asia may well lead to the de-
est spotted hyena fossils in Africa at 3.46 MYA (Barry tection of additional dispersal events both between Africa
1987; Turner 1990) and in Asia at 2.6–3.7 MYA (de and Asia and within Asia itself and thus complicate the
Vos, Leinders, and Hussain 1987) argue for a third dispersal scenario proposed above.
event separating clade D from the three other clades. Two Despite being based on just 366 bp mtDNA sequence,
reasons argue for a geographical origin of both clade B and the estimated divergence dates correlate well with the fossil
clade D in Africa rather than in Asia (fig. 6a and b). First, record. The age of the oldest fossils in both Asia and Africa
the divergence of clades A–C took place around the same are about 3.5 Myr, in good agreement with the estimate of
time, arguing for a single cause that separated an ancestral dispersal between these two areas less than about 3.5 MYA.
population into three subpopulations which gave rise to Similarly, considering the fact that sequence divergence
clades A–C. As this event eventually resulted in the phy- may considerably predate population divergence (Edwards
logeographic separation of African spotted hyenas into and Beerli 2000), a first migration from Africa to Europe
a northern and a southern group, it is likely to have taken about 1 MYA (Turner 1992; Kahlke 1994; Lahr and Foley
place in Africa. Second, there is no evidence that after the 1998) is consistent with the estimated age of the divergence
initial divergence between clade D and all other lineages, of clades A–C about 1.3–1.5 MYA.
descendants of clade D migrated from Asia to Europe or
Africa. However, it should be noted that neither the topol-
Phylogeography of Spotted Hyenas in Africa
ogy of the phylogenetic tree nor the fossil record precludes
the possibility that the origin of the genus Crocuta was in Contrary to spotted hyenas in Europe (Hofreiter et al.
Asia, as originally proposed (Kurten 1956). Independent of 2004b), the mtDNA sequences of spotted hyenas in Africa
the direction of migration, the deep divergence between show a strong phylogeographic pattern, with clade C in the
clade D and the other lineages raises the possibility that south and clade A in the north of Africa and limited geo-
the earliest Crocuta populations in Asia dating to more graphical overlap of the two clades around the equator (fig.
than 3 MYA were the ancestors of the Late Pleistocene 3). As cytochrome b is less variable than the mitochondrial2440 Rohland et al.
control region, it is possible that the latter marker would This scenario would explain both the large geographical
reveal additional structure within spotted hyenas, similar distance between identical genotypes within a clade and
to other African species, which were found to show a variety the limited geographical overlap between clades of spotted
of phylogeographic patterns (e.g., Simonsen, Siegismund, hyenas in Africa. Unfortunately, our sampling in Africa
and Arctander 1998; Arctander, Johansen, and Coutellec- is too limited in numbers to pinpoint possible areas for
Vreto 1999; Matthee and Robinson 1999; Flagstad et al. Pleistocene refugia by searching for clines in genetic diver-
2001; Girman et al. 2001; Nersting and Arctander 2001; sity. Similarly, due to the limited sampling, we cannot draw
Uphyrkina et al. 2001; Muwanika et al. 2003). Unfortu- conclusions about possible phylogeographic patterns of
nately, only some of these studies cover a geographical cave hyenas in Asia.
range similar to our sampling of spotted hyenas, as most
studies concentrate on the more southern parts of Africa. Striped Hyenas
Of three species sampled across a similar geographical
range as the spotted hyena, warthog and hartebeest Although striped hyenas occur across a large geo-
(Arctander, Johansen, and Coutellec-Vreto 1999; Flagstad graphical area, we found only four different sequences, with
et al. 2001; Muwanika et al. 2003) also show the deepest two variable positions in the 13 striped hyenas studied. The
phylogeographic split between northern and southern pop- low genetic diversity and the fact that all haplotypes that
ulations, while leopard shows no phylogeographic sub- were carried by more than one individual occurred across
division for mtDNA sequences in Africa (Uphyrkina et al. large geographical distances suggest that the current habitat
2001). For two more species, roan (Matthee and Robinson of striped hyenas is a result of a recent expansion from a sin-
1999) and African wild dog (Girman et al. 2001), similarly gle Pleistocene refugium, as it has been suggested for
a deep phylogenetic split between northern and southern a number of European species with similarly low amounts
Africa was found, although the two wild dog clades have of genetic diversity, such as wolverine (Walker et al. 2001),
a large geographical overlap. otter (Cassens et al. 2000; Ferrando et al. 2004), and lynx
Two major explanations have been offered for north- (Hellborg et al. 2002). As only few Pleistocene fossils of
south phylogeographic patterns in Africa, the formation of striped hyenas are known from outside of Africa (Kurten
the rift valley and restriction of animal populations into 1965; Werdelin and Solounias 1991), the glacial refugium
refugia during glacial cycles (e.g., Flagstad et al. 2001; of striped hyenas was most likely in Africa.
Girman et al. 2001). For two reasons, we consider the Similar to the results for spotted hyenas, identical
restriction of populations to glacial refugia more likely. sequences were found large distances apart from each other,
First, the formation of the African rift valley started ap- up to more than 7,000 km. The most common haplotype in
proximately 25 MYA (Beyene and Abdelsalam 2005) and striped hyenas was found from West Africa across North
was completed long before the genetic split between the Africa to Siberia, and the other two haplotypes that were
two African populations occurred. The formation substan- detected in more than one individual also occurred over
tially predates the separation of northern and southern large geographical distances (fig. 4). Thus, the expansion
clades in both hartebeest (Flagstad et al. 2001) and wild of the geographical range, including the emigration from
dog (Girman et al. 2001), too. Second, it separates the mid- Africa, must have been rapid. Although our data only allow
dle part of Eastern Africa from the rest of the continent. estimating the striped hyena migration to younger than 0.13
Despite the strong phylogeographic pattern, we found Myr (figs. 2b and 6d), this event must have been more re-
identical sequences up to 4,500 km apart from each other cent as all sequences found in Asia have identical counter-
in African spotted hyenas. Thus, within phylogeographic parts in Africa (fig. 4). Kurten (1965) argued that size
groups, extant spotted hyenas from Africa resemble Pleis- differences between fossil striped hyenas of different ages
tocene spotted hyenas from Eurasia in that identical sequen- from the Levant show an emigration of striped hyenas from
ces are found at great geographical distances. However, Africa as recently as in Neolithic times. If the expansion of
contrary to the situation in Europe, almost no overlap exists the geographical range indeed took place so recently it
in the geographical range of the two spotted hyena clades in would explain that, given the small sample number and
Africa. Two factors may have contributed to these patterns. sequence length, we do not see a signal of a demographic
First, the time available for gene flow between different expansion in the striped hyena data.
clades after expansion from refugia may play a critical role
(Hofreiter et al. 2004b). If African hyenas expanded from
Brown Hyenas
two Pleistocene refugia after the end of the last glacial max-
imum, the 10,000 years since then may not have allowed for Brown hyenas are even more depleted in genetic
sufficient gene flow to result in large-scale geographical diversity than striped hyenas, as all seven individuals we
mixing of the two mtDNA clades as observed in Europe. sequenced plus the one from the database carry identical
Second, rapid expansions into empty habitats immediately mtDNA sequences. Similar to their current distribution, fos-
after the end of a glacial maximum could explain the oc- sil remains of brown hyenas are found only in southern
currence of identical haplotypes over large geographical Africa (Turner 1990). Thus, it is likely that brown hyenas
distances. Both lower population densities and empty hab- always occupied a comparatively small geographic area
itats have been shown to result in presaturation dispersal in and may have been particularly vulnerable to environmen-
several large mammals, that is, dispersal of animals before tal changes. However, brown hyenas are not unique with
the carrying capacity of a habitat is reached (Cheeseman regard to low genetic diversity. There is in fact increas-
et al. 1988; Swenson, Sandegren, and Soderberg 1998). ing evidence that Pleistocene climate shifts had a strongPleistocene and Holocene Hyena Genetics 2441
influence not only on Holarctic species (Hewitt 2000) but and Ethnography, Novosibirsk Institute of Archaeology and
also on African species (e.g., Matthee and Robinson 1997; Ethnography), and Reinhard Ziegler (Natural History Mu-
Flagstad et al. 2001; Matthee and Flemming 2002; Leonard seum, Stuttgart) for providing samples; and Robert Wayne
et al. 2005). In addition to brown and striped hyenas, two and Klaus-Peter Koepfli for providing an unpublished spot-
more large African carnivores, cheetahs (Freeman et al. ted hyena sequence for primer design. J.P. was supported by
2001) and lions (Burger et al. 2004), show low levels of National Institutes of Health grant GM-40282 (to M. Slatkin).
mtDNA sequence diversity. Thus, of six species of large This work was funded by the Max Planck Society and the
African carnivores only leopard (Uphyrkina et al. 2001) Deutsche Forschungsgemeinschaft.
and spotted hyenas (this study) do not show evidence for
a recent decrease in population size. It would be interesting Literature Cited
to investigate whether the reduction in genetic diversity in
the other four species took place around the same time and Arctander, P., C. Johansen, and M. A. Coutellec-Vreto. 1999.
may therefore have a common cause. Phylogeography of three closely related African bovids (tribe
Alcelaphini). Mol. Biol. Evol. 16:1724–1739.
Bandelt, H. J., P. Forster, and A. Röhl. 1999. Median-joining
Conclusions networks for inferring intraspecific phylogenies. Mol. Biol.
Evol. 16:37–48.
The phylogeographic distribution of mtDNA haplo- Barry, J. C. 1987. Larger carnivores (Canidae, Hyaenidae, Felidae)
types indicates three migration events from Africa to from Laetoli. Pp. 235–258 in M. D. Leakey and J. M. Harris, eds.
Eurasia for spotted hyenas and a recent habitat expansion Laetoli: a Pliocene site in Tanzania. Oxford Clarendon Press.
of striped hyenas across Africa and Asia from a small Af- Baryshnikov, G. 1999. Chronological and geographical variability
rican population. The data also indicate rapid expansions of of Crocuta spelaea (Carnivora, Hyaenidae) from the Pleisto-
the geographical range in both species. However, extant cene of Russia. Pp. 155–174 in G. Haynes, J. Klimovicz, and
spotted hyenas in Africa show a marked phylogeographic J. W. F. Reumer, eds. Mammoths and the mammoth fauna:
pattern with one mtDNA sequence clade in the north and studies of an extinct ecosystem. Natural History Museum,
a second in the south, similar to several other African spe- Rotterdam.
Beyene, A., and M. G. Abdelsalam. 2005. Tectonics of the Afar
cies. Little genetic diversity in striped and brown hyenas
depression: a review and synthesis. J. Afr. Earth Sci. 41:41–59.
indicates population bottlenecks in these species during Bothma, J. d. P. 1998. Carnivore ecology in arid lands. Springer
the Pleistocene, a pattern shared with other African carni- Verlag, Berlin.
vores. These results are further evidence of the importance Bothma, J. d. P., and C. Walker. 1999. Larger carnivores of the
of glacial cycles in shaping genetic diversity of animal pop- African savannas. Springer-Verlag, New York.
ulations also in Africa. Finally, we found that spotted hyena Burger, J., W. Rosendahl, O. Loreille, H. Hemmer, T. Eriksson,
from Africa and cave hyenas from Eurasia are intermingled A. Götherström, J. Hiller, M. J. Collins, T. Wess, and K. W.
in phylogenetic analyses. This result questions a taxonomic Alt. 2004. Molecular phylogeny of the extinct cave lion
delineation of the Pleistocene spotted hyenas as a subspecies Panthera leo spelaea. Mol. Phylogenet. Evol. 30:841–849.
or even species distinct from extant spotted hyenas. Cassens, I., R. Tiedemann, F. Suchentrunk, and G. Hartl. 2000.
Mitochondrial DNA variation in the European otter (Lutra
lutra) and the use of spatial autocorrelation analysis in conser-
Supplementary Material vation. J. Hered. 91:31–35.
Cheeseman, C. L., W. J. Cresswell, S. Harris, and P. J. Mallinson.
Supplementary Table 1 and Figure 2 and details are 1988. Comparison of dispersal and other movements in 2
available at Molecular Biology and Evolution online badger (Meles meles) populations. Mamm. Rev. 18:51–59.
(http://www.mbe.oxfordjournals.org/). de Vos, J., J. J. M. Leinders, and S. T. Hussain. 1987. A historical
review of the Siwalik Hyaenidae (Mammalia, Carnivora) and
description of two new finds from the Upper Siwalik of
Acknowledgments Pakistan. Palaentology, Proc. B 90:333–369.
We thank many collaborators from the Max Planck Edwards, S. V., and P. Beerli. 2000. Perspective: gene divergence,
population divergence, and the variance in coalescence time
Institute for Evolutionary Anthropology for helpful discus-
in phylogeographic studies. Evol. Int. J. Org. Evol. 54:
sion; Knut Finstermeier for help with the figure design; 1839–1854.
Gennady Baryshnikov (Zoological Institute, Russian Acad- Ferrando, A., M. Ponsa, J. Marmi, and X. Domingo-Roura. 2004.
emy of Science, St. Petersburg), Alan Cooper (Ancient Eurasian otters, Lutra lutra, have a dominant mtDNA haplo-
Biomolecules Center, Oxford), Anatoly P. Derevianko type from the Iberian Peninsula to Scandinavia. J. Hered.
(Institute of Archaeology and Ethnography, Novosibirsk 95:430–435.
Institute of Archaeology and Ethnography), Mietje Flagstad, O., P. Syvertsen, N. Stenseth, and K. Jakobsen. 2001.
Germonpré (Departement Paleontologie KBIN, Brussels), Environmental change and rates of evolution: the phylogeo-
Peter Giere (Natural History Museum, Berlin), Gudrun graphic pattern within the hartebeest complex as related to cli-
Höck (Natural History Museum, Vienna), Susan Keates matic variation. Proc. R. Soc. Lond. B Biol. Sci. 268:667–677.
Freeman, A., D. MacHugh, S. McKeown, C. Walzer, D. McConnell,
(United Kingdom), László Kordos (Geological Institute
and D. Bradley. 2001. Sequence variation in the mitochondr-
of Hungary, Budapest), Bogdan Ridush (Institute for ial DNA control region of wild African cheetahs (Acinonyx
Geographie, Czernowitz), Christel Russe (Natural History jubatus). Heredity 86:355–362.
Museum, Gera), Martin Sabol (Institute of Geology, Garcia, N., and J. L. Arsuaga. 1999. Carnivores from the early
University of Bratislava), Charles Schouwenburg (The Pleistocene hominid-bearing Trinchera Dolina 6 (Sierra de
Netherlands), Michael V. Shunkov (Institute of Archaeology Atapuerca, Spain). J. Hum. Evol. 37:415–430.2442 Rohland et al. Gilbert, M. T., A. J. Hansen, E. Willerslev, L. Rudbeck, I. Barnes, Matthee, C. A., and T. J. Robinson. 1997. Molecular phylogeny of N. Lynnerup, and A. Cooper. 2003. Characterization of genetic the springhare, Pedetes capensis, based on mitochondrial DNA miscoding lesions caused by postmortem damage. Am. J. sequences. Mol. Biol. Evol. 14:20–29. Hum. Genet. 72:48–61. ———. 1999. Mitochondrial DNA population structure of roan Girman, D. J., C. Vila, E. Geffen, S. Creel, M. G. L. Mills, J. W. and sable antelope: implications for the translocation and McNutt, J. Ginsberg, P. W. Kat, K. H. Mimiya, and R. K. conservation of the species. Mol. Ecol. 8:227–238. Wayne. 2001. Patterns of population subdivision, gene flow McKay, J. K., and R. G. Latta. 2002. Adaptive population and genetic variability in the African wild dog (Lycaon pictus). divergence: markers, QTL and traits. Trends Ecol. Evol. Mol. Ecol. 10:1703–1723. 17:285–291. Hansen, A., E. Willerslev, C. Wiuf, T. Mourier, and P. Arctander. Musil, R. 1962. Die Höhle Sveduv stul. Ein typischer 2001. Statistical evidence for miscoding lesions in ancient Hyänenhorst. Anthropos 13:97–260. DNA templates. Mol. Biol. Evol. 18:262–265. Muwanika, V. B., S. Nyakaana, H. R. Siegismund, and P. Hasegawa, M., H. Kishino, and T. A. Yano. 1985. Dating of the Arctander. 2003. Phylogeography and population structure human ape splitting by a molecular clock of mitochondrial- of the common warthog (Phacochoerus africanus) inferred DNA. J. Mol. Evol. 22:160–174. from variation in mitochondrial DNA sequences and microsa- Hellborg, L., C. Walker, E. Rueness, J. Stacy, I. Kojola, H. Vald- tellite loci. Heredity 91:361–372. mann, C. Vila, B. Zimmermann, K. Jakobsen, and H. Ellegren. Nagel, D., M. Pacher, and M. Morlo. 2005. Late Pleistocene cave 2002. Differentiation and levels of genetic variation in northern hyena from the Teufelslucke/Austria. Prehistoire et Anthro- European lynx (Lynx lynx) populations revealed by microsatel- plogie Méditerréennes (in press). lites and mitochondrial DNA analysis. Conserv. Genet. 3: Nei, M. 1986. Stochastic errors in DNA evolution and molecular 97–111. phylogeny. Pp. 133–147 in H. Gershowitz, D. L. Rucknagel, Hewitt, G. 2000. The genetic legacy of the Quaternary ice ages. and R. E. Tashian, eds. Evolutionary perspectives and the new Nature 405:907–913. genetics. Alan R. Liss, Inc., New York. Hofreiter, M., V. Jaenicke, D. Serre, A. Haeseler Av, and S. Pääbo. Nersting, L. G., and P. Arctander. 2001. Phylogeography and con- 2001a. DNA sequences from multiple amplifications reveal servation of impala and greater kudu. Mol. Ecol. 10:711–719. artifacts induced by cytosine deamination in ancient DNA. Nu- Posada, D., and K. A. Crandall. 1998. MODELTEST: testing the cleic Acids Res. 29:4793–4799. model of DNA substitution. Bioinformatics 14:817–818. Hofreiter, M., D. Serre, H. N. Poinar, M. Kuch, and S. Pääbo. Rohland, N., H. Siedel, and M. Hofreiter. 2004. Nondestructive 2001b. Ancient DNA. Nat. Rev. Genet. 2:353–359. DNA extraction method for mitochondrial DNA analyses of Hofreiter, M., G. Rabeder, V. Jaenicke-Despres, G. Withalm, D. museum specimens. Biotechniques 36:814–816, 818–821. Nagel, M. Paunovic, G. Jambresic, and S. Pääbo. 2004a. Saint-Laurent, R., M. Legault, and L. Bernatchez. 2003. Divergent Evidence for reproductive isolation between cave bear popu- selection maintains adaptive differentiation despite high gene lations. Curr. Biol. 14:40–43. flow between sympatric rainbow smelt ecotypes (Osmerus Hofreiter, M., D. Serre, N. Rohland, G. Rabeder, D. Nagel, N. mordax Mitchill). Mol. Ecol. 12:315–330. Conard, S. Münzel, and S. Pääbo. 2004b. Lack of phylogeog- Sanderson, M. J. 2003. r8s: inferring absolute rates of molecular raphy in European mammals before the last glaciation. Proc. evolution and divergence times in the absence of a molecular Natl. Acad. Sci. USA 101:12963–12968. clock. Bioinformatics 19:301–302. Kahlke, R.-D. 1994. Die Entstehungs-, Entwicklungs- und Serre, D., A. Langaney, M. Chech, M. Teschler-Nicola, M. Verbreitungsgeschichte des oberpleistozänen Mammuthus- Paunovic, P. Mennecier, M. Hofreiter, G. Possnert, and S. Coelodonta-Faunenkomplexes in Eurasien (Großsäuger). Pääbo. 2004. No evidence of neandertal mtDNA contribution Abh. Senkenb. Naturforsch. Ges. 546:1–164. to early modern humans. PLoS Biol. 2:313–317. Kolmann, C. J., and N. Tuross. 2000. Ancient DNA analysis of Simonsen, B., H. Siegismund, and P. Arctander. 1998. Population human populations. Am. J. Phys. Anthropol. 111:5–23. structure of African buffalo inferred from mtDNA sequences Kurtén, B. 1956. The status and affinities of Hyena sinensis and microsatellite loci: high variation but low differentiation. Owen and Hyena ultima Matsumoto. Am. Mus. Novit. Mol. Ecol. 7:225–237. 1764:1–48. Smith, T. B., R. K. Wayne, D. J. Girman, and M. W. Bruford. ———. 1957. The bears and hyenas of the interglacials. Quater- 1997. A role for ecotones in generating rainforest biodiversity. naria 4:69–81. Science 276:1855–1857. ———. 1965. The carnivora of the Palestine caves. Acta Zool. Soergel, W. 1937. Die Stellung der Hyaena spelaea GOLDF. aus Fenn. 107:1–74. der Lindentaler Hyänenhöhle bei Gera. Beitr. Geol. Thüringen ———. 1968. Pleistocene mammals of Europe. Weidenfeld and 4:171–189. Nicholson, London. Swenson, J. E., F. Sandegren, and A. Soderberg. 1998. Geo- Lahr, M. M., and R. A. Foley. 1998. Towards a theory of modern graphic expansion of an increasing brown bear population: ev- human origins: geography, demography, and diversity in idence for presaturation dispersal. J. Anim. Ecol. 67:819–826. recent human evolution. Yearb. Phys. Anthropol. 41:137–176. Swofford, D. L. 1998. PAUP*: phylogenetic analysis using par- Leonard, J. A., N. Rohland, S. Glaberman, R. C. Fleischer, A. simony (*and other methods). Sinauer Associates, Sunderland, Caccone, and M. Hofreiter. 2005. A rapid loss of stripes: Mass. the evolutionary history of the extinct quagga. Biol. Lett., Turner, A. 1984. The interpretation of variation in fossil speci- 1:291–295. mens of spotted hyena (Crocuta crocuta Erxleben, 1777) from Markova, A. K., N. G. Smirnov, A. V. Kozharinov, N. E. Sterkfontein valley sites (mammalian: carnivora). Ann. Trans- Kazantseva, A. N. Simakova, and L. M. Kitaev. 1995. vaal Mus. 33:399–418. Late Pleistocene distribution and diversity of mammals in ———. 1990. The evolution of the guild of larger terrestrial northern Eurasia (PALEOFAUNA Database). Paleontol. Evol. carnivores during the Pliopleistocene in Africa. Geobios 28–29:5–134. 23:349–368. Matthee, C. A., and A. F. Flemming. 2002. Population fragmen- ———. 1992. Villafranchian-Galerian larger carnivores of tation in the southern rock agama, Agama atra: more evidence Europe: dispersions and extinctions. Cour. Forsch. Inst. for vicariance in southern Africa. Mol. Ecol. 11:465–471. Senckenb. 153:153–160.
Pleistocene and Holocene Hyena Genetics 2443

Uphyrkina, O., W. E. Johnson, H. Quigley, D. Miquelle, L.            the Carnivora. Pp. 465–494 in J. L. Gittleman, ed. Carnivore
  Marker, M. Bush, and S. J. O’Brien. 2001. Phylogenetics,           behavior, ecology, and evolution. Cornell University Press,
  genome diversity and origin of modern leopard, Panthera            New York.
  pardus. Mol. Ecol. 10:2617–2633.                                 Werdelin, L., and N. Solounias. 1991. The Hyaenidae: taxonomy,
Walker, C., C. Vila, A. Landa, M. Linden, and H. Ellegren. 2001.     systematics and evolution. Fossils Strata 30:1–104.
  Genetic variation and population structure in Scandinavian       Yang, Z. 1996. Among-site variation and its impact on phyloge-
  wolverine (Gulo gulo) populations. Mol. Ecol. 10:53–63.            netic analyses. Trends Ecol. Evol. 11:367–371.
Wandeler, P., S. Smith, P. A. Morin, R. A. Pettifor, and S. M.
  Funk. 2003. Patterns of nuclear DNA degeneration over
  time—a case study in historic teeth samples. Mol. Ecol.          William Martin, Associate Editor
  12:1087–1093.
Wayne, R. K., R. E. Benveniste, D. N. Janczewski, and S. J.
  O’Brien. 1989. Molecular and biochemical evolution of            Accepted August 3, 2005
You can also read